Territorializing International Travel Emissions: Geography and Magnitude of the Hidden Climate Footprint of Brussels
←
→
Page content transcription
If your browser does not render page correctly, please read the page content below
Urban Planning (ISSN: 2183–7635)
                                                                                      2021, Volume 6, Issue 2, Pages 285–298
                                                                                                DOI: 10.17645/up.v6i2.3905

Article
Territorializing International Travel Emissions: Geography and Magnitude
of the Hidden Climate Footprint of Brussels
Kobe Boussauw 1, * and Jean‐Michel Decroly 2
1 Cosmopolis Centre for Urban Research, Department of Geography, Vrije Universiteit Brussel, 1050 Brussels, Belgium;
E‐Mail: kobe.boussauw@vub.be
2 Institute for Environmental Management and Land‐Use Planning, Department of Geosciences, Environment and Society,

Université Libre de Bruxelles, 1050 Brussels, Belgium; E‐Mail: jean‐michel.decroly@ulb.ac.be

* Corresponding author

Submitted: 10 December 2020 | Accepted: 25 February 2021 | Published: 9 June 2021

Abstract
In the present article we investigate the geography and magnitude of the climate footprint of long‐distance travel with
Brussels, Belgium, as a destination. The internationally networked position of this city goes hand in hand with a strong
dependence on international mobility, which largely materializes in impressive volumes of long‐distance travel and associ‐
ated consumption of important amounts of fossil fuel. Despite a surge in concerns about global warming, the climate foot‐
print of most international travel, notably air travel, is not included in the official national and regional climate inventories,
or in other words, it is not territorialized. The official climate footprint of the Brussels‐Capital Region attained 3.7 Mton
CO2 eq per year (in 2017). Based on our exploratory calculations, however, the total estimated climate footprint of all
Brussels‐bound international travel equalled an additional 2.7 Mton CO2 eq. In terms of geographical distribution, over
70% of international travellers to Brussels come from Europe, while these represent only 15% of the climate footprint of
all international travel to Brussels. We conclude that the practice of not allocating emissions caused by international travel
to territorial units has kept the magnitude and complexity of this problem largely under the radar and contributes to the
lack of societal support for curbing growth of international aviation.

Keywords
air travel; Brussels; cities; climate footprint; tourism

Issue
This article is part of the issue “Cities, Long‐Distance Travel, and Climate Impacts” edited by Jukka Heinonen (University of
Iceland, Iceland) and Michał Czepkiewicz (University of Iceland, Iceland / Adam Mickiewicz University in Poznań, Poland).

© 2021 by the authors; licensee Cogitatio (Lisbon, Portugal). This article is licensed under a Creative Commons Attribu‐
tion 4.0 International License (CC BY).

1. Introduction: A Territorial Approach to the Climate               Kyoto protocol (Gössling, 2013), according to prevailing
Footprint of International Travel                                    agreements. While in recent years serious efforts were
                                                                     done to also make aviation accountable for its contri‐
Although the climate footprint of long‐distance travel               bution to global warming, through instruments such as
is not a new object of study in the academic literature              the EU Emissions Trading System (within the European
(see, e.g., Patterson & McDonald, 2004; Sun, Cadarso,                Economic Area, since 2012) and the aviation sector’s own
& Driml, 2020; Wood, Bows, & Anderson, 2010), the                    carbon offset scheme CORSIA (as from 2021; Larsson,
theme has only recently seeped into the public climate               Elofsson, Sterner, & Åkerman, 2019), governments of
debate (Wolrath Söderberg & Wormbs, 2019) and is not                 nations, regions, or cities are not eager to recognize own‐
included in often‐cited indicators such as national green‐           ership of the emissions that are associated with long‐
house gas inventories that need to be maintained by all              distance travel towards or from their territories. This
industrialized countries (‘Annex I countries’) under the             attitude is implicitly supported by national greenhouse

Urban Planning, 2021, Volume 6, Issue 2, Pages 285–298                                                                       285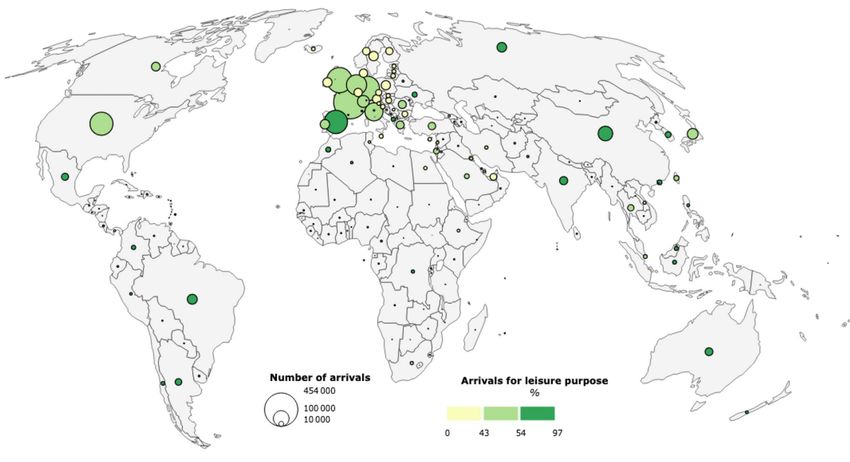
gas inventory regulations that do not allocate such emis‐     aged to develop international networks and are there‐
sions to individual countries (Warnecke, Schneider, Day,      fore supposed to travel on a regular basis, often by
La Hoz Theuer, & Fearnehough, 2019). The complexity of        air (Arsenault, Talbot, Boustani, Gonzàles, & Manaugh,
the climate issue, to which both embedded emissions in        2019; Wynes, Donner, Tannason, & Nabors, 2019). Also,
imported products and the contribution of long‐distance       international politics, such as European institutions, have
travel are of great importance, is hardly recognized in       an important ecological footprint. Moreover, relocation
governmental climate policy plans. Although an inven‐         of families of which one member is active in an inter‐
tory of such plans is beyond the scope of this article,       national sector usually entails additional journeys, for
we quote here the official climate policy plan of our         example by relatives and friends who come over for a
case study, the Brussels‐Capital Region, in which none        visit. The last kind of journeys fall under the category of
of both themes is mentioned (Brussels‐Capital Region,         ‘tourism,’ which in the Global North comprises the bulk
2019). The current territorial approach to the allocation     of all international journeys (Dobruszkes, Ramos‐Pérez,
of climate footprints causes an important bias in the         & Decroly, 2019). The emissions associated with such
way the climate issue is viewed by the public and by          trips are not visible in the national climate inventories.
policy makers. However, both emissions from interna‐
tional transport and imported products are caused by          2. The Case of Brussels, Belgium: A Focal Point of the
consumers, citizens, and organizations that are estab‐        Travel–Climate Issue
lished in certain and identifiable countries and regions.
The emissions from international transport are not only       The aim of this article is to provide insight into the geog‐
absent from the climate inventories but seem also under‐      raphy and magnitude of the climate footprint of the inter‐
exposed in the climate debate itself.                         national attractiveness of a city with an important inter‐
    In fact, the territorial focus of climate inventories     national position as a business and political centre, in
ignores the internationalization of production chains         relation to the official, territorialized climate footprint of
and the structural shift towards service industries           this city. We will explore this issue for the case study of
(tertiarization) of the economy of the most developed         Brussels by taking a traditional bottom‐up approach that
countries. Emissions are viewed as soil‐bound affairs,        estimates climate footprint based on the distribution of
while economic activities have increasingly become foot‐      transport modes used by travellers (Sun & Drakeman,
loose. The shift from a manufacturing to a service            2020). The choice for Brussels was inspired by the role
economy means that emissions got detached from                played by this city as a forum for international political
geolocalized production processes and shifted towards         decision‐making, which includes European climate pol‐
the geographically diffuse sector of long‐distance trans‐     icy, while the city and the activities it hosts are an impor‐
port. Reductions within national industrial production        tant generator of international travel and the related
are clearly visible in the national climate inventories.      climate footprint (Van Parijs & Van Parys, 2010). In what
However, increases in international travel associated with    follows, we consider the Brussels‐Capital Region, which
the rise of the service industry remain invisible in these    is one of the three administrative regions in Belgium
inventories (Afionis, Sakai, Scott, Barrett, & Gouldson,      (next to Flanders and Wallonia), home to 1.2 million res‐
2017; Davis & Caldeira, 2010; Ottelin et al., 2019).          idents, out of 11.5 million Belgians.
    But international travel does not only support the             We start with a look at the official climate foot‐
manufacturing industry. The knowledge industry is             print of Brussels, in relation to its geographical con‐
also an important consumer of air kilometres (Achten,         text. In 2017, according to the Belgian greenhouse
Almeida, & Muys, 2013; Ciers, Mandic, Toth, & Op’t Veld,      gas inventory, the total climate footprint amounted to
2019; Klöwer, Hopkins, Myles, & Higham, 2020), includ‐        114.5 Mton CO2 eq (FPS Public Health, Food Chain Safety
ing participation in scientific meeting (Burtscher et al.,    and Environment, 2019), of which only 3.7 Mton CO2 eq
2020; Nevins, 2014) just like higher education (Davies        (3.2%) was on account of the Brussels‐Capital Region
& Dunk, 2015), notably international student mobility         (Bruxelles Environnement, 2019). This remarkably mod‐
(Shields, 2019), international politics, business travel      est contribution is even more noteworthy when we learn
(Kitamura, Karkour, Ichisugi, & Itsubo, 2020; Poom, Orru,     that in 2017 the Brussels‐Capital Region not only housed
& Ahas, 2017), sports (Collins, Munday, & Roberts, 2012;      10.5% of the Belgian population, but even generated
Pereira, Filimonau, & Ribeiro, 2019), culture (Bottrill,      17.8% of the Belgian gross domestic product. These fig‐
Liverman, & Boykoff, 2010; Collins & Cooper, 2017;            ures are grist to the mill of those who claim that city
Connolly, Dupras, & Séguin, 2016), tourism (e.g., Dube        dwellers, by definition, live more sustainably than sub‐
& Nhamo, 2019; Luo, Becken, & Zhong, 2018; Sharp,             urban or rural dwellers, or as Banister (2008, p. 73) put
Grundius, & Heinonen, 2016; Smith & Rodger, 2009),            it: “The city is the most sustainable urban form.” Indeed,
and all kinds of visits by foreigners to their families and   the official carbon intensity of the Brussels economy is
friends (Sun & Pratt, 2014). Within the academic sector,      around 5.5 times smaller than that of Belgium as a whole.
Erasmus programmes financially support European stu‐          However, just as Belgium is externalizing an important
dents to study away from home, while compensation             part of the emissions for which the Belgian economy
increases with travel distance. Researchers are encour‐       is responsible to low‐wage countries and to all sorts of

Urban Planning, 2021, Volume 6, Issue 2, Pages 285–298                                                                 286
foreign travel destinations, Brussels is externalizing an 3. Method
even larger part of its emissions to its hinterland, being
an important consumer of food and industrial products, Various bottom‐up methods have been developed to
almost none of which are produced on its own territory. assess the importance of the climate footprint of tourist
Also, no airports (Boussauw & Vanoutrive, 2019) or sea‐ trips to specific destinations, which usually and deliber‐
ports are located within the modest area of the territory ately do not include outward trips made by residents
of Brussels, which means that even the climate inten‐ of the city or region in question (e.g., Dwyer, Forsyth,
sity of travel by Brussels’ residents, which may be well Spurr, & Hoque, 2010; Peeters & Schouten, 2006; Rico
higher than the Belgian average (Czepkiewicz, Heinonen, et al., 2019). Other studies focus specifically on estimat‐
& Ottelin, 2018), is invisible in any relevant databases. ing the climate footprint of the residents of a certain area,
Mapping the actual climate footprint of the Brussels‐ such as Eijgelaar, Peeters, de Bruijn, and Dirven (2017) or
Capital Region is beyond the scope of this article. Instead, Larsson et al. (2018). In what follows we will stick to the
we aim to understand the geography of the climate foot‐ first of both approaches. The studies referred to above
print of inbound international travel, and identify any combine data on the number and origin of international
knowledge gaps that may prevent us from doing so in overnight visitors (or ‘tourists’ according to definition of
a comprehensive and reproducible manner. This con‐ the World Tourism Organization (2010)) with modal split
cerns all international journeys with Brussels as a desti‐ figures that vary according to their origin, trip lengths,
nation, regardless of the purpose of the trip (business, and standardized emission rates per passenger kilome‐
politics, science, education, tourism). In this way, we tre. In this article, we will use the terms ‘overnight visi‐
subscribe to an existing tradition of research into sus‐ tor’ and ‘tourist’ as synonyms. When making a distinction
tainable tourism (Gössling et al., 2005; Le & Nguyen, between overnight visitors or tourists who are on holiday
2021; Sun, 2014), although we expand leisure with busi‐ or on business trip, we will use the concepts of ‘leisure’
ness travel. In that context, Peeters and Schouten (2006), versus ‘business.’ The time frame of our study is the year
for example, already investigated the ecological foot‐ 2018 and the unit of analysis is one round trip of inbound
print of tourism to and in Amsterdam. A similar assess‐ travel of one international passenger.
ment was recently carried out for Barcelona (Rico et al.,
2019). In both cases, the results show that the over‐ 3.1. Number and Origin of Overnight Visitors
whelming majority of the climate footprint of tourist vis‐
its are attributable to travel to the destination, in partic‐ With respect to the number and the origins of overnight
ular to long‐distance air travel. These studies take into visitors, the quality of available data sets considerably
account the climate footprint related to touristic activi‐ varies between countries and even between cities. Two
ties in the destination (accommodation, leisure and pro‐ key determinants are, first, the way in which the geo‐
fessional activities, intra‐urban transport). However, they graphical basis of data collection is demarcated, and sec‐
measure the climate footprint of transport to the des‐ ond, the tourist counting method that was applied. In the
tination just roughly, distinguishing between large cate‐ case of the Brussels‐Capital Region, the statistical basis
gories (e.g., short, medium, long haul travel; or classify‐ includes all officially registered tourist accommodation.
ing trip origins merely by continent). In our case, we have This comprises around 180 hotel and hotel‐like branches
sought to measure the climate footprint of travel from with a total capacity of 35,000 beds, 9 hostels offering
each country of origin. Such an approach, which consid‐ around 1,400 beds, and around 100 other accommoda‐
ers at the same time the territory where the tourist activ‐ tions such as bed and breakfast and tourist residences
ities take place (here Brussels) and the territories where additionally offering about 500 beds. However, this statis‐
the tourists come from is still quite rare in the research tical basis covers only part of the actual offer of commer‐
field of climate footprint of tourism (see Becken, 2002, cial accommodation. According to Wayens et al. (2020),
for international passenger air travel to New Zealand; covering the year 2017, nearly 34,000 beds available on
Dawson, Stewart Lemelin, & Scott, 2010, for polar bear the Airbnb and Home Away platforms would be off the
viewing tourism in Churchill, Canada; El Hanandeh, 2013, radar. Not taking into account this vast set of unregis‐
for the pilgrimage to Mecca; Lenzen et al., 2018, for tered accommodation, which is more or less equivalent
tourism‐related global carbon flows between 160 coun‐ to the capacity in registered branches, will lead to under‐
tries; and Sharp et al., 2016, on Iceland). Finally, it is estimating tourist arrivals by around 30%. Furthermore,
important to note that our bottom‐up approach is only it should be borne in mind that these figures are still
one possible option, prompted by our research question exclusive of informal accommodation offered by friends
and the availability of data. By nature, this approach suf‐ and family members, a phenomenon which is probably
fers from many limitations (Lenzen et al., 2018). In order important in Brussels, taking into account the high pro‐
to arrive at a more global picture of the climate footprint portion of foreign residents, particularly those originat‐
of international travel patterns, it might however make ing from wealthy states such as the European Union,
more sense to consider the resident as a statistical unit, North America, and Japan. According to a survey car‐
rather than the visitor, as was argued by Larsson, Kamb, ried out in 2018–19 in the Brussels museums, one
Nässén, and Åkerman (2018). fifth of all international overnight visitors in Brussels
Urban Planning, 2021, Volume 6, Issue 2, Pages 285–298 287were staying with friends or family members (Decroly & and have become popular, in particular among Chinese
Tihon, 2019). tourists (Arlt, 2013; Bui & Trupp, 2014; Xiang, 2013).
Even though statistics of tourist accommodation in Independent multi‐destination tours are also common
the Brussels‐Capital Region are incomplete, they provide practice among Japanese, Korean, or Chinese tourists
detailed data on international arrivals in officially regis‐ (Pendzialek, 2016). Although less well documented, this
tered accommodation. In these, for each guest or group phenomenon is probably common as well among individ‐
of guests, staff members are required to collect informa‐ ual overnight visitors from other distant markets, such as
tion about the state of residence, the purpose of the the United States, Canada, or Australia.
stay, the day of departure, and the number of nights But even if tourists from distant markets frequently
spent. The data is then transferred to Statistics Belgium, visit Europe in the form of a tour, which mainly involves
which procures detailed tables of the number of arrivals surface transport, the initial trip to Europe was mostly
and overnight stays by purpose, for each country of res‐ a flight. The Art Cities Research (Toerisme Vlaanderen,
idence. Residence is an important variable here, since 2018) summary tables confirm that about 100% of these
it corresponds more frequently to the actual place of incoming trips consist of air travel. This illustrates how
departure of the trip, compared to nationality (a variable difficult it is to determine the footprint of travel, which
that is more commonly collected than residence). becomes even more problematic in attempts to allocate
corresponding climate footprints to territorial units (such
3.2. Travel Modal Split According to Country of Origin as the Brussels‐Capital Region). It is not obvious whether
we need to take into account the mode of transport used
Official statistics on tourist arrivals in Brussels do not to get to Brussels, the one used to reach Europe, or both
contain information on the mode of transport used. at the same time. Ideally, both would be combined, by
Therefore, we complement these statistics with data distributing the emissions linked to transport to Europe
from visitor surveys collected by the Art Cities Research across the various destinations visited, and by calculat‐
project (Toerisme Vlaanderen, 2018). This survey was ing the specific emissions that are associated with intra‐
conducted between April 2017 and April 2018 among European travel to Brussels. However, given the lack of
1,400 people staying in Brussels for leisure purposes and data on intra‐European tours by leisure tourists from
includes travel mode choices by tourists from the nine distant markets, we cannot implement such a strategy.
most important sending countries that visited Brussels. Instead, in line with the Art Cities Research summary
At first glance, a surprising share, larger than or equal tables, we assumed that all incoming travel of leisure
to 60%, of incoming trips by leisure tourists from Russia, overnight visitors in the Brussels‐Capital Region that orig‐
China, Japan, and the United States seems to be over inate from a remote location at 2,000 km or more were
land travel (car and coach statistics cover ferry trips done by air.
from the UK; Figure 1). This result is indicative of the In the current article, we use the Art Cities Research
way in which many international tourist trips material‐ data to estimate the distribution of international arrivals
ize. A majority of intercontinental overnight visitors take in Brussels by travel mode, according to the overnight vis‐
advantage of the opportunity to visit multiple destina‐ itors’ origins. Although the data relate only to a limited
tions, e.g., using the format of the low‐cost coach tours number of origins, only cover leisure trips, and do not
that are offered by many non‐European tour operators resolve the complicated question of multi‐destination
100
90
80
70 Coach
60
Car
50
40 Train
30 Air
20
10
0
Figure 1. Modal split of tourist arrivals (leisure purpose only) in Brussels by origin country, according to the Art Cities
Research survey (2017–2018). Source: Toerisme Vlaanderen (2018).
Urban Planning, 2021, Volume 6, Issue 2, Pages 285–298 288tours in which tourists from distant markets take part, this choice causes an upward bias in the results, which
they offer the advantage that they represent real trips could not be corrected for because of lack of data on
instead of modelled ones, as was done by Gunter and multi‐destination tours. This is one of the reasons why
Wöber (2019), among other studies. we want to underline the exploratory nature of our study,
However, Fiorello, Martino, Zani, Christidis, and and urge the reader to put the results obtained from our
Navajas‐Cawood (2016) show that for equal trip lengths calculations in perspective. Also, it is important to bear
modal split differs, depending on travel purpose. in mind that the outlined method was only applied to
Statistics on international arrivals in Brussels distinguish estimate the modal split of tourist arrivals in Brussels
between leisure and business trips, which urges us to cor‐ in 2018.
rect the modal split of business trips, a category of travel
that is not included in the Art Cities Research survey. 3.3. Estimating Distance between Origins and
Therefore, we apply data from the annual outbound trip Destinations
survey conducted in Norway (Statistics Norway, 2019),
which provides a breakdown of international trips made Distance calculation between countries and the centre
by residents into travel purpose and travel mode. Mode of Brussels was based on centroid locations that were
choice of business travellers from Norway is not neces‐ weighted by the geographical distribution of popula‐
sarily representative, partly because air travel is more tion, as computed by the Center for International Earth
common in Norway than in the rest of Europe and most Science Information Network of Columbia University.
of the world. That is why we only consider this data as Nevertheless, the distances obtained are still imperfect
indicative with respect to the use of cars and coaches. approximations of actual distances travelled when arriv‐
Results show that business overnight visitors do not use ing in Brussels. It not only treats all flights originating
coaches, and that they have a much lower propensity from a single country in the same manner, regardless
to use cars and a higher propensity to use airplanes of the (unknown) origin city or region (for example, no
and trains compared to leisure tourists. On this basis, distinction is made between New York and Los Angeles
we assume that in the case of international business in the United States), it is also based on the assumption
arrivals, the modal share of coaches would be system‐ that air travel is always choosing the shortest path (great‐
atically zero, that the share of car travel would be five circle distance). Dobruszkes and Peeters (2019) show
times lower compared to leisure arrivals, and that the that the majority of commercial flights actually take
remaining trips would be shared between airplanes and longer routes, which on average adds 7.5% of distance.
trains in line with the distribution that was observed for Therefore, we have corrected all ‘shortest distances’
leisure travel. In the case of Brussels‐bound trips from between origins and destinations by means of the dis‐
France, for example, this leads to an increase in the share tance class‐based coefficients as provided by Dobruszkes
of plane travel from 10% to 20%, while train travel goes and Peeters (2019).
up from 35% to 70%, car travel is reduced from 50% to
10% and coach travel from 4% to 0%. 3.4. Climate Footprint per Passenger by Travel Mode
The modal split of arrivals from countries that were
not included in the Art Cities Research survey was recon‐ We distinguished between modes of transport with
structed as follows. In cases where the trip length was respect to emission rates per passenger kilometre trav‐
less than 1,500 km, we applied the modal split as elled. We started from the figures provided by Peeters,
observed in a country or (sub‐national) region located Szimba, and Duijnisveld (2007), a well‐cited source that
at a comparable distance or in a similar spatial con‐ nonetheless needed a slight update with respect to air
text. As an example, survey figures for Italy were equally and car travel data that date back to 2004. Indeed, both
applied to tourists from Croatia, figures for Piemonte to modes mentioned have faced fleet renewal which has
Austria, and for Ireland to Northern Ireland. For origins led to lower emissions per passenger kilometre dur‐
located at a distance between 1,500 and 2,000 km, we ing operations. In the case of air transport, we have
applied correction factors derived from a 2014 survey updated the rates ourselves, based on real air services
of tourists in the Netherlands which was carried out by at Brussels Airport (see Table 1 for more detailed expla‐
NBTC Holland Marketing (2015). The NBTC survey is rare nation). Depending on the distance, the obtained rates
in its kind, since it collects modal split data with respect are 15 to 30% lower than those calculated back in 2004.
to countries or country sets of origin. Correction factors With respect to car transport, we used the results of
were applied for business trips up to 2,000 km. For longer a recent study in Denmark (Christensen, 2016), which
trips, we opted for a maximalist solution, assuming that shows that emissions per passenger kilometre were 25%
all trips were made by airplane. lower in 2015 compared to 2004. Updating was not nec‐
Although one of the most accurate, feasible approx‐ essary, however, for emissions from trains and buses,
imations, it is still important to realize that the outlined as the current figures are very close to those measured
method attributes the entirety of emissions associated in 2004 (see, e.g., Prussi & Lonza, 2018, for trains; and
with travel to Europe to the Brussels‐Capital Region as a DEFRA, 2020, for coaches). For overland motor vehicles,
single destination. It is important to keep in mind that only CO2 emissions were calculated, given the limited
Urban Planning, 2021, Volume 6, Issue 2, Pages 285–298 289Table 1. Scope, indicators, and data sources.
Dimension Indicators Data sources
Number of International tourist arrivals (for Statistics Belgium (2019)
international at least one night) in registered
tourists collective accommodation
establishments
Arrivals by purpose of the trip
(leisure versus business) and
country of residence of the
guest
Travel mode Travel modal split according to For leisure purposes: Art Cities Research (Tourisme Vlaanderen,
country of origin 2018), a survey conducted between April 2017 and April 2018
among 1,400 people staying in Brussels for the purpose of leisure.
For business purposes: adaptation of Art Cities Research results
taking into account the annual Travel Survey conducted by
Statistics Norway (2019; trips by mode of transport, type of trip
and contents).
Distance Distance between the centre of Own calculations based on gridded population datasets (Popgrid
between Brussels and centroid of each Data Collaborative, 2019) provided by the Center for International
origin and country of origin weighted by Earth Science Information Network (2019). For air travel, distance
destination the spatial distribution of the between origin and destination was multiplied by a coefficient to
population take into account the existence of detours (i.e., longer itineraries
than the great‐circle distance). We used the coefficients computed
by Dobruszkes and Peeters (2019): 1.143 for distance less than
1000 km, 1.073 for 1000–4000 km, and 1.048 for more than 4000
km.
Climate Climate footprint per passenger For airplanes: own calculations based on CO2 emissions for all the
footprint kilometre, class of distance, and flights to/from Brussels airport in 2018. The data on the provision
travel mode of regular air services in Brussels Airport have been extracted from
the 2018 OAG Schedules Analyser (OAG, 2018). For each flight,
CO2 emissions were calculated by using Eurocontrol Small Emitters
Tools (Eurocontrol, 2019). Based on the World airline rankings
2018 (Flightglobal, 2019), a seat occupancy rate of 80% has been
used to estimate the number of passengers for each flight. The
calculated emission factors by classes of distance (expressed in kg
CO2 pkm) are: 0.144 for distances less than 500 km, 0.108 for
500—1000 km, 0.090 for 1000—1500 km, 0.084 for 1500–2000 km,
and 0.093 for more than 2000 km. In a second stage, according to
the literature (DEFRA, 2020), the emission factors were multiplied
by 1.9 to convert CO2 emissions into CO2 eq (‘climate footprint’).
contribution of other emissions to the climate footprint. with a 100‐year time horizon (Global Warming Potential
Given the importance of the radiative forcing (RF) effect, or GWP100). In a recent paper, Lee et al. (2020) have
however, it would be unacceptable to maintain this sim‐ updated their estimates, based on new models of the
plification with regard to aviation. So, in order to esti‐ RF effect of contrail cirrus. When using the same met‐
mate the total climate footprint of air travel, effects ric (GWP100), the conversion factor obtained is slightly
caused by non‐CO2 forcing agents (nitrogen oxides [NOx ], lower (1.7 as opposed to 1.9). However, when using
water vapour, soot and sulfate aerosols, contrail cirrus) another metric that is assumed to better reflect warm‐
were accounted for by applying a multiplier of 1.9 to ing potential under the current growth conditions of air
the amount of CO2 emissions, a conversion factor that travel, the conversion factor rose to 3.0. On this basis,
was derived from Lee et al. (2010) and is recommended it is concluded “that aviation emissions are currently
by DEFRA (2020). This conversion factor is defined as warming the climate around three times faster than that
the ratio between total CO2 ‐warming‐equivalent emis‐ associated with aviation CO2 emissions alone” (Lee et al.,
sions from all forcing agents and those from CO2 alone, 2020, p. 8). Therefore, the climate footprint of aviation
Urban Planning, 2021, Volume 6, Issue 2, Pages 285–298 290as an outcome of our analysis likely underestimates the that are well‐established as destinations for tourists from
impact of non‐CO2 agents. However, given the persis‐ distant markets, both as city‐trip destination and as part
tent uncertainties about these impacts, it seems more of intra‐European tours, be it individually visited or as
cautious to use a conversion factor that has been rec‐ part of a group (Rome, 9.6 million arrivals; Barcelona,
ommended for several years, than one that was only 7.4 million; Amsterdam, 6.9 million; Prague, 6.7 million;
recently published. Besides, taking RF into account is the Vienna, 6.3 million; Madrid, 5.2 million; Berlin, 4.9 mil‐
reason behind the deliberate use of the term ‘climate lion; Lisbon, 4.3 million; Venice, 4.3 million; Budapest,
footprint’ in this article instead of the more common 3.8 million). Even Munich and Copenhagen, which are
‘carbon footprint.’ Table 1 provides more detail about the less well‐known as international tourist attractions, wel‐
sources used and the calculation methods employed. come more international overnight visitors than Brussels.
In order to estimate the entirety of CO2 emissions The situation does not change if we account for the size
linked to international tourist arrivals, we have per‐ of the city. Indeed, also the number of international
formed the calculation for each of the 247 countries from arrivals per inhabitant is lower in Brussels than in all cities
which overnight visitors arrive in Brussels. First, the num‐ listed above, except for Budapest.
ber of arrivals was disaggregated by purpose and by travel As shown in Figure 2 and Table 2, the vast major‐
mode, and for air travel additionally by distance class. ity of international tourists staying in Brussels arrive
Then, results obtained per travel purpose and mode were from a limited number of states: 70% of arrivals orig‐
added up and multiplied by two in order to account for inate from just 12 origins. European states (70.5% of
both the inward and the outward trip, as we want to allo‐ arrivals), especially neighbouring countries (41%), are
cate emissions of the entire journey to Brussels. the main source of overnight visitors, whether for leisure
or business purposes. Among the most distant origins,
4. Results the United States (217,000 arrivals, 7.7% of the total),
China (88,000, 3.1%) and to a lesser extent Japan (48,000,
4.1. Amount and Geography of International Arrivals 1.7%), Brazil (41,000, 1.4%), and Russia (38,000, 1.3%)
stand out clearly. The map also highlights the significant
In 2018, the Brussels‐Capital Region registered around volume of arrivals from Canada (32,000), India (27,000),
2.9 million international arrivals in registered tourist and Australia (25,000).
accommodation. As such, Brussels represents an impor‐ Given the important presence of international polit‐
tant, although not a major, urban destination in Europe. ical bodies and the rather limited attractiveness of
Its attractiveness remains modest not only compared Brussels as a leisure destination, for decades the num‐
to Paris (13.2 million international arrivals) and London ber of arrivals with a leisure purpose has been signifi‐
(13.0 million), the two main poles of urban leisure and cantly lower than the number of business trips. Since
business travel in Europe, but also compared to cities the early 2000s, the ratio between both kinds of travel
Figure 2. Number of international arrivals in the Brussels‐Capital Region by country of residence and by purpose (2018).
Source: Statistics Belgium (2019).
Urban Planning, 2021, Volume 6, Issue 2, Pages 285–298 291Table 2. International tourist arrivals and associated climate footprint in the Brussels‐Capital Region (in 2018) by distance
class.
Climate footprints
International tourist arrivals For all travel modes By travel mode (% of total GHG emission)
per Total By tourist
Distance class number 100,000 (kton arrival
(km) (× 1,000) % inh. CO2 eq) (kg CO2 eq) Airplane Train Car Coach Total
< 1,000 1,330 47.3 486 108 81 2.4 0.6 0.9 0.0 4.0
1,000—1,999 639 22.7 179 242 378 8.1 0.3 0.5 0.1 8.9
2,000—2,999 71 2.5 52 61 868 2.3 2.3
3,000—3,999 67 2.4 20 85 1,265 3.1 3.1
4,000—4,999 32 1.1 5 54 1,677 2.0 2.0
5,000—5,999 30 1.1 6 59 1,975 2.2 .2
6,000—6,999 40 1.4 12 95 2,372 3.5 3.5
7,000—7,999 251 8.9 13 680 2,707 25.2 25.2
8,000—8,999 155 5.5 8 503 3,246 18.6 18.6
9,000—9,999 119 4.2 21 419 3,523 15.5 15.5
> 10,000 81 2.9 14 396 4,911 14.7 14.7
Total 2,814 100.0 37 2,701 960 97.6 0.9 1.4 0.1 100.0
Sources: Christensen (2016); Peeters et al. (2007); Statistics Belgium (2019); Toerisme Vlaanderen (2018); World Development Indicators
database (World Bank, 2019); and own calculations based on Eurocontrol Small Emitters Tool (Eurocontrol, 2019) and OAG (2018) data.
has gradually become more balanced. Currently, over‐ the larger population in more remote distance classes, as
all shares are more or less equal, although the rela‐ shown by the number of arrivals in Brussels per 100,000
tive importance between both purposes still depends on inhabitants in the origin classes (Table 2). Indeed, if the
the origin (Figure 2). Looking at origin countries, busi‐ relative volume of flows to Brussels decreases steadily up
ness overnight visitors are generally overrepresented in to 5,000 km, it increases between 5,000 and 8,000 km,
Europe (except for Spain), the United States, the Arab‐ then again between 9,000 and 10,000 km. These varia‐
Persian Gulf countries, and Southeast Asia including tions result in part from differences in per capita income
Japan, while the reverse is true for arrivals from Latin on number of tourists sent. It is clear that those interme‐
America, Russia, India, China, Australia, and New Zealand. diate distance classes, which represent lower numbers of
In line with related research (e.g., Le & Nguyen, 2021; arrivals per 100,000 inhabitants, are generally character‐
Wu, Liao, & Liu, 2019), we hypothesize that the geogra‐ ized by a fairly modest per capita GDP (see for example
phy of the origin of the flows of international tourists the classes of 4,000 to 6,000 km).
staying in Brussels results from the combined effects of
distance, the economic and population‐based potential 4.2. Volume and Geography of Climate Footprints
for sending travellers in the origin countries, and local
preferences in terms of destination choice behaviour. According to our calculations, international tourist
In an attempt to disentangle the influence of these differ‐ arrivals in the Brussels‐Capital Region generated a total
ent factors, we have broken down international arrivals of 1,452 kilotonnes of CO2 (or 1.45 Mton CO2 ) in 2018,
by distance class (Table 2). The results show that the vol‐ taking into account both inward and outward trips.
ume of flows decreases rapidly with distance: Nearly half After applying the 1.9 multiplicator to air trips, the cli‐
of the arrivals come from within a radius below 1,000 km mate footprint of all international travel to Brussels
from Brussels, a fifth from a radius between 1,000 and that is included in our analysis, in 2018, amounts
2,000 km, while barely 2.5% originates from countries to around 2,701 kilotonnes of CO2 equivalent (i.e.,
located at a distance between 2,000 and 3,000 km. 2.70 Mton CO2 eq), which equals about 73% of the
Beyond 2,000 km, the relationship between distance and entire climate footprint (all activities combined, includ‐
number of trips is altered by variations in population size ing the residential sector and internal transport, but obvi‐
and per capita income between distance classes. The two ously excluding international travel) that were officially
distance classes between 7,000 and 9,000 km each pro‐ reported by the Brussels‐Capital Region in 2018.
duce more international overnight visitors to Brussels Examination of the distribution of the tourism‐
than those between 2,000 and 7,000 km, because they induced climate footprint reveals a geography that is rad‐
respectively include India and the United States (7,000 ically different from the geography of tourist arrivals. In
to 8,000 km) and China and Brazil (8,000 to 9,000 km). fact, while the number of flows sharply decreases with
The expected negative relationship between distance distance, the amount of emissions increases with dis‐
and number of arrivals is only partly compensated for by tance (Table 3). Thus, while visitor flows from Europe
Urban Planning, 2021, Volume 6, Issue 2, Pages 285–298 292Table 3. Geographic origin of international tourist arrivals in the Brussels‐Capital Region and climate footprint of these
arrivals (2018).
Distribution by purpose and
region of origin of international Distribution by origin of the climate footprint of
Origin tourist arrivals in Brussels‐ international travel towards Brussels‐Capital
(country of residence) Capital Region (in 2018) (%) Region (in 2018) (% of total climate footprint)
All journeys
Leisure Business Total Airplane Train Car Coach Total
Neighbouring countries (Europe) 20.1 20.9 41.0 2.1 0.4 0.9 0.0 3.4
Southern Europe 7.5 6.3 13.9 5.1 0.2 0.3 0.0 5.6
Central Europe 2.0 2.7 4.7 0.6 0.1 0.1 0.0 0.8
Northern Europe 1.9 3.4 5.3 1.9 0.0 0.2 0.0 2.2
Eastern Europe 2.3 3.3 5.6 3.2 0.0 0.2 0.0 3.3
Russian realm and Central Asia 1.1 0.9 2.1 2.5 2.5
Indian realm 0.6 0.5 1.1 3.0 3.0
China 2.1 1.4 3.5 11.5 11.5
East Asia and Oceania 2.1 1.5 3.6 15.7 15.7
Southeast Asia 0.8 0.8 1.6 6.0 6.0
Arab‐Muslim realm 1.8 2.0 3.8 5.1 5.1
Sub‐Saharan Africa 0.5 0.6 1.1 2.6 2.6
North America 4.0 4.8 8.8 24.1 24.1
Latin America and the Caribbean 2.7 1.2 3.9 14.2 14.2
Europe 33.9 36.6 70.5 12.8 0.8 1.6 0.1 15.3
Rest of the world 15.8 13.7 29.5 84.7 0.0 0.0 0.0 84.7
Grand total 49.7 50.3 100.0 97.5 0.8 1.6 0.1 100.0
Sources: Peeters et al. (2007); Statistics Belgium (2019); Toerisme Vlaanderen (2018); and own calculations.
account for 70.5% of arrivals, they generate barely 15% needs to be allocated to the destination territory. Then,
of emissions, while flows from outside Europe, which we were unable to cover international overnight visi‐
represent less than 30% of tourists, generate nearly 85% tors who stayed in unregistered accommodation, which
of the climate footprint. means that our analysis significantly underestimates the
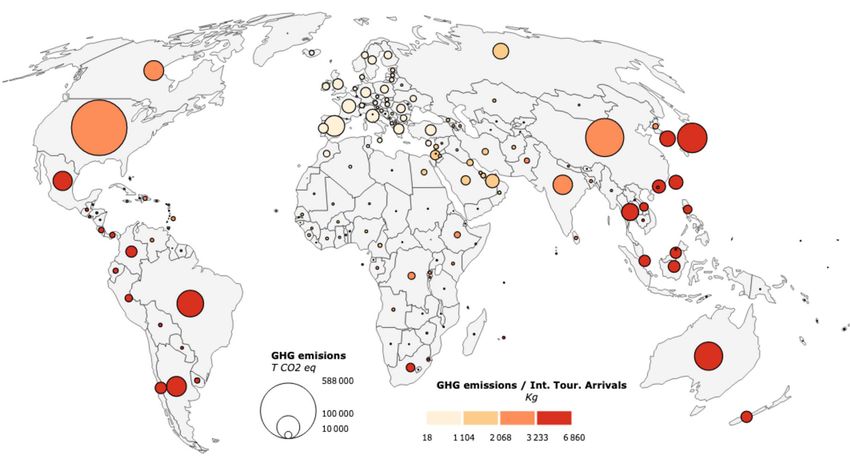
This striking result can be explained by the spe‐ total number of tourists to Brussels. Furthermore, we
cific relation between air transport and climate foot‐ were not able to redistribute the climate footprint of
print, which is brought forward by Figure 3, a map that tourists arriving in Brussels among the often multiple
links emissions by origin country to journeys to Brussels. destinations they visit within Europe, which implies that
The very significant climate footprint of flows from the we overestimated the climate footprint of long‐distance
United States (21% of footprint for 7.6% of flows) and overnight visitors. We are also aware that the climate
China (10% versus 3%) stand out, but so do Japan (6% footprint resulting from our calculations covers only
versus 1.7%) and Australia (5.5% versus 0.9%). Also, one one, albeit an important, aspect of Brussels’s interna‐
European state is present among the top ten countries tional position. Embedded emissions in imported prod‐
in terms of emissions—Spain—which is the only origin ucts were not included, nor was the share of the Brussels
country that combines a very large number of tourists to economy in the climate footprint of international sea
Brussels with an important share of air travel. shipping. A last caution that needs to be mentioned is
the significant degree of uncertainty associated with the
5. Conclusions multiplicator (defined as 1.9) that was applied to convert
air transport related CO2 emissions into overall climate
Territorializing the international share of Brussels’s cli‐ footprint. Therefore, an important initial conclusion of
mate footprint is not an easy task. In the above analy‐ our study is that resources should be made available
sis, numerous methodological choices had to be made, to collect better data. An extensive sample of detailed
and furthermore, the scarce availability of data imposes questionnaires about travel itineraries could be obtained
important limitations. In our calculation, we chose from arriving tourists, especially at airports, but also in a
to only include the climate footprint of tourists with variety of other venues, which would lead to more accu‐
Brussels as a destination, assuming that the climate rate insights. Such information could be supplemented
footprint of journeys undertaken by Brussels’s residents with big data, in particular from mobile telephony that
Urban Planning, 2021, Volume 6, Issue 2, Pages 285–298 293Figure 3. Climate footprint of international travel towards Brussels‐Capital Region (in 2018) by country of origin: Absolute
amount and amount per international tourist arrival. Sources: Christensen (2016); Peeters et al. (2007); Statistics Belgium
(2019); Toerisme Vlaanderen (2018); and own calculations based on Eurocontrol Small Emitters Tool (Eurocontrol, 2019)
and OAG (2018) data.
allows to reconstruct travel (see, e.g., Ahas, Aasa, Mark, Brussels will be more than twice as high as the official cli‐
Pae, & Kull, 2007; Saluveer et al., 2020). mate footprint of Brussels, a ratio that will be even higher
Despite all reservations that need to be taken into in case the emission reduction targets in the other sectors
account, and the exploratory nature of our calculations, will be achieved. The problematic nature of this finding is
we can still report a number of interesting findings on to be nuanced only to a limited extent by the observa‐
the geography and magnitude of the climate footprint tion that the climate footprint of international journeys
of international travel to Brussels. In terms of geograph‐ to Brussels is smaller, both counted per trip and in total,
ical distribution, over 70% of international travellers to than that of comparable cities such as Munich, Budapest,
Brussels come from Europe, while these represent only or Zurich (Gunter & Wöber, 2019).
15% of the climate footprint of all international travel The typical position of Brussels as a centre of politi‐
to Brussels. It is clear that distance matters. The climate cal decision‐making urges to reflect on the finding that
footprint of a journey from a non‐European country is not some locations may be better positioned than others to
only greater in absolute terms, due to the larger distance, host such functions. Our analysis shows that Brussels is in
but also in relative terms (expressed in CO2 eq/km) due fact doing remarkably well, since the climate footprint of
to the more favourable modal split for intra‐European intra‐European travel to Brussels is rather low, while the
journeys. Besides, we note that Brussels is very conve‐ overall climate footprint of inbound long‐distance travel
niently located within Europe, centrally between the two is considerably lower in comparison to other cities with
main European travel destinations–London and Paris— a strong international position. Although Brussels’s cen‐
and with a convenient high‐speed train connection to all tral location helps keeping modest the climate footprint
surrounding major cities. In terms of magnitude, the cal‐ of its incoming business travel, we should not forget that
culated climate footprint of international journeys with the favourable score of Brussels compared to cities such
Brussels as a destination equalled 2.7 Mton CO2 eq in the as Barcelona, Prague, or Amsterdam is largely due to the
year 2018, which is equivalent to about three quarters relatively limited touristic appeal of Brussels compared
of the official total amount of emissions of the Brussels‐ to the cities mentioned.
Capital Region as recorded by the Belgian national cli‐ From a wider perspective, we can conclude that in a
mate inventory (3.7 Mton CO2 eq in 2017). Moreover, rapidly globalizing and at the same time warming world,
emissions from international journeys are increasing at it is no longer tenable to omit territorializing the climate
a rapid pace, with an average growth of more than 4% footprint of international transport, while this is well‐
per year over the past 18 years (up to 2019, before the established practice for emissions caused by industrial
Covid‐19 crisis). If the current growth rate would persist, activities, agriculture, buildings, and domestic transport.
by 2036 the climate footprint of international travel to Not including these emissions in climate inventories
Urban Planning, 2021, Volume 6, Issue 2, Pages 285–298 294leads to major biases in the climate debate itself. While Arsenault, J., Talbot, J., Boustani, L., Gonzàles, R., &
climate movements argue for the adaptation of Global Manaugh, K. (2019). The environmental footprint of
Northern consumption patterns and production pro‐ academic and student mobility in a large research‐
cesses, a less visible threat seems to be situated in the oriented university. Environmental Research Letters,
increasingly globalized and networked nature of soci‐ 14(9), 095001.
ety. Dependence on long‐distance travel not only makes Banister, D. (2008). The sustainable mobility paradigm.
the economy more carbon intensive, but also education, Transport Policy, 15(2), 73–80.
research, culture, and leisure activities, and even fam‐ Becken, S. (2002). Analysing international tourist flows to
ily visits rely ever more on the consumption of tremen‐ estimate energy use associated with air travel. Jour‐
dous amounts of kerosene. Long‐distance travel patterns nal of sustainable tourism, 10(2), 114–131.
seem to be increasingly anchored in society, and ever Bottrill, C., Liverman, D., & Boykoff, M. (2010). Car‐
less reversible. And even as for medium‐distance jour‐ bon soundings: Greenhouse gas emissions of the UK
neys in Europe, less carbon‐intensive alternatives such as music industry. Environmental Research Letters, 5(1),
trains and coaches are available, an absolute reduction in 014019.
the number of aircraft kilometres travelled is a particu‐ Boussauw, K., & Vanoutrive, T. (2019). Flying green from
larly unattractive idea for many citizens, businesses, and a carbon neutral airport: The case of Brussels. Sus‐
organizations, for which broad societal support is virtu‐ tainability, 11(7), 1–19.
ally non‐existent. Nevertheless, it is clear that a carbon Brussels‐Capital Region. (2019). Plan énergie climat
neutral future is one where jet aircraft will no longer play 2030: The right energy for your region. Brussels:
a substantial role. Brussels‐Capital Region.
Bruxelles Environnement. (2019, April 18). Les émissions
Acknowledgments de gaz à effet de serre en Région de Bruxelles
Capitale [Greenhouse gas emissions in the Brussels‐
The authors would like to thank Taïs Grippa (ULB‐IGEAT) Capital region]. Bruxelles Environnement. Retrieved
for doing part of the preparatory calculations, Visit from https://environnement.brussels/thematiques/
Brussels for the valuable data they provided, Frédéric air‐climat/climat/les‐emissions‐de‐gaz‐effet‐de‐
Dobruszkes (ULB‐IGEAT) for his valuable suggestions, and serre‐en‐region‐de‐bruxelles‐capitale
the reviewers and editors of the thematic issue for their Bui, H. T., & Trupp, A. (2014). The development and
thoughtful comments that led to a substantial improve‐ diversity of Asian tourism in Europe: The case of
ment of the article. All remaining errors are sole respon‐ Vienna. International Journal of Tourism Sciences,
sibility of the authors. This research received no external 14(2), 1–17.
funding. Burtscher, L., Barret, D., Borkar, A. P., Grinberg, V.,
Jahnke, K., Kendrew, S., . . . McCaughrean, M. J.
Conflict of Interests (2020). The carbon footprint of large astronomy
meetings. Nature Astronomy, 4(9), 823–825.
The authors declare no conflict of interests. Center for International Earth Science Information Net‐
work. (2019). Homepage. Center for International
Supplementary Material Earth Science Information Network. Retrieved from
http://www.ciesin.org
Supplementary material for this article is available online Christensen, L. (2016). Environmental impact of long‐
in the format provided by the authors (unedited). distance travel. Transportation Research Procedia,
14, 850–859.
References Ciers, J., Mandic, A., Toth, L. D., & Op’t Veld, G. (2019).
Carbon footprint of academic air travel: A case study
Achten, W. M., Almeida, J., & Muys, B. (2013). Carbon in Switzerland. Sustainability, 11(1), 80.
footprint of science: More than flying. Ecological Indi‐ Collins, A., & Cooper, C. (2017). Measuring and manag‐
cators, 34, 352–355. ing the environmental impact of festivals: The contri‐
Afionis, S., Sakai, M., Scott, K., Barrett, J., & Gouldson, bution of the ecological footprint. Journal of Sustain‐
A. (2017). Consumption‐based carbon accounting: able Tourism, 25(1), 148–162.
Does it have a future? Wiley Interdisciplinary Reviews: Collins, A., Munday, M., & Roberts, A. (2012). Environ‐
Climate Change, 8(1), e438. mental consequences of tourism consumption at
Ahas, R., Aasa, A., Mark, Ü., Pae, T., & Kull, A. (2007). major events: An analysis of the UK stages of the
Seasonal tourism spaces in Estonia: Case study 2007 Tour de France. Journal of Travel Research,
with mobile positioning data. Tourism Management, 51(5), 577–590.
28(3), 989–910. Connolly, M., Dupras, J., & Séguin, C. (2016). An eco‐
Arlt, W. G. (2013). The second wave of Chinese out‐ nomic perspective on rock concerts and climate
bound tourism. Tourism Planning & Development, change: Should carbon offsets compensating emis‐
10(2), 126–133. sions be included in the ticket price? Journal of Cul‐
Urban Planning, 2021, Volume 6, Issue 2, Pages 285–298 295tural Economics, 40(1), 101–126. ment. (2019). Belgium’s greenhouse gas inven‐
Czepkiewicz, M., Heinonen, J., & Ottelin, J. (2018). Why tory (1990–2017): National inventory report submit‐
do urbanites travel more than do others? A review of ted under the United Nations Framework Conven‐
associations between urban form and long‐distance tion on Climate Change. Bonn: UNFCCC. Retrieved
leisure travel. Environmental Research Letters, 13(7), from https://unfccc.int/sites/default/files/resource/
073001. bel‐2019‐nir‐15apr19.zip
Davies, J. C., & Dunk, R. M. (2015). Flying along the sup‐ Gössling, S. (2013). National emissions from tourism:
ply chain: Accounting for emissions from student air An overlooked policy challenge? Energy Policy, 59,
travel in the higher education sector. Carbon Man‐ 433–442.
agement, 6(5/6), 233–246. Gössling, S., Peeters, P., Ceron, J.‐P., Dubois, G., Patter‐
Davis, S. J., & Caldeira, K. (2010). Consumption‐based son, T., & Richardson, R. B. (2005). The eco‐efficiency
accounting of CO2 emissions. Proceedings of the of tourism. Ecological Economics, 54(4), 417–434.
National Academy of Sciences, 107(12), 5687–5692. Gunter, U., & Wöber, K. (2019). Estimating CO2 emissions
Dawson, J., Stewart, E. J., Lemelin, H., & Scott, D. (2010). of European city tourism by source market, travel
The carbon cost of polar bear viewing tourism in distance, and transportation mode. Paper presented
Churchill, Canada. Journal of Sustainable Tourism, at the 54th TRC Meeting 2019, Palma de Mallorca,
18(3), 319–336. Spain.
Decroly, J.‐M., & Tihon, M. (2019). Enquête sur les visi‐ Kitamura, Y., Karkour, S., Ichisugi, Y., & Itsubo, N. (2020).
teurs des musées bruxellois: Rapport global [Survey Carbon footprint evaluation of the business event
of visitors to museums of Brussels: General report]. sector in Japan. Sustainability, 12(12), 5001.
Brussels: Visit Brussels. Klöwer, M., Hopkins, D., Myles, A., & Higham, J. (2020).
DEFRA. (2020). Greenhouse gas reporting: Conversion An analysis of ways to decarbonize conference travel
factors 2020. London: Department for Business, after COVID‐19. Nature, 2020(583), 356–360.
Energy, and Industrial Strategy. Retrieved from Larsson, J., Elofsson, A., Sterner, T., & Åkerman, J. (2019).
https://www.gov.uk/government/publications/ International and national climate policies for avia‐
greenhouse‐gas‐reporting‐conversion‐factors‐2020 tion: A review. Climate Policy, 19(6), 787–799.
Dobruszkes, F., & Peeters, D. (2019). The magnitude of Larsson, J., Kamb, A., Nässén, J., & Åkerman, J. (2018).
detours faced by commercial flights: A global assess‐ Measuring greenhouse gas emissions from interna‐
ment. Journal of Transport Geography, 79, 102465. tional air travel of a country’s residents methodolog‐
Dobruszkes, F., Ramos‐Pérez, D., & Decroly, J.‐M. (2019). ical development and application for Sweden. Envi‐
Reasons for flying. In A. Graham & F. Dobruszkes ronmental Impact Assessment Review, 72, 137–144.
(Eds.), Air transport: A tourism perspective (pp. Le, T.‐H., & Nguyen, C. P. (2021). The impact of tourism
23–39). Amsterdam: Elsevier. on carbon dioxide emissions: Insights from 95 coun‐
Dube, K., & Nhamo, G. (2019). Climate change and the tries. Applied Economics, 53(2), 235–261.
aviation sector: A focus on the Victoria Falls tourism Lee, D. S., Fahey, D. W., Skowron, A., Allen, M. R.,
route. Environmental Development, 29, 5–15. Burkhardt, U., Chen, Q., . . . Wilcox, L. J. (2020). The
Dwyer, L., Forsyth, P., Spurr, R., & Hoque, S. (2010). Esti‐ contribution of global aviation to anthropogenic cli‐
mating the carbon footprint of Australian tourism. mate forcing for 2000 to 2018. Atmospheric Environ‐
Journal of Sustainable Tourism, 18(3), 355–376. ment, 244, 117834.
Eijgelaar, E., Peeters, P., de Bruijn, K., & Dirven, R. Lee, D. S., Pitari, G., Grewe, V., Gierens, K., Penner, J. E.,
(2017). Travelling large in 2016: The carbon footprint Petzold, A., . . . Sausen, R. (2010). Transport impacts
of Dutch holidaymakers in 2016 and the develop‐ on atmosphere and climate: Aviation. Atmospheric
ment since 2002. Breda: Breda University of Applied Environment, 44(37), 4678–4734.
Sciences. Lenzen, M., Sun, Y.‐Y., Faturay, F., Ting, Y.‐P., Geschke, A.,
El Hanandeh, A. (2013). Quantifying the carbon foot‐ & Malik, A. (2018). The carbon footprint of global
print of religious tourism: The case of Hajj. Journal tourism. Nature Climate Change, 8(6), 522–528.
of Cleaner Production, 52, 53–60. Luo, F., Becken, S., & Zhong, Y. (2018). Changing travel
Eurocontrol. (2019). Eurocontrol small emitters patterns in China and ‘carbon footprint’ implications
tool. Eurocontrol. Retrieved from https://www. for a domestic tourist destination. Tourism Manage‐
eurocontrol.int/tool/small‐emitters‐tool ment, 65, 1–13.
Fiorello, D., Martino, A., Zani, L., Christidis, P., & NBTC Holland Marketing. (2015). 2014 inbound tourism
Navajas‐Cawood, E. (2016). Mobility data across the survey: A closer look at our international visi‐
EU 28 member states: Results from an extensive tors. The Hague: Netherlands Board of Tourism &
CAWI survey. Transportation Research Procedia, 14, Conventions.
1104–1113. Nevins, J. (2014). Academic jet‐setting in a time of cli‐
Flightglobal. (2019). Homepage. Flightglobal. Retrieved mate destabilization: Ecological privilege and profes‐
from https://www.flightglobal.com sional geographic travel. The Professional Geogra‐
FPS Public Health, Food Chain Safety and Environ‐ pher, 66(2), 298–310.
Urban Planning, 2021, Volume 6, Issue 2, Pages 285–298 296You can also read