Testing APSyn against Vector Cosine on Similarity Estimation
←
→
Page content transcription
If your browser does not render page correctly, please read the page content below
PACLIC 30 Proceedings

                                 Testing APSyn against Vector Cosine on
                                          Similarity Estimation
Enrico Santus[1] , Emmanuele Chersoni[2] , Alessandro Lenci[3] , Chu-Ren Huang[1] , Philippe Blache[2]
                       [1] The Hong Kong Polytechnic University, Hong Kong
                                   [2] Aix-Marseille University
                                       [3] University of Pisa
                       {esantus, emmanuelechersoni}@gmail.com
                                alessandro.lenci@unipi.it
                                churen.huang@polyu.edu.hk
                                     blache@lpl-aix.fr

                           Abstract                              butional Semantic Models (DSMs), which represent
                                                                 word meaning by means of high-dimensional vec-
         In Distributional Semantic Models (DSMs),               tors encoding corpus-extracted co-occurrences be-
         Vector Cosine is widely used to estimate sim-
                                                                 tween targets and their linguistic contexts (Turney
         ilarity between word vectors, although this
         measure was noticed to suffer from several              and Pantel, 2010).
         shortcomings. The recent literature has pro-            Traditional DSMs initialize vectors with co-
         posed other methods which attempt to miti-              occurrence frequencies. Statistical measures, such
         gate such biases. In this paper, we intend to in-       as Positive Pointwise Mutual Information (PPMI)
         vestigate APSyn, a measure that computes the            or its variants (Church and Hanks, 1990; Bulli-
         extent of the intersection between the most as-         naria and Levy, 2012; Levy et al., 2015), have been
         sociated contexts of two target words, weight-
                                                                 adopted to normalize these values. Also, these mod-
         ing it by context relevance. We evaluated this
         metric in a similarity estimation task on sev-
                                                                 els have exploited the power of dimensionality re-
         eral popular test sets, and our results show that       duction techniques, such as Singular Value Decom-
         APSyn is in fact highly competitive, even with          position (SVD; Landauer and Dumais, 1997) and
         respect to the results reported in the literature       Random Indexing (Sahlgren, 2005).
         for word embeddings. On top of it, APSyn                These first-generation models are currently referred
         addresses some of the weaknesses of Vector              to as count-based, as distinguished from the context-
         Cosine, performing well also on genuine sim-            predicting ones, which have been recently proposed
         ilarity estimation.
                                                                 in the literature (Bengio et al., 2006; Collobert
                                                                 and Weston, 2008; Turian et al., 2010; Huang
    1   Introduction                                             et al., 2012; Mikolov et al., 2013). More com-
                                                                 monly known as word embeddings, these second-
    Word similarity is one of the most important and
                                                                 generation models learn meaning representations
    most studied problems in Natural Language Pro-
                                                                 through neural network training: the vectors dimen-
    cessing (NLP), as it is fundamental for a wide
                                                                 sions are set to maximize the probability for the con-
    range of tasks, such as Word Sense Disambigua-
                                                                 texts that typically occur with the target word.
    tion (WSD), Information Extraction (IE), Para-
                                                                 Vector Cosine is generally adopted by both types of
    phrase Generation (PG), as well as the automatic
                                                                 models as a similarity measure. However, this met-
    creation of semantic resources. Most of the cur-
                                                                 ric has been found to suffer from several problems
    rent approaches to word similarity estimation rely
                                                                 (Li and Han, 2013; Faruqui et al., 2016), such as
    on some version of the Distributional Hypothesis
                                                                 a bias towards features with higher values and the
    (DH), which claims that words occurring in the
                                                                 inability of considering how many features are ac-
    same contexts tend to have similar meanings (Har-
                                                                 tually shared by the vectors. Finally, Cosine is af-
    ris, 1954; Firth, 1957; Sahlgren, 2008). Such hy-
                                                                 fected by the hubness effect (Dinu et al., 2014; Schn-
    pothesis provides the theoretical ground for Distri-

                       30th Pacific Asia Conference on Language, Information and Computation (PACLIC 30)
                                           Seoul, Republic of Korea, October 28-30, 2016
                                                              229
abel et al., 2015), i.e. the fact that words with high 2 Background
frequency tend to be universal neighbours. Even
2.1 DSMs, Measures of Association and
though other measures have been proposed in the
Dimensionality Reduction
literature (Deza and Deza, 2009), Vector Cosine is
still by far the most popular one (Turney and Pan- Count-based DSMs are built in an unsupervised
tel, 2010). However, in a recent paper of Santus et way. Starting from large preprocessed corpora, a
al. (2016b), the authors have claimed that Vector matrix M(m×n) is built, in which each row is a vec-
Cosine is outperformed by APSyn (Average Preci- tor representing a target word in a vocabulary of size
sion for Synonymy), a metric based on the extent m, and each column is one of the n potential contexts
of the intersection between the most salient con- (Turney and Pantel, 2010; Levy et al., 2015). The
texts of two target words. The measure, tested on vector dimensions are counters recording how many
a window-based DSM, outperformed Vector Cosine times the contexts co-occur with the target words.
on the ESL and on the TOEFL datasets. Since raw frequency is highly skewed, most DSMs
In the present work, we perform a systematic eval- have adopted more sophisticated association mea-
uation of APSyn, testing it on the most popular test sures, such as Positive PMI (PPMI; Church and
sets for similarity estimation - namely WordSim-353 Hanks, 1990; Bullinaria and Levy, 2012; Levy et al.,
(Finkelstein et al., 2001), MEN (Bruni et al., 2014) 2015) and Local Mutual Information (LMI; Evert,
and SimLex-999 (Hill et al., 2015). For comparison, 2005). PPMI compares the observed joint probabil-
Vector Cosine is also calculated on several count- ity of co-occurrence of w and c with their probability
based DSMs. We implement a total of twenty-eight of co-occurrence assuming statistical indipendence.
models with different parameters settings, each of It is defined as:
which differs according to corpus size, context win-
dow width, weighting scheme and SVD application. P P M I(w, c) = max(P M I(w, c), 0) (1)
The new metric is shown to outperform Vector Co-
sine in most settings, except when the latter metric is
applied on a PPMI-SVD reduced matrix (Bullinaria P (w, c) |w, c|D
P M I(w, c) = log = log
and Levy, 2012), against which APSyn still obtains P (w)P (c) |w||c|
competitive performances. The results are also dis- (2)
cussed in relation to the state-of-the-art DSMs, as where w is the target word, c is the given context,
reported in Hill et al. (2015). In such comparison, P(w,c) is the probability of co-occurrence, and D is
the best settings of our models outperform the word the collection of observed word-context pairs.
embeddings in almost all datasets. A pilot study Unlike frequency, PPMI was found to have a bias
was also carried out to investigate whether APSyn towards rare events. LMI could therefore be used
is scalable. Results prove its high performance also to reduce such bias and it consists in multiplying
when calculated on large corpora, such as those used the PPMI of the pair by its co-occurrence frequency.
by Baroni et al. (2014). Since target words may occur in hundreds of thou-
On top of the performance, APSyn seems not to be sands contexts, most of which are not informative,
subject to some of the biases that affect Vector Co- methods for dimensionality reduction have been in-
sine. Finally, considering the debate about the abil- vestigated, such as truncated SVD (Deerwester et
ity of DSMs to calculate genuine similarity as op- al., 1990; Landauer and Dumais, 1997; Turney and
posed to word relatedness (Turney, 2001; Agirre et Pantel, 2010; Levy et al., 2015). SVD has been re-
al., 2009; Hill et al., 2015), we test the ability of the garded as a method for noise reduction and for the
models to quantify genuine semantic similarity. discovery of latent dimensions of meaning, and it
has been shown to improve similarity measurements
when combined with PPMI (Bullinaria and Levy,
2012; Levy et al., 2015). As we will see in the
next section, APSyn applies another type of reduc-
tion, which consists in selecting only the top-ranked
230PACLIC 30 Proceedings
contexts in a relevance sorted context list for each has been recently introduced in Santus et al. (2016a)
word vector. Such reduction complies with the prin- and Santus et al. (2016b), and it was shown to out-
ciple of cognitive economy (i.e. only the most rele- perform the vector cosine on the TOEFL (Landauer
vant contexts are elaborated; see Finton, 2002) and and Dumais, 1997) and on the ESL (Turney, 2001)
with the results of behavioural studies, which sup- test sets. This measure is based on the hypothe-
ported feature saliency (Smith et al., 1974). Since sis that words carrying similar meanings share their
APSyn was defined for linguistic contexts (Santus most relevant contexts in higher proportion com-
et al., 2016b), we did not test it on SVD-reduced pared to less similar words. The authors define AP-
spaces, leaving such test to further studies. Syn as the extent of the weighted intersection be-
tween the top most salient contexts of the target
2.2 Similarity Measures words, weighting it by the average rank of the in-
Vector Cosine, by far the most common distribu- tersected features in the PPMI-sorted contexts lists
tional similarity metric (Turney and Pantel, 2010; of the target words:
Landauer and Dumais, 1997; Jarmasz and Szpakow-
icz, 2004; Mikolov et al., 2013; Levy et al., 2015),
AP Syn(w1 , w2 ) =
looks at the normalized correlation between the di-
mensions of two word vectors, w1 and w2 and re- 1 (4)
turns a score between -1 and 1. It is described by the (rank1 (f ) + rank2 (f ))/2
f N (F1 )∩N (F2 )
following equation:
meaning: for every feature f included in the inter-
n
section between the top N features of w1 and the
i=1 f1 i
× f2i
cos(w1 , w2 ) = n n (3) top of w2 (i.e. N (f1 ) and N (f2 )), add 1 divided by
i=1 f1 i × i=1 f2 i
the average rank of the feature in the PPMI-ranked
where fi x is the i-th dimension in the vector x. features of w1 (i.e. rank1 ) and w2 (i.e. rank2 ). Ac-
Despite its extensive usage, Vector Cosine has been cording to the authors, N is a parameter, generally
recently criticized for its hyper sensibility to fea- ranging between 100 and 1000. Results are shown
tures with high values and for the inability of iden- to be relatively stable when N varies in this range,
tifying the actual feature intersection (Li and Han, while become worst if bigger N are used, as low
2013; Schnabel et al., 2015). Recalling an exam- informative features are also introduced. Santus et
ple by Li and Han (2013), the Vector Cosine for al. (2016a) have also used LMI instead of PPMI as
the toy-vectors a = [1, 2, 0] and b = [0, 1, 0] (i.e. weighting function, but achieving lower results.
0.8944) is unexpectedly higher than the one for a With respect to the limitations mentioned above for
and c = [2, 1, 0] (i.e. 0.8000), and even higher the Vector Cosine, APSyn has some advantages.
than the one for the toy-vectors a and d = [1, 2, 1] First of all, it is by definition able to identify the
(i.e. 0.6325), which instead share a larger feature extent of the intersection. Second, its sensibility to
intersection. Since the Vector Cosine is a distance features with high values can be kept under control
measure, it is also subject to the hubness problem, by tuning the value of N. On top of it, feature values
which was shown by Radovanovic et al. (2010) to (i.e. their weights) do not affect directly the similar-
be an inherent property of data distributions in high- ity score, as they are only used to build the feature
dimensional vector space. The problem consists in rank. With reference to the toy-vectors presented
the fact that vectors with high frequency tend to get above, APSyn would assign in fact completely dif-
high scores with a large number of other vectors, ferent scores. The higher score would be assigned
thus becoming universal nearest neighbours (Dinu to a and d, as they share two relevant features out of
et al., 2014; Schnabel et al., 2015; Faruqui et al., three. The second higher score would be assigned
2016). to a and c, for the same reason as above. The lower
Another measure of word similarity named APSyn 1 score would be instead assigned to a and b, as they
1
Scripts and information can be found at only share one non-salient feature. In section 3.4,
https://github.com/esantus/APSyn we briefly discuss the hubness problem.
2312.3 Datasets cludes 3,000 word pairs divided in two sets (one
for training and one for testing) together with hu-
For our evaluation, we used three widely popular man judgments, obtained through Amazon Mechan-
datasets: WordSim-353 (Finkelstein et al., 2001), ical Turk. The construction was performed by ask-
MEN (Bruni et al., 2014), SimLex-999 (Hill et al., ing subjects to rate which pair - among two of them -
2015). These datasets have a different history, but was the more related one (i.e. the most associated).
all of them consist in word pairs with an associ- Every pairs-couple was proposed only once, and a
ated score, that should either represent word asso- final score out of 50 was attributed to each pair, ac-
ciation or word similarity. WordSim-353 (Finkel- cording to how many times it was rated as the most
stein et al., 2001) was proposed as a word similarity related. According to Hill et al. (2015), the major
dataset containing 353 pairs annotated with scores weakness of this dataset is that it does not encode
between 0 and 10. However, Hill et al. (2015) word similarity, but a more general notion of associ-
claimed that the instructions to the annotators were ation.
ambiguous with respect to similarity and associa- SimLex-999 is the dataset introduced by Hill et al.
tion, so that the subjects assigned high similarity (2015) to address the above mentioned criticisms of
scores to entities that are only related by virtue of confusion between similarity and association. The
frequent association (e.g. coffee and cup; movie and dataset consists of 999 pairs containing 1,028 words,
theater). On top of it, WordSim-353 does not pro- which were also evaluated in terms of POS-tags and
vide the POS-tags for the 439 words that it contains, concreteness. The pairs were annotated with a score
forcing the users to decide which POS to assign to between 0 and 10, and the instructions were strictly
the ambiguous words (e.g. [white, rabbit] and [run, requiring the identification of word similarity, rather
marathon]). An extension of this dataset resulted than word association. Hill et al. (2015) claim that
from the subclassification carried out by Agirre et al. differently from other datasets, SimLex-999 inter-
(2009), which discriminated between similar and as- annotator agreement has not been surpassed by any
sociated word pairs. Such discrimination was done automatic approach.
by asking annotators to classify all pairs according
to the semantic relation they hold (i.e. identical, 2.4 State of the Art Vector Space Models
synonymy, antonymy, hypernymy, meronymy and
In order to compare our results with state-of-the-art
none-of-the-above). The annotation was then used
DSMs, we report the scores for the Vector Cosines
to group the pairs in three categories: similar pairs
calculated on the neural language models (NLM) by
(those classified as identical, synonyms, antonyms
Hill et al. (2015), who used the code (or directly the
and hypernyms), associated pairs (those classified
embeddings) shared by the original authors. As we
as meronyms and none-of-the-above, with an aver-
trained our models on almost the same corpora used
age similarity greater than 5), and non-associated
by Hill and colleagues, the results are perfectly com-
pairs (those classified as none-of-the-above, with an
parable.
average similarity below or equal to 5). Two gold
The three models we compare our results to are:
standard were finally produced: i) one for similarity,
i) the convolutional neural network of Collobert
containing 203 word pairs resulting from the union
and Weston (2008), which was trained on 852 mil-
of similar and non-associated pairs; ii) one for relat-
lion words of Wikipedia; ii) the neural network of
edness, containing 252 word pairs resulting from the
Huang et al. (2012), which was trained on 990 mil-
union of associated and non-associated pairs. Even
lion words of Wikipedia; and iii) the word2vec of
though such a classification made a clear distinc-
Mikolov et al. (2013), which was trained on 1000
tion between the two types of relations (i.e. simi-
million words of Wikipedia and on the RCV Vol. 1
larity and association), Hill et al. (2015) argue that
Corpus (Lewis et al., 2004).
these gold standards still carry the scores they had in
WordSim-353, which are known to be ambiguous in
this regard.
The MEN Test Collection (Bruni et al., 2014) in-
232PACLIC 30 Proceedings
Dataset SimLex-999 WordSim-353 MEN
Window 2 3 2 3 2 3
Cos Freq 0.149 0.133 0.172 0.148 0.089 0.096
Cos LMI 0.248 0.259 0.321 0.32 0.336 0.364
Cos PPMI 0.284 0.267 0.41 0.407 0.424 0.433
Cos SVD-Freq300 0.128 0.127 0.169 0.172 0.076 0.084
Cos SVD-LMI300 0.19 0.21 0.299 0.29 0.275 0.286
Cos SVD-PPMI300 0.386 0.382 0.485 0.47 0.509 0.538
APSynLMI-1000 0.18 0.163 0.254 0.237 0.205 0.196
APSynLMI-500 0.199 0.164 0.283 0.265 0.226 0.214
APSynLMI-100 0.206 0.182 0.304 0.265 0.23 0.209
APSynPPMI-1000 0.254 0.304 0.399 0.453 0.369 0.415
APSynPPMI-500 0.295 0.32 0.455 0.468 0.423 0.478
APSynPPMI-100 0.332 0.328 0.425 0.422 0.481 0.513
State of the Art
Mikolov et al. 0.282 0.442 0.433
Table 1: Spearman correlation scores for our eight models trained on RCV Vol. 1, in the three datasets
Simlex-999, WordSim-353 and MEN. In the bottom the performance of the state-of-the-art model of
Mikolov et al. (2013), as reported in Hill et al. (2015).
3 Experiments content words (i.e. nouns, verbs and adjectives)
within a window of 2, 3 and 5, even though the
In this section, we describe our experiments, starting
latter was given up for its poor performances.
from the training corpora (Section 3.1), to move to
As for SVD factorization, we found out that the best
the implementation of twenty-eight DSMs (Section
results were always achieved when the number of
3.2), following with the application and evaluation
latent dimensions was between 300 and 500. We
of the measures (Section 3.3), up to the performance
report here only the scores for k = 300, since 300 is
analysis (Section 3.4) and the scalability test (Sec-
one of the most common choices for the dimension-
tion 3.5).
ality of SVD-reduced spaces and it is always close
3.1 Corpora and Preprocessing to be an optimal value for the parameter.
Fourteen out of twenty-eight models were devel-
We used two different corpora for our experiments:
oped for RCV1, while the others were developed
RCV vol. 1 (Lewis et al., 2004) and the Wikipedia
for Wikipedia. For each corpus, the models differed
corpus (Baroni et al., 2009), respectively containing
according to the window size (i.e. 2 and 3), to the
150 and 820 million words. The RCV Vol. 1 and
statistical association measure used as a weighting
Wikipedia were automatically tagged, respectively,
scheme (i.e. none, PPMI and LMI) and to the
with the POS tagger described in Dell’Orletta (2009)
application of SVD to the previous combinations.
and with the TreeTagger (Schmid, 1994).
3.2 DSMs
For our experiments, we implemented twenty-eight
DSMs, but for reasons of space only sixteen of them
are reported in the tables. All of them include the 3.3 Measuring Word Similarity and
pos-tagged target words used in the three datasets Relatedness
(i.e. MEN, WordSim-353 and SimLex-999) and the Given the twenty-eight DSMs, for each dataset we
pos-tagged contexts having frequency above 100 have measured the Vector Cosine and APSyn be-
in the two corpora. We considered as contexts the tween the words in the test pairs.
233Dataset SimLex-999 WordSim-353 MEN
Window 2 3 2 3 2 3
Cos Freq 0.148 0.159 0.199 0.207 0.178 0.197
Cos LMI 0.367 0.374 0.489 0.529 0.59 0.63
Cos PPMI 0.395 0.364 0.605 0.622 0.733 0.74
Cos SVD-Freq300 0.157 0.184 0.159 0.172 0.197 0.226
Cos SVD-LMI300 0.327 0.329 0.368 0.408 0.524 0.563
Cos SVD-PPMI300 0.477 0.464 0.533 0.562 0.769 0.779
APSynLMI-1000 0.343 0.344 0.449 0.477 0.586 0.597
APSynLMI-500 0.339 0.342 0.438 0.47 0.58 0.588
APSynLMI-100 0.303 0.31 0.392 0.428 0.48 0.498
APSynPPMI-1000 0.434 0.419 0.599 0.643 0.749 0.772
APSynPPMI-500 0.442 0.423 0.602 0.653 0.757 0.773
APSynPPMI-100 0.316 0.281 0.58 0.608 0.703 0.722
State of the Art
Huang et al. 0.098 0.3 0.433
Collobert & Weston 0.268 0.494 0.575
Mikolov et al. 0.414 0.655 0.699
Table 2: Spearman correlation scores for our eight models trained on Wikipedia, in the three datasets Simlex-
999, WordSim-353 and MEN. In the bottom the performance of the state-of-the-art models of Collobert and
Weston (2008), Huang et al. (2012), Mikolov et al. (2013), as reported in Hill et al. (2015).
The Spearman correlation between our scores and well in two models: i) APSyn, when applied
the gold standard was then computed for every on the PPMI-weighted DSM (henceforth, AP-
model and it is reported in Table 1 and Table 2. SynPPMI); ii) Vector Cosine, when applied on the
In particular, Table 1 describes the performances on SVD-reduced PPMI-weighted matrix (henceforth,
SimLex-999, WordSim-353 and MEN for the mea- CosSVDPPMI). These two models perform consis-
sures applied on RCV Vol. 1 models. Table 2, in- tently and in a comparable way across the datasets,
stead, describes the performances of the measures generally outperforming the state-of-the-art DSMs,
on the three datasets for the Wikipedia models. Con- with an exception for the Wikipedia-trained models
currently, Table 3 and Table 4 describe the perfor- in WordSim-353.
mances of the measures respectively on the RCV Some further observations are: i) corpus size
Vol. 1 and Wikipedia models, tested on the subsets strongly affects the results; ii) PPMI strongly out-
of WordSim-353 extracted by Agirre et al. (2009). performs LMI for both Vector Cosine and APSyn;
iii) SVD boosts the Vector Cosine, especially when
3.4 Performance Analysis it is combined with PPMI; iv) N has some impact
Table 1 shows the Spearman correlation scores for on the performance of APSyn, which generally
Vector Cosine and APSyn on the three datasets achieves the best results for N=500. As a note about
for the eight most representative DSMs built using iii), the results of using SVD jointly with LMI
RCV Vol. 1. Table 2 does the same for the DSMs spaces are less predictable than when combining it
built using Wikipedia. For the sake of comparison, with PPMI.
we also report the results of the state-of-the-art Also, we can notice that the smaller window
DSMs mentioned in Hill et al. (2015) (see Section (i.e. 2) does not always perform better than the
2.5). larger one (i.e. 3). The former appears to perform
With a glance at the tables, it can be easily better on SimLex-999, while the latter seems to
noticed that the measures perform particularly have some advantages on the other datasets. This
234PACLIC 30 Proceedings
Dataset WSim (SIM) WSim (REL)
Window 2 3 2 3
Cos Freq 0.208 0.158 0.167 0.175
Cos LMI 0.416 0.395 0.251 0.269
Cos PPMI 0.52 0.496 0.378 0.396
Cos SVD-Freq300 0.240 0.214 0.051 0.084
Cos SVD-LMI300 0.418 0.393 0.141 0.151
Cos SVD-PPMI300 0.550 0.522 0.325 0.323
APSynLMI-1000 0.32 0.29 0.259 0.241
APSynLMI-500 0.355 0.319 0.261 0.284
APSynLMI-100 0.388 0.335 0.233 0.27
APSynPPMI-1000 0.519 0.525 0.337 0.397
APSynPPMI-500 0.564 0.546 0.361 0.382
PMI APSynPPMI-100 0.562 0.553 0.287 0.309
Table 3: Spearman correlation scores for our eight models trained on RCV1, in the two subsets of WordSim-
353.
might depend on the different type of similarity
encoded in SimLex-999 (i.e. genuine similarity).
On top of it, despite Hill et al. (2015)’s claim that
no evidence supports the hypothesis that smaller
context windows improve the ability of models to
capture similarity (Agirre et al., 2009; Kiela and
Clark, 2014), we need to mention that window 5
was abandoned because of its low performance.
With reference to the hubness effect, we have
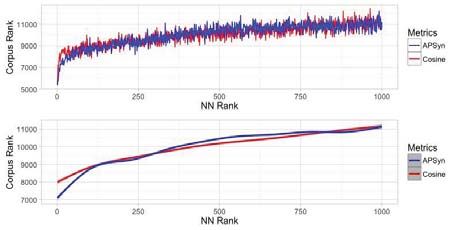
conducted a pilot study inspired to the one carried Figure 1: Rank in the corpus-derived frequency list
out by Schnabel et al. (2015), using the words of the for the top 1000 nearest neighbors of the terms in
SimLex-999 dataset as query words and collecting SimLex-999, computed with Cosine (red) and AP-
for each of them the top 1000 nearest neighbors. Syn (blue). The smoothing chart in the bottom uses
Given all the neighbors at rank r, we have checked the Generalized Additive Model (GAM) from the
their rank in the frequency list extracted from our mgcv package in R.
corpora. Figure 1 shows the relation between the Finally, few words need to be spent with regard
rank in the nearest neighbor list and the rank in to the ability of calculating genuine similarity, as
the frequency list. It can be easily noticed that distinguished from word relatedness (Turney, 2001;
the highest ranked nearest neighbors tend to have Agirre et al., 2009; Hill et al., 2015). Table 3 and
higher rank also in the frequency list, supporting Table 4 show the Spearman correlation scores for
the idea that frequent words are more likely to be the two measures calculated on the models respec-
nearest neighbors. APSyn does not seem to be able tively trained on RCV1 and Wikipedia, tested on
to overcome such bias, which seems to be in fact the subsets of WordSim-353 extracted by Agirre et
an inherent property of the DSMs (Radovanovic al. (2009). It can be easily noticed that our best
et al., 2010). Further investigation is needed to models work better on the similarity subset. In par-
see whether variations of APSyn can tackle this ticular, APSynPPMI performs about 20-30% bet-
problem. ter for the similarity subset than for the relatedness
one (see Table 3), as well as both APSynPPMI and
CosSVDPPMI do in Wikipedia (see Table 4).
235Dataset WSim (SIM) WSim (REL)
Window 2 3 2 3
Cos Freq 0.335 0.334 0.03 0.05
Cos LMI 0.638 0.663 0.293 0.34
Cos PPMI 0.672 0.675 0.441 0.446
Cos SVD-Freq300 0.35 0.363 -0.013 0.001
Cos SVD-LMI300 0.604 0.626 0.222 0.286
Cos SVD-PPMI300 0.72 0.725 0.444 0.486
APSynLMI-1000 0.609 0.609 0.317 0.36
APSynLMI-500 0.599 0.601 0.289 0.344
APSynLMI-100 0.566 0.574 0.215 0.271
APSynPPMI-1000 0.692 0.726 0.507 0.568
APSynPPMI-500 0.699 0.742 0.508 0.571
APSynPPMI-100 0.66 0.692 0.482 0.516
Table 4: Spearman correlation results for our eight models trained on Wikipedia, in the subsets of WordSim-
353.
3.5 Scalability ter is used on a PPMI-weighed SVD-reduced DSM.
Even in this case, anyway, its performance is very
In order to evaluate the scalability of APSyn, we
competitive. Interestingly, our best models achieve
have performed a pilot test on WordSim-353 and
results that are comparable to - or even better than
MEN with the same corpus used by Baroni et
- those reported by Hill et al. (2015) for the state-
al. (2014), which consists of about 2.8B words
of-the-art word embeddings models. In Section 3.5
(i.e. about 3 times Wikipedia and almost 20 times
we show that APSyn is scalable, outperforming the
RCV1). The best scores were obtained with APSyn,
state-of-the-art count-based models reported in Ba-
N=1000, on a 2-window PPMI-weighted DSM. In
roni et al. (2014). On top of it, APSyn does not suf-
such setting, we obtain a Spearman correlation of
fer from some of the problems reported for the Vec-
0.72 on WordSim and 0.77 on MEN. These results
tor Cosine, such as the inability of identifying the
are much higher than those reported by Baroni et
number of shared features. It still however seems to
al. (2014) for the count-based models (i.e. 0.62 on
be affected by the hubness issue, and more research
WordSim and 0.72 on MEN) and slightly lower than
should be carried out to tackle it. Concerning the dis-
those reported for the predicting ones (i.e. 0.75 on
crimination between similarity and association, the
WordSim and 0.80 on MEN).
good performance of APSyn on SimLex-999 (which
was built with a specific attention to genuine similar-
4 Conclusions ity) and the large difference in performance between
In this paper, we have presented the first systematic the two subsets of WordSim-353 described in Table
evaluation of APSyn, comparing it to Vector Co- 3 and Table 4 make us conclude that APSyn is in-
sine in the task of word similarity identification. We deed efficient in quantifying genuine similarity.
developed twenty-eight count-based DSMs, each To conclude, being a linguistically and cognitively
of which implementing different hyperparameters. grounded metric, APSyn offers the possibility for
PPMI emerged as the most efficient association mea- further improvements, by simply combining it to
sure: it works particularly well with Vector Cosine, other properties that were not yet considered in its
when combined with SVD, and it boosts APSyn. definition. A natural extension would be to ver-
APSyn showed extremely promising results, despite ify whether APSyn hypothesis and implementation
its conceptual simplicity. It outperforms the Vector holds on SVD reduced matrices and word embed-
Cosine in almost all settings, except when the lat- dings.
236PACLIC 30 Proceedings
Acknowledgments of the 25th international conference on Machine learn-
ing, pages 160–167. ACM.
This paper is partially supported by HK PhD Fellow- Scott Deerwester, Susan T Dumais, George W Furnas,
ship Scheme, under PF12-13656. Emmanuele Cher- Thomas K Landauer, and Richard Harshman. 1990.
soni’s research is funded by a grant of the University Indexing by latent semantic analysis. Journal of the
Foundation A*MIDEX. Thanks to Davis Ozols for American society for information science, 41(6):391.
the support with R. Felice DellOrletta. 2009. Ensemble system for part-of-
speech tagging. Proceedings of EVALITA, 9.
Michel Marie Deza and Elena Deza. 2009. Encyclopedia
References of distances. Springer.
Eneko Agirre, Enrique Alfonseca, Keith Hall, Jana Georgiana Dinu, Angeliki Lazaridou and Marco Baroni
Kravalova, Marius Paşca, and Aitor Soroa. 2009. A 2014. Improving zero-shot learning by mitigating the
study on similarity and relatedness using distributional hubness problem. arXiv preprint arXiv:1603.09054.
and wordnet-based approaches. In Proceedings of Hu- Stefan Evert. 2005. The statistics of word cooccurrences:
man Language Technologies: The 2009 Annual Con- word pairs and collocations.
ference of the North American Chapter of the Associa- Manaal Faruqui, Yulia Tsvetkov, Pushpendre Ratogi, and
tion for Computational Linguistics, pages 19–27. As- Chris Dyer. 2016. Problems With Evaluation of Word
sociation for Computational Linguistics. Embeddings Using Word Similarity Tasks. arXiv
Luis Von Ahn and Laura Dabbish. 2004. Labeling im- preprint arXiv:1301.3781..
ages with a computer game. In Proceedings of the Christiane Fellbaum. 1998. WordNet. Wiley Online Li-
SIGCHI conference on Human factors in computing brary.
systems, pages 319–326. ACM. Lev Finkelstein, Evgeniy Gabrilovich, Yossi Matias,
Marco Baroni and Alessandro Lenci. 2010. Distribu- Ehud Rivlin, Zach Solan, Gadi Wolfman, and Eytan
tional memory: A general framework for corpus-based Ruppin. 2001. Placing search in context: The con-
semantics. Computational Linguistics, 36(4):673– cept revisited. In Proceedings of the 10th international
721. conference on World Wide Web, pages 406–414. ACM.
Marco Baroni, Silvia Bernardini, Adriano Ferraresi, and David Finton. 2002. Cognitive economy and the role of
Eros Zanchetta. 2009. The wacky wide web: a representation in on-line learning. Doctoral disserta-
collection of very large linguistically processed web- tion. University of Wisconsin-Madison.
crawled corpora. Language resources and evaluation, John Rupert Firth. 1957. Papers in linguistics, 1934-
43(3):209–226. 1951. Oxford University Press.
Marco Baroni, Georgiana Dinu, and Germán Kruszewski. Zellig S Harris. 1954. Distributional structure. Word,
2014. Don’t count, predict! a systematic compari- 10(2-3):146–162.
son of context-counting vs. context-predicting seman- Felix Hill, Roi Reichart, and Anna Korhonen. 2015.
tic vectors. In ACL (1), pages 238–247. Simlex-999: Evaluating semantic models with (gen-
Yoshua Bengio, Holger Schwenk, Jean-Sébastien uine) similarity estimation. Computational Linguis-
Senécal, Fréderic Morin, and Jean-Luc Gauvain. tics.
2006. Neural probabilistic language models. In Eric H Huang, Richard Socher, Christopher D Manning,
Innovations in Machine Learning, pages 137–186. and Andrew Y Ng. 2012. Improving word representa-
Springer. tions via global context and multiple word prototypes.
Elia Bruni, Nam-Khanh Tran, and Marco Baroni. 2014. In Proceedings of the 50th Annual Meeting of the Asso-
Multimodal distributional semantics. J. Artif. Intell. ciation for Computational Linguistics: Long Papers-
Res.(JAIR), 49(1-47). Volume 1, pages 873–882. Association for Computa-
John Bullinaria and Joe Levy. 2012. Extracting Semantic tional Linguistics.
Representations from Word Co-occurrence Statistics: Mario Jarmasz and Stan Szpakowicz. 2004. Rogets
Stop-lists, Stemming and SVD. Behavior Research thesaurus and semantic similarity1. Recent Advances
Methods, 44(890-907). in Natural Language Processing III: Selected Papers
Kenneth Ward Church and Patrick Hanks. 1990. Word from RANLP, 2003:111.
association norms, mutual information, and lexicogra- Douwe Kiela and Stephen Clark. 2014. A systematic
phy. Computational linguistics, 16(1):22–29. study of semantic vector space model parameters. In
Ronan Collobert and Jason Weston. 2008. A unified ar- Proceedings of the 2nd Workshop on Continuous Vec-
chitecture for natural language processing: Deep neu- tor Space Models and their Compositionality (CVSC)
ral networks with multitask learning. In Proceedings at EACL, pages 21–30.
237Thomas K Landauer and Susan T Dumais. 1997. A so- Joseph Turian, Lev Ratinov, and Yoshua Bengio. 2010.
lution to plato’s problem: The latent semantic analysis Word representations: a simple and general method for
theory of acquisition, induction, and representation of semi-supervised learning. In Proceedings of the 48th
knowledge. Psychological review, 104(2):211. annual meeting of the association for computational
Thomas K Landauer, Peter W Foltz, and Darrell Laham. linguistics, pages 384–394. Association for Computa-
1998. An introduction to latent semantic analysis. tional Linguistics.
Discourse processes, 25(2-3):259–284. Peter D Turney and Patrick Pantel. 2010. From fre-
Omer Levy, Yoav Goldberg, and Ido Dagan. 2015. Im- quency to meaning: Vector space models of semantics.
proving distributional similarity with lessons learned Journal of artificial intelligence research, 37(1):141–
from word embeddings. Transactions of the Associa- 188.
tion for Computational Linguistics, 3:211–225. Peter D Turney. 2001. Mining the web for synonyms:
David D Lewis, Yiming Yang, Tony G Rose, and Fan Li. Pmi-ir versus lsa on toefl.
2004. Rcv1: A new benchmark collection for text cat-
egorization research. The Journal of Machine Learn-
ing Research, 5:361–397.
Baoli Li and Liping Han. 2013. Distance weighted
cosine similarity measure for text classification.. In-
telligent Data Engineering and Automated Learning
-IDEAL 2013: 611-618.
Tomas Mikolov, Kai Chen, Greg Corrado, and Jeffrey
Dean. 2013. Efficient estimation of word representa-
tions in vector space. arXiv preprint arXiv:1301.3781.
Milos Radovanovic, Alexandros Nanopoulos and Mir-
jana Ivanovic. 2010. On the existence of obsti-
nate results in vector space models. Proceedings of
SIGIR:186-193.
Magnus Sahlgren. 2005. An introduction to random in-
dexing. In Methods and applications of semantic in-
dexing workshop at the 7th international conference
on terminology and knowledge engineering, TKE, vol-
ume 5.
Magnus Sahlgren. 2008. The distributional hypothesis.
Italian Journal of Linguistics, 20(1):33–54.
Enrico Santus, Tin-Shing Chiu, Qin Lu, Alessandro
Lenci, and Chu-ren Huang. 2016. Unsupervised
Measure of Word Similarity: How to Outperform
Co-Occurrence and Vector Cosine in VSMs. arXiv
preprint arXiv:1603.09054.
Enrico Santus, Tin-Shing Chiu, Qin Lu, Alessandro
Lenci, and Chu-ren Huang. 2016. What a Nerd! Beat-
ing Students and Vector Cosine in the ESL and TOEFL
Datasets. In Proceedings of LREC.
Helmut Schmid. 1994. Probabilistic part-of-speech tag-
ging using decision trees. In Proceedings of the inter-
national conference on new methods in language pro-
cessing, volume 12, pages 44–49. Citeseer.
Tobias Schnabel, Igor Labutov, David Mimmo and
Thorsten Joachims. 2015. Evaluation methods for
unsupervised word embeddings. In Proceedings of
EMNLP.
Edward Smith, Edward Shoben and Lance Rips. 1974.
Structure and process in semantic memory: A featural
model for semantic decisions. Psychological Review,
81(3).
238You can also read