Textural and Mineralogical Characterization of Li-pegmatite Deposit: Using Microanalytical and Image Analysis to Link Micro and Macro Properties ...
←
→
Page content transcription
If your browser does not render page correctly, please read the page content below
Textural and Mineralogical Characterization
 of Li-pegmatite Deposit:
 Using Microanalytical and Image Analysis
 to Link Micro and Macro Properties of
 Spodumene in Drill Cores
 Keliber Lithium Project, Finland.

 Juan Sebastian Guiral V.

 Natural Resources Engineering, master's level (120 credits)
 2018

 Luleå University of Technology
 Department of Civil, Environmental and Natural Resources Engineering
Textural and Mineralogical Characterization of
 Li-pegmatite Deposit: Using Microanalytical
 and Image Analysis to Link Micro and Macro
 Properties of Spodumene in Drill Cores
 Keliber Lithium Project, Finland.

 by:

 Juan Sebastian Guiral V.
 Division of Minerals and Metallurgical Engineering (MiMer)
 Department of Civil, Environmental and Natural Resources Engineering
 Luleå University of Technology

 Supervisors:

 Cecilia Lund
 Pierre-Henri Koch

 Luleå, Sweden
 2018
Abstract

 Lithium represents one of the strategic elements for the rest of the 21st century due to
its increasing demand in technological applications. Therefore, new efforts should be
focused on the optimization of mineral characterization processes, which link the ore
properties with its behaviour during downstream processes. These efforts should result
in reducing operational risks and increasing resources utilization. The methodology
presented in this study is based on the application of several classification techniques,
aiming the mineral and textural characterization of two spodumene pegmatite deposits
within the Keliber Lithium Project.

 Twelve textural classes have been proposed for the textual classification of the ore,
which have been defined through the recognition of the main mineral features at macro-
and micro-scale. The textural classification was performed through the application of
drill core logging and scanning electron microscopy. Six classes are proposed to describe
the characteristics of the spodumene ore. Six additional classes describe the main
properties of the rocks surrounding the ore zone.

 Image analysis was implemented for the generation of mineral maps and the
subsequent quantification of spodumene and Li2O within the analysed drill core images.
The image segmentation process was executed in Fiji-ImageJ and is based on eight
mineral classes and a set of seven feature extraction procedures. Thus, quantification of
spodumene and Li2O is estimated by textural class. Hyperspectral images were used as
a reference for assessing the estimations made through images analysis.

 A machine learning model in Weka allowed forecasting the behaviour of the twelve
textural classes during spodumene flotation. This model is fed by metallurgical data
from previous flotation tests and uses Random Forest classifier.

 The proposed methodology serves as an inexpensive but powerful approach for the
complete textural characterization of the ore at Keliber Lithium Project. It provides
information about: (1) mineral features at different scales, (2) spatial distribution of
textures within the pegmatite body, (3) quantification of spodumene and Li2O within the
drill cores and (4) processing response of each textural class. However, its application
requires wide knowledge and expertise in the mineralogy of the studied deposits.

Keywords: Lithium, Spodumene, Pegmatite, Textural classification, Drill core photography,
Image analysis, Scanning electron microscopy, Mineral mapping, Machine learning,
Geometallurgy.

 i
Content
1. Introduction ................................................................................................................................1

 1.1 Motivation ..................................................................................................................................1
 1.2 Aim and Objectives ...................................................................................................................2

2. Literature Survey ......................................................................................................................3

 2.1 Lithium Industry .......................................................................................................................3
 2.2 Geometallurgy ...........................................................................................................................6
 2.3 The Challenge of Texture .........................................................................................................8
 2.3.1 Texture as a Function of Scale ............................................................................................9
 2.3.2 Textural Measurements ....................................................................................................10
 2.4 Data Acquisition Techniques .................................................................................................10
 2.4.1 Drill Core Logging .............................................................................................................11
 2.4.2 Principle of Scanning Electron Microscopy (SEM) .......................................................11
 2.4.2.1 Energy-Dispersive X-Ray Spectroscopy (EDS)...................................................... 11
 2.4.3 Image Analysis ...................................................................................................................12
 2.4.3.1 Image Segmentation ............................................................................................ 12
 2.4.3.2 Image Classification............................................................................................. 13
 2.4.3.3 Textural Feature Extraction ................................................................................. 14
 2.4.3.4 Morphology ........................................................................................................ 15
 2.5 Stereology .................................................................................................................................16
 2.6 Principle of Spectroscopy .......................................................................................................17
 2.6.1 Hyperspectral Imaging .....................................................................................................18
 2.7 Machine Learning....................................................................................................................18
 2.8 The Keliber Lithium Project ...................................................................................................19
 2.8.1 Geological Setting ..............................................................................................................20
 2.8.1.1 Origin and Classification of the Pegmatite Deposits ............................................... 21
 2.8.1.2 Local Geology – The Kaustinen Li-pegmatite province ........................................... 22
 2.8.1.3 Mineralogy ......................................................................................................... 24
 2.8.2 Mineral Resources and Ore Reserves..............................................................................25
 2.8.3 Spodumene Beneficiation .................................................................................................25
 2.8.4 Lithium Carbonate Production ........................................................................................27

3. Materials and Methodology................................................................................................28

 3.1 Background Data .....................................................................................................................29
 3.2 Methodology ............................................................................................................................30
 Part I – Ore Textural Characterization ...........................................................................................30
 ii
3.2.1 Drill Core Logging .............................................................................................................30
 3.2.2 Sample Preparation ...........................................................................................................30
 3.2.3 Scanning Electron Microscopy - EDS..............................................................................31
 Part II – Automated Mineral Mapping ...........................................................................................31
 3.2.4 Digital Single Lens Reflex Photography (DSLR) ...........................................................32
 3.2.5 Pre-processing - Image Enhancement............................................................................33
 3.2.6 Mineral Classification Model ...........................................................................................33
 3.2.6.1 Mineral Segmentation ......................................................................................... 34
 3.2.7 The ‘Stitching’ Process ......................................................................................................36
 3.2.8 Morphological and Stereological Corrections ...............................................................36
 3.2.9 Hyperspectral Analysis.....................................................................................................37
 Part III – Textural Classes & Processing Behaviour .......................................................................37
 3.2.10 Machine Learning Classification Model .......................................................................37

4. Results ........................................................................................................................................38

 Part I – Ore Textural Characterization ...........................................................................................40
 4.1 Textural classes ........................................................................................................................40
 4.2 Mineralogy ...............................................................................................................................43
 4.2 Spatial Distribution of Textural Classes ...............................................................................44
 Part II – Automated Mineral Mapping ...........................................................................................46
 Part III – Textural Classes & Processing Behaviour .......................................................................49

5. Performance Assessment .....................................................................................................52

 5.1 Automated Mineral Mapping................................................................................................52
 5.1.1 Mineral Classes ..................................................................................................................52
 5.1.2 Feature Extraction Scheme ...............................................................................................53
 5.1.3 Limitations ..........................................................................................................................55
 5.1.3.1 Training Dataset ................................................................................................. 55
 5.1.3.2 Segmentation Artifacts ........................................................................................ 55
 5.1.3.3 Computational Requirements ............................................................................... 56
 5.2 Textural Classes & Processing Behaviour ............................................................................57
 5.2.1 Model Performance ...........................................................................................................57
 5.2.2 Limitations ..........................................................................................................................57

6. Discussion and Conclusion.................................................................................................58

 6.1 Discussion.................................................................................................................................58
 6.2 Conclusion ................................................................................................................................60
 6.3 SWOT Analysis ........................................................................................................................61
 6.4 Project Applications ................................................................................................................62

 iii
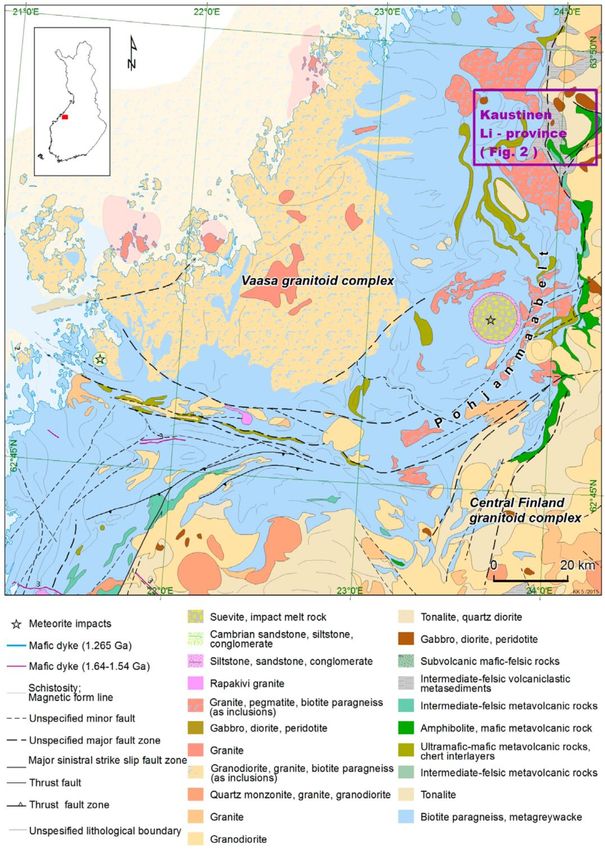
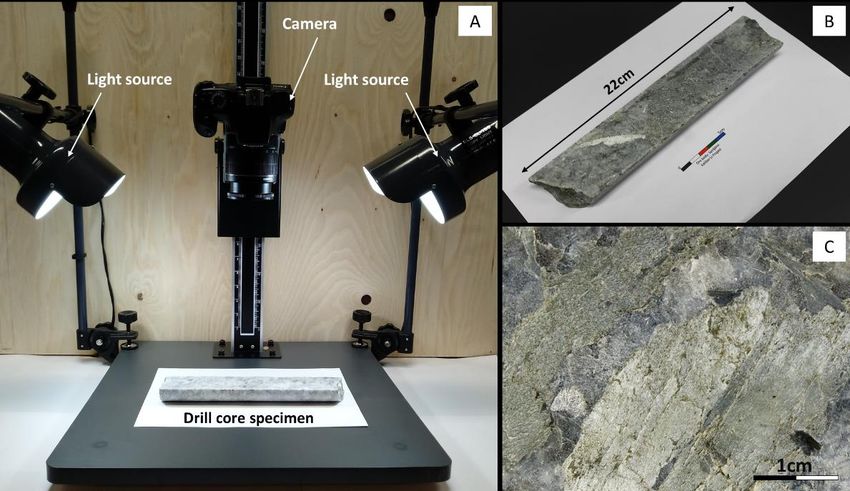
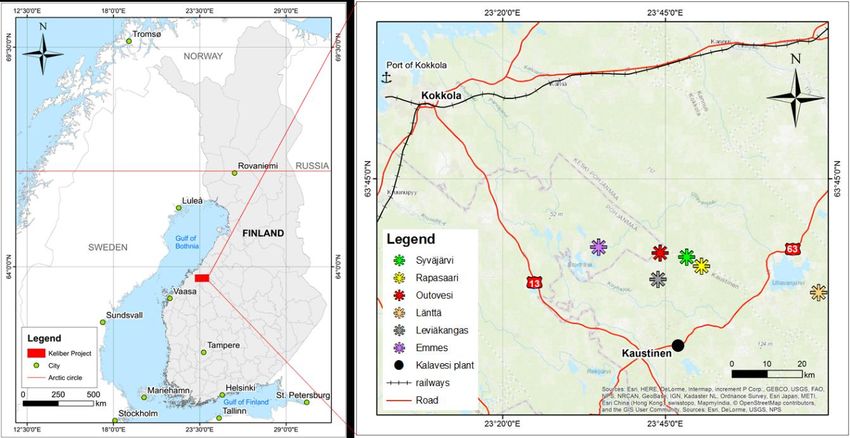
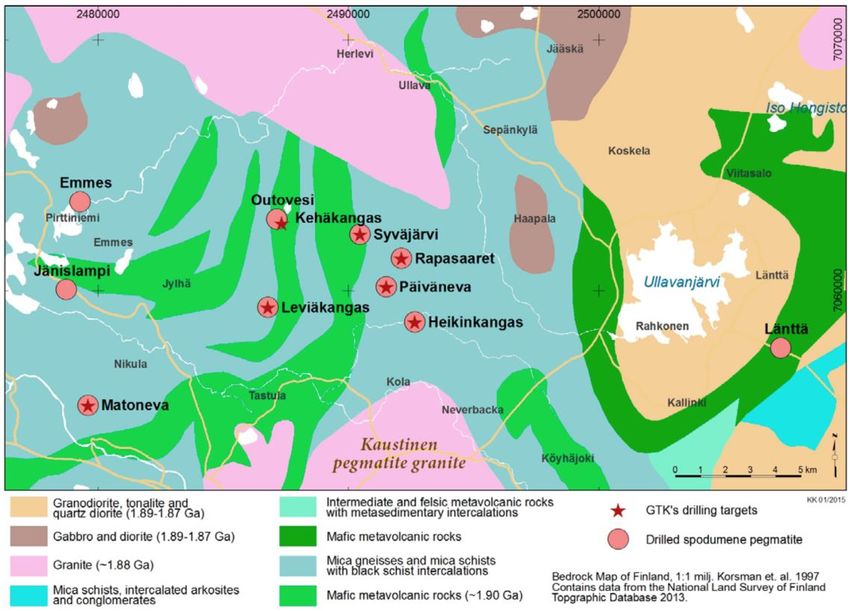
6.5 Recommendations ...................................................................................................................62

References.......................................................................................................................................63

Appendices .....................................................................................................................................69

List of figures
Figure 1. Global use of lithium by application .................................................................................. 5
Figure 2. Particle-based geometallurgical program .......................................................................... 7
Figure 3. Classification for describing the composition of particles – four mineral phases
considered ............................................................................................................................................ 9
Figure 4. Particles with similar size, shape and composition but different texture ........................ 9
Figure 5. Main steps in classifier design........................................................................................... 14
Figure 6. Morphology........................................................................................................................ 15
Figure 7. Example of erosion and dilation of a simple binary image ............................................. 16
Figure 8. left - General location of the Keliber Lithium Project. Right – Location of the six
pegmatite deposits and the Kalavesi production plant .................................................................. 19
Figure 9. Geology of the Pohjanmaa Belt. The purple rectangle indicates the location of the
Kaustinen Li-pegmatite province ..................................................................................................... 21
Figure 10. Geology of the Kaustinen Li-pegmatite province .......................................................... 23
Figure 11. Simplified flowsheet for Spd beneficiation and lithium carbonate production ........... 26
Figure 12. Schematic methodology - Parts, techniques and output information .......................... 30
Figure 13. Application of SEM-EDS. A – Epoxy polished sample. B – Carbon coated sample and
interest sites map. C – BSE image of Spd pegmatite. ...................................................................... 31
Figure 14. A - Image acquisition set-up. B - Halved drill core segment. C – Coarse Spd crystals
on the flat surface of the drill core. ................................................................................................... 32
Figure 15. Image enhancement process............................................................................................ 33
Figure 16. Training image for mineral segmentation (5,244 x 4,160 pixels) ................................... 34
Figure 17. Segmented training image (5,244 x 4,160 pixels) - Eight mineral classes ..................... 35
Figure 18. Image reconstitution ........................................................................................................ 36
Figure 19. Example of opening on a simple binary image .............................................................. 36
Figure 20. Hyperspectral drill core images from Syväjärvi deposit ............................................... 37
Figure 21. Li2O content discriminated by lithology ........................................................................ 38
Figure 22. Li2O recovery from flotation tests ................................................................................... 39
Figure 23. Idealised spatial distribution of textural classes within the pegmatite - Top view of an
ideal Spd-pegmatite dyke ................................................................................................................. 44
Figure 24. Decision tree for macro-scale ore textural classification of the Syväjärvi and Rapasaari
deposits .............................................................................................................................................. 45
Figure 25. Image processing stages .................................................................................................. 46
Figure 26. Average Li2O content per textural class – Image analysis............................................. 47

 iv
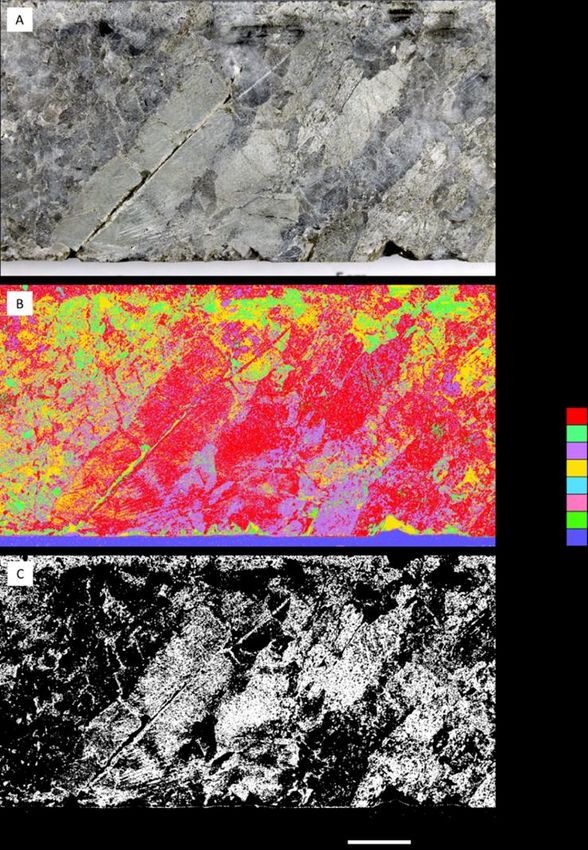
Figure 27. Comparison between spodumene content obtained from image analysis techniques
and hyperspectral analysis................................................................................................................ 48
Figure 28. Comparison between Li2O content estimated by image analysis and initial chemical
assays.................................................................................................................................................. 49
Figure 29. Forecasting of Li2O flotation recovery per textural class - Machine learning model... 50
Figure 30. Relationship between mineral classes and training time. ............................................. 52

List of tables
Table 1. Selected properties of lithium ............................................................................................... 3
Table 2. Lithium-bearing minerals found in economic deposits ...................................................... 3
Table 3. General classification and main characteristics of lithium deposits................................... 4
Table 4. Basic properties for image segmentation ........................................................................... 13
Table 5. Common terminology for pattern classification................................................................ 13
Table 6. Mineral resources estimation by deposit at Keliber Li Project (updated to May 2018) .. 25
Table 7. Ore reserves estimation by deposit at Keliber Li Project (updated to May 2018) ........... 25
Table 8. Representative drill cores selected from the Syväjärvi and Rapasaari deposits. ............. 28
Table 9. Lithological terminology for ore classification at Keliber Lithium Project. ..................... 28
Table 10. Drill core image acquisition settings - DSLR.................................................................... 32
Table 11. Description of mineral classes for segmentation and colour legend. ............................. 35
Table 12. Drill core textural classification scheme for Syväjärvi and Rapasaari deposits – Based
on drill core logging .......................................................................................................................... 41
Table 13. Description of textural classes for Syväjärvi and Rapasaari deposits – Based on drill
core logging........................................................................................................................................ 42
Table 14. Main features of the mineral phases identified by drill core logging and SEM-EDS. ... 43
Table 15. Average spodumene content per textural class – Image analysis approach.................. 47
Table 16. Average spodumene content per textural class – Hyperspectral analysis ..................... 48
Table 17. Li2O flotation recovery forecasting. Summary statistics - Random Forest classifier ..... 51
Table 18. Feature extraction schemes - Classification performance. .............................................. 54
Table 19. Image artifacts associated with mineral mapping. Artifacts and recommended
correction............................................................................................................................................ 55
Table 20. Device specifications - Computer used for the application of mineral mapping
processes ............................................................................................................................................ 56
Table 21. Li2O flotation recovery forecasting. Cross-validation summary statistics - Random
Forest classifier .................................................................................................................................. 57
Table 22. SWOT elements related with the implementation of this project................................... 61

 v
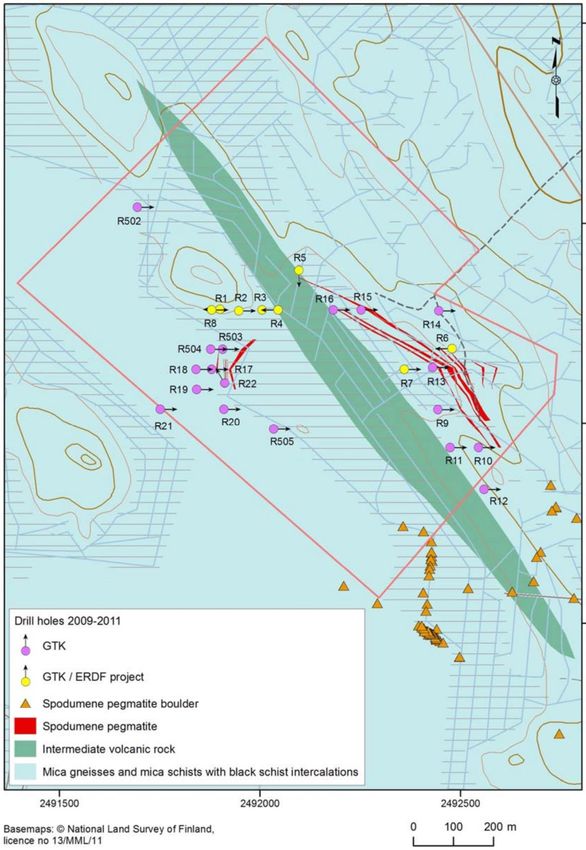
List of appendices
Appendix 1. Estimated world lithium resources............................................................................. 69

Appendix 2. Pegmatite classification scheme showing the correlation between pegmatite classes
and families ........................................................................................................................................ 70

Appendix 3. Geological map of the Syväjärvi lithium pegmatite deposit. Plan projection of the
drill core and RC drilling sites and locations of spodumene pegmatite boulders ........................ 71

Appendix 4. Geological map of the Rapasaari lithium pegmatite deposit. Plan projection of the
drill core and RC drilling sites and locations of spodumene pegmatite boulders ........................ 72

Appendix 5. Mineral phases identified by MLA ............................................................................. 73
Appendix 6. Feature extraction processes available in Trainable Weka Segmentation plugin for
Fiji-ImageJ software........................................................................................................................... 74
Appendix 7. Detailed accuracy by prediction class. Random Forest classifier.............................. 75

 vi
Preface

 The present thesis report is the outcome of the final stage of the Master’s program in
Georesources Engineering – EMerald, which is jointly developed by the following
universities: Université de Liège (Belgium), Université de Lorraine (France), Technische
Universität Bergakademie Freiberg (Germany) and Luleå Tekniska Universitet
(Sweden).

 This study was carried out at Luleå Tekniska Universitet, in cooperation with Keliber
Oy and has, as the prime focus, the description and classification of the main
mineralogical and textural properties that characterize two important Li-pegmatite
deposits in Central Ostrobothnia region, Finland.

 The methodology for developing this investigation is divided into three main parts,
each of them focused on developing a specific objective. The first part deals with the
textural classification of the ore and the recognition of the main mineral phases both in
macro- and micro-scale. The second part focuses on the automatic identification of
mineral classes based on drill core images. Finally, the third part was designed to
establish a link between the textural classes and the metallurgical ore behaviour.

 The last chapter of this thesis also deals with the identification of the SWOT elements
related to the methodology proposed for addressing this investigation. It will give
valuable information about the main advantages and weaknesses of this project.

 vii
Acknowledgements

 I would like to start saying thanks to my thesis supervisors for their trust, support
and advice. I feel really thankful to Cecilia Lund for her good ideas, for her awesome
energy and for supporting me during all the time I invested in this project, Tack så mycket!
Infinite thanks to Pierre-Henri Koch for his constant support and infinite patience, Merci
beaucoup! In addition, thanks to Glacialle Tiu for her contributions, Salamat!

 I am very grateful to Keliber Oy for the continuous support. Special thanks to Pertti
Lamberg, Pentti Grönholm and Henri Äijälä for their advice and help, Kiitos paljon!

 To all the people involved in Emerald Program, thank you for these two years of
camaraderie. To all my colleagues, professors and coordinators, Thanks a lot! Special
thanks to Fabian, Alex, Bianca, Ranee, Silvanna, Paul and Pourya. Without you guys, I
would have gone crazy!

 Special gratitude to the most important people in my life, my family. Infinite thanks
to my parents, Gladys and Francisco, for always giving me the essential support and
energy to overcome all the challenges (regardless of the enormous distance that
separates us). I would also like to thank my second parents, Lucy and Roberto, and my
brother Roger, for their continued support. Without you in my life, this would be simply
impossible. Muchas gracias!

 I could not finish without thanking all the people that have shared different
experiences with me during this long trip, contributing to make this time an
unforgettable episode in my life. Marcos Flores, Marcio Fleming, Gustavo Guerrero,
Jonathan Rincón, Alexa Gómez, Gloria Rizo, Joseane Gomes, and all those who gave me
their unconditional friendship, Thank you very much, guys!

 Infinite thanks for your good vibes, trust and friendship!

 viii
Abbreviations
Mineral deposit classifications and terminology
LCT Lithium-cesium-tantalum pegmatite family
NYF Niobium-yttrium-fluorine pegmatite family
AB-BBe Abyssal - B-rich pegmatites and/or pegmatites with Be-bearing
AB-U Abyssal - pegmatites with U-Th-Zr bearing minerals
RE-pegmatites Rear Earth-pegmatites

Elements
B Boron REE Rear earth element
Be Beryllium Sb Antimony
Cs Cesium Sc Scandium
HREE Heavy rare earth elements Sn Tin
LREE Light rare earth elements Ta Tantalum
Li Lithium Th Thorium
Na Sodium U Uranium
Nb Niobium Zr Zirconium
Rb Rubidium

Minerals 1
Ab Albite Kfs K-feldspar
Ap Apatite Ms Muscovite
Apy Arsenopyrite Pl Plagioclase
Brl Beryl Po Pyrrhotite
Bt Biotite Py Pyrite
Chl Chlorite Qtz Quartz
Fl Fluorite Sp Sphalerite
Fsp Feldspar Spd Spodumene
Grt Garnet Tr Tremolite
Hbl Hornblende Tur Tourmaline

Others
2D Two dimensions / Two-dimensional
3D Three dimensions / Three-dimensional
BSE Back Scattered Electron images
CNN Convolutional neural networks
CT Computed tomography
EBSD Diffracted backscattered electrons
EVs Electric vehicles
FIR Far-infrared
GTK Geological Survey of Finland
HSV Hue–Saturation–Value colour space (also referred to as Hue-Saturation-Brightness, HSB)

 1 Mineral abbreviations according to “List of Mineral Abbreviations. Recommendations by the IUGS Sub
commission on the Systematics of Metamorphic Rocks: Web version 01.02.07” by Siivola J. and Schmid, R. 2007.

 ix
KIP Kokkola Industrial Park
LED Light-emitting diode
LWIR Long-wavelength-infrared
MIR Middle-infrared
MLA Mineral liberation analyser
NIR Near-Infrared
QEMSCAN Quantitative evaluation of minerals by scanning electron microscopy
RAW Image data not yet processed or compressed
RGB Red-Green-Blue colour code
SEM Scanning electron microscopy
SEM-EDS Scanning electron microscopy - Energy-dispersive X-ray spectroscopy
SWOT Strengths, weaknesses, opportunities and threats
TIFF Tagged image file format
USA United States of America
UV Ultraviolet

Keliber drill core logging nomenclature
SPG Spodumene pegmatite
MPG Muscovite pegmatite
PP Pegmatite
KL Mica schist
PP Plagioclase porphyry

 x
* This page intentionally left blank *
Textural and Mineralogical Characterization of Li-pegmatite Deposit

Chapter 1

Introduction

 Nowadays, the raw materials industry is facing a big challenge: the progressive exhaustion
of large high-grade deposits is making the satisfying global demand for raw materials an
increasingly complex task (Northey et al. 2014). Due to this, it is imperative to develop new
techniques for characterizing the main properties of the ore deposits, leading to the
optimisation of all the processes related to mineral production.

 Lithium (Li) is considered to be a strategic metal for the rest of the 21st century due to the
following two factors: on the one hand, the worldwide Li demand increases every day, mainly
for technological and industrial applications such as Li-ion batteries for mobile phones or
electric vehicles, air treatment and lubricants. On the other hand, sources for this element are
not abundant. Although this element is present in several minerals in the earth's crust, not all
of them are considered as economic sources, either because of the low Li content or because of
the great difficulty to extract it (Kesler et al. 2012). In response to this problem, geometallurgy
represents a possible way to face the present and future challenges of the Li production
industry. Geometallurgy is an important tool to obtain information about ore body features
even during early exploration stages, which results in improving resources efficiency,
reducing operational risks and optimizing production in such a way that sustainability and
socio-economic demands are fulfilled (Lund and Lamberg 2014).

 This study seeks the mineralogical and textural classification of two Li-pegmatite deposits
contained within the Keliber Lithium Project in Finland. This is carried out by combining
mineralogical techniques at different scales, in addition to the application of image analysis
techniques and machine learning methods.

 It is expected that this project will serve as a guide to understand the mineral and textural
characteristics of the materials that make up the ore at Keliber Lithium Project, as well as their
behaviour during processing stages.

 1.1 Motivation
 Since the 60s, the Ostrobothnia region in Finland has been the focus of several investigations
focused on the prospecting and exploration of mineral deposits with significant Li
concentrations. Since then, several studies headed by the Geological Survey of Finland (GTK)
have focused both on the definition of the metallogenic areas in Finland, the geological
evolution of Western Finland, and the description of the Li-pegmatite deposits that
characterize the area between the towns of Kaustinen and Kokkola (Aviola 1989; Aviola et al.
2001; Al-ani and Ahtola 2008; Athola et al. 2010; Kuusela et al. 2011; Athola et al. 2015). During
the last two decades, Keliber Oy has explored the extensive lithium province of Central

 1
Textural and Mineralogical Characterization of Li-pegmatite Deposit

Ostrobothnia and has developed a Li carbonate production process specifically customized for
the Li-pegmatite deposits of the Kaustinen area (Keliber 2017).

 Several authors have studied the importance of mineralogical and textural characterization
of ore deposits as an indicator of the mineral behaviour during subsequent stages of mineral
processing (Lamberg 2011; Bonnici et al. 2008; Bonnici 2012; Lund et al. 2013; Lund and
Lamberg 2014; Lund et al. 2015; Tiu 2017; Pérez-Barnuevo et al. 2018). Different techniques
have been applied to describe and characterize the textural characteristics of ore deposits (e.g.
drill core logging, microscopy, SEM-based techniques, image analysis, hyperspectral analysis,
X-ray microtomography, etc.). However, each technique allows collecting mineralogical and
textural information at different scales (i.e. macro-, meso- and micro-scale). On the other hand,
the application of techniques for studying the association of the macro- and micro-textural
characteristics of the pegmatite bodies present in the so-called Kaustinen Li-pegmatite
Province, and that also offers a general view on the ore behaviour during its processing, has
not yet been investigated.

 1.2 Aim and Objectives
 This study aims to develop a methodology for the identification and classification of ore
textures from drill cores, by linking macroscopic and microscopic properties of the minerals
that make up the Li-pegmatite deposits in the Kaustinen area. Moreover, this textural
characterization aims to give information about the lithium content and the variability of the
ore behaviour during processing stages.

 This will be achieved through to the fulfilment of the following three specific objectives:

 Objective 1 - To produce a textural classification scheme based on the relationship between
macro- and micro-scale mineral and textural properties of the minerals present in the ore. The
behaviour of an ore during a process is controlled by the mineral phases and their textural
characteristics. The proposed textural classification scheme would be the bridge that connects
geological attributes and metallurgical responses.

 Objective 2 - To generate a model for the automatic classification of drill core images in mineral
classes for the subsequent estimation of Li content. Mineral maps allow the extraction of valuable
mineralogical and textural data, which is useful for determining mineral content per textural
class.

 Objective 3 - To integrate textural features of the ore and metallurgical behaviours. Models
that allow obtaining insights about the performance of the ore during its processing, based on
its textural characteristics, would represent a fast and low-cost alternative to assess the ore
variability at Keliber Lithium Project.

 2
Textural and Mineralogical Characterization of Li-pegmatite Deposit

 Chapter 2

 Literature Survey

 2.1 Lithium Industry
 Lithium is the lightest metal, the least dense of the all the elements that are not gases at
 20°C, can float on water and, in the latter part of the 20th century, became important as an
 anode material in lithium batteries (BGS 2016; Goonan 2012). Because of these and other
 properties (Table 1), the utility of lithium has found its peak application in Li-ion batteries,
 which represents the major and growing industrial application and demand for this element
 due to the proliferation of mobile electronic devices and the diversification of electric vehicles
 (EVs) (Tomascak et al. 2016).

 Table 1. Selected properties of lithium (modified from Tomascak et al. 2016).

 Properties Units
 Symbol Li
 Atomic number 3
 Atomic weight 6.94
 Density in solid form at 534 km m-3
 20°C
 Melting point 180.54 °C
 Boiling point 1342 °C
 Atomic radius 152 pm
 Crystal structure Body centred cubic
 Appearance Silvery-white
 Hardness 0.6 Mohs scale
 Electrical resistivity 9.5 mΩ cm
 Thermal conductivity 85 W m-1 K-1

 Due to its reactivity, Li does not occur in elemental form in nature. However, there are more
 than 100 known minerals that may contain Li, although only a few of these are currently
 considered as economic sources. Table 2 briefly describes the most common Li-bearing
 minerals found in economic deposits.

 Table 2. Lithium-bearing minerals found in economic deposits (source: BGS 2016 and references therein).
 (Hardness given in Mohs scale. Densities in kg m-3). Importance as economic source for lithium is specified.

 Li content Economic
 Mineral Formula Description
 (Li wt. %) importance
 Most abundant Li-bearing mineral found
Spodumene LiAlSi2O6 3.70 High
 in economic deposits.
 Uncommon form of mica that is found in
 K2(Li,Al)5-6(Si6-7 pegmatites. Hardness of 2.5-3 and density
Lepidolite 1.39 – 3.60 Low
 Al2-1O20)(OH,F)4 2.8 to 3. Colourless, grey, yellow or white;
 vitreous.

 3
Textural and Mineralogical Characterization of Li-pegmatite Deposit

 Monoclinic with two cleavage directions.
 It often occurs in pegmatites and can alter
Petalite LiAlSi4O10 1.60 – 2.27 to spodumene. Hardness of 6 and density Low
 2.4. Colourless, grey, white; vitreous to
 pearly.
 Formerly an important source of Li
 Not
 worked in Zimbabwe, but deposits are
Eucryptite LiAlSiO4 2.10 – 5.53 currently
 rare. Hardness of 6.5 and density 2.6.
 used
 Brown, colourless or white; vitreous.
 It was also extracted for Li in Zimbabwe.
 Not
 Deposits are uncommon. Hardness of 5.5
Amblygonite LiAl(PO4)(F,OH) 3.40 – 4.70 currently
 to 6 and density 3. White, yellow or grey;
 used
 vitreous to pearly.
 Trioctahedral smectite clay mineral
 formed from the alteration of
 Na0.3(Mg,Li)3Si4O1 Future
Hectorite 0.54 volcaniclastic rocks by hydrothermal
 0(OH)2 source
 activity and hot-spring waters. Hardness
 1-2 and density 2 to 3. Opaque white.
 Monoclinic borosilicate mineral
 Future
Jadarite LiNaSiB3O7(OH) 7.30 discovered in Serbia in 2007. Hardness 4-5
 source
 and density 2.45. White; porcellaneous.

 According to BGS (2016), lithium deposits can be classified into two groups: Minerals and
 Brines. In terms of minerals, this element is currently extracted from pegmatite deposits, with
 spodumene being, by far, the most important Li-bearing mineral, and petalite along with
 lepidolite representing sources of minor economic importance. However, future sources are
 likely to include deposits of hectorite and jadarite. Brines with Li include continental,
 geothermal and oilfield brines. Extraction from this group of deposits primarily occurs from
 continental brine deposits, but extraction from geothermal and oilfield brines has been
 demonstrated in recent years, albeit not yet on a commercial scale (BGS 2016). Table 3 briefly
 describes the key characteristics of these deposits with some examples.

 Table 3. General classification and main characteristics of lithium deposits (Source: BGS 2016)
 (* grade in wt.% Li2O. ** grade in wt.% Li).

 Deposit Typical
 Class Brief description Example
 type grade
 Coarse-grained igneous rocks formed Greenbushes,
 Pegmatites 1.5 – 4* during late-stage crystallisation of Australia; Kaustinen,
 magmas. Finland.
 Minerals Lenses of smectite clay in association Kings Valley, USA;
 Hectorite 0.4*
 with volcanic centres. Sonora, Mexico.
 Altered sediments in an enclosed
 Jadarite 1.5* Jadar, Serbia.
 basin.
 Salt pans in enclosed basins with Li
 Clayton Valley, USA;
 enrichment likely to be from hot
 Salar de Atacama,
 springs. These deposits usually occur
 Continental 0.04 – 0.15** Chile; Salar de
 in areas where high solar evaporation
 Hombre Muerto,
 results in a further increase in Li
 Argentina.
 Brines concentration.
 Elevated levels of Li contained in
 Geothermal 0.01 – 0.035** Salton Sea area, USA.
 steam at geothermal power stations.
 Elevated levels of Li contained in
 Smackover oilfield,
 Oilfield 0.01 – 0.05** waters or brines produced in
 USA.
 oilfields.

 4
Textural and Mineralogical Characterization of Li-pegmatite Deposit

 Lithium is probably most familiar in everyday use in the Li-ion batteries that power modern
mobile electronic devices. However, this element has a wide variety of other uses and,
historically, greater quantities have been used in the ceramics and glass industries (BGS 2016).
Figure 1 shows the use of Li by application. The future demand for this element will depend
on a wide range of factors, including population and the degree to which demand expands to
developing countries. Over the period 2010 to 2100 a maximum demand of 3.6 Mt is estimated
for newly mined Li to supply Li-ion batteries in portable electronics, 12.8 Mt Li-ion batteries
in EVs and additional 3.2 Mt of lithium for all other markets. Thus, the total estimated demand
for newly mined Li (after considering recycling) until the end of this century is almost 20 Mt
(Kesler et al. 2012 and references therein).

 Figure 1. Global use of lithium by application (Source: BGS 2016 and reference therein).

 Global resources of lithium have been estimated by the USGS at 2017 to be approximately
46.9 Mt, with the largest resources held by Bolivia, Chile, Argentina, USA, China and
Australia. On the other hand, world Li reserves are approximately 14 Mt, with the most
significant held by Chile, China, Argentina and Australia (USGS 2017; BGS 2016). Appendix 1
summarises the global Li resources classified by deposit type.

 For many of the end uses of lithium, recycling does not appear to be carried. This is partly
because most of these end applications are dissipative, as in ceramics and glass. Although Li
is completely recyclable and can be reused repeatedly without loss of performance, the
economic incentive to do so from batteries is limited because the process is expensive, the
quantities of Li contained are low and supplies of primary materials are often more cost-
effective (BGS 2016).

 Even though there are substitutes available for Li in many applications such as batteries,
ceramics, greases and manufactured glass, there is often scarce incentive to replace it because
there has not been a supply shortage, Li is relatively inexpensive, and its performance is
comparably more efficient. There is a very wide range of other, non-lithium, battery types in
the market with different advantages and disadvantages compared to Li-ion types but, in
general, it is the Li-ion battery that is progressively replacing the other types. This is

 5
Textural and Mineralogical Characterization of Li-pegmatite Deposit

particularly due to the high-energy density and lightweight properties that lithium can offer
(BGS 2016 and references therein).

 According to Arndt et al. (2010), lithium has become essential for global industry and
special attention should be paid to its production and market. At present, the vast majority of
the resources are in South America, in politically unstable countries with a troubled history of
mining and mineral exploration. Technical and environmental issues are also associated with
the production of Li from these deposits. Additionally, the estimated increasing Li demand
during the rest of the 21st century implies the necessity for greater efforts on increasingly
efficient production processes, as well as the more efficient use of Li in different applications
(Arndt et al. 2010).

 2.2 Geometallurgy
 The idea of geometallurgy seeks for the improvement of the knowledge of an ore by
developing methods to measure parameters with high importance for processing (Lund and
Lamberg 2014). According to Jackson et al. (2011), this concept is presumably traced from the
earliest days of mineral exploration in the mid-1,500s but is during the late 20th century when
geometallurgy began taking importance, requiring the integration of relevant functional units
and disciplines. Thus, geometallurgy can be interpreted as a combination of geological,
mineralogical and metallurgical information to create spatially-based predictive models for
designing a suitable mineral process, which results in production optimisation (Lamberg 2011;
Lund and Lamberg 2014).

 As a multi-disciplinary approach, geometallurgy can quantitatively forecast the quality of
concentrates and tailings, metallurgical performance (e.g. metallurgical recoveries and
throughput) and environmental impact (e.g. freshwater usage per processed tonne of ore)
(Lishchuk et al. 2015).

 The implementation of geometallurgy in a mining project relies on the development of
geometallurgical models followed by a geometallurgical program. The geometallurgical
program is an industrial application consisting of continuous actions to increase the
knowledge on the variability of the ore body (including both geological and processing
properties) with the aim of understanding the effects of that variability on the ore processing
and how it can be used in production planning and management (Lishchuk 2016).

 There are basically two different approaches for relating geological and metallurgical
information to generate spatially-based predictive models (Lund, Lamberg, and Lindberg
2013). The first one is based on geometallurgical testing (Lund et al. 2013; Lamberg 2011),
which rely on metallurgical response with no information about mineralogy (Lund and
Lamberg 2014). The second approach contemplates minerals as key elements to relate geology
and metallurgy, considering their chemical composition, mass proportions and their
associations in ore textures (Lishchuk 2016; Lund, Lamberg, and Lindberg 2013). Figure 2
schematises the particle-based geometallurgical approach in a cyclic diagram.

 Based on this approach, it is possible to divide a geometallurgical program in a geological
model, a process model and a production model (Lund and Lamberg 2014). The geological

 6
Textural and Mineralogical Characterization of Li-pegmatite Deposit

model should give enough information to forecast the behaviour of particles during
processing, based on mineralogy and textural information (Lishchuk 2016 and references
therein). It relies on a properly performed ore characterization, which depends on quick and
efficient but inexpensive modal analysis and textural analyses. Process models take the
information from the geological model and translate it into metallurgical performance data.
This is achieved by dividing the ore body into textural classes or archetypes, considering that
samples are texturally similar if the behaviour of the particles they produce is similar during
a metallurgical process. Finally, the production model combines the geological and
metallurgical models as a tool for production management, taking care of the production
schedule and economic programs (Lund and Lamberg 2014).

 Figure 2. Particle-based geometallurgical program (modified from Lamberg 2011).

 Due to the crucial role of mineralogical characterization for the correct definition of
geological models, recent studies have focused on the development of methodologies and
techniques for efficient characterization of the variability within the ore, as well as in the
development of geometallurgical models in different mineral deposits and mining operations
(Lund et al. 2013; Jackson et al. 2011, Montoya et al. 2011, Keeney and Walters 2011,
Dzvinamurungu et al. 2013, De Magalhães and Tavares 2014, Compan et al. 2015, Deutsch et
al. 2015, Mwanga et al. 2017, Navarra et al. 2017). Moreover, several studies have been carried
out to improve the understanding of mineral textures and their implications for mineral
processing. Lund et al. (2015) presented a geometallurgical methodology which combines
textural classification, breakage model and process model for processing forecasting. Koch
(2017) describes a tool to simulate mineral particles by relating meso-textural information with
micro-textures. Koch et al. (2017) and Tiu (2017) presents techniques to identify and classify
textures directly from drill cores. Pérez-Barnuevo et al. (2013) report a methodology for the
textural characterization of chalcopyrite from a rougher concentrator. Pérez-Barnuevo et al.
(2018) worked on a methodology based on image analysis for automated identification of drill
core textures.

 7
Textural and Mineralogical Characterization of Li-pegmatite Deposit

 2.3 The Challenge of Texture
 It is widely accepted that textures are critical mineralogical characteristics which strongly
govern the ore behaviour in mineral processes (Lund et al. 2015; Bonnici 2012; Cropp et al.
2013; Tungpalan et al. 2015; Dey et al. 2017; Pérez-Barnuevo et al. 2018). The problem relies on
how to describe textures and how to use that information to forecast the ore behaviour during
processing (Bonnici et al. 2008; Lund et al. 2015). This is particularly associated with the
different classification schemes between geologists, mineral processors and metallurgists.

 From the geological point of view, Best (2003) defines the term fabric as used for all of the
non-compositional properties of a mass of rock discernible on scales of observation from
outcrop and hand sample to microscopic. This term includes both the concept of texture and
structure. The first concept refers to grain characteristics – including grain size and shape,
inter-grain relations and amount of glass – generally seen at the scale of hand sample or
smaller. On the other hand, structure refers to features seen at a scale of a hand sample or
larger. Geological description and classification of mineral textures seek for the identification
of the minerals and rock genesis. They can be used either to define the name of the rock – or
form part of the rock name itself –, and generally consider the description of attributes in
qualitative terms which may differ between geologists and frequently result in poorly defined
qualitative data (Bonnici 2012; Lund et al. 2015). This descriptive information is not adequate
and insufficient for geometallurgical purposes since it is difficult to integrate into models to
be used in mineral exploration and/or mineral processing circuits.

 Geologists also have wide arrangements of nomenclature for textural description of mineral
crystals, typically referred to the size, shape and conditions of the mineral grain (Bonnici 2012).
This nomenclature is intended to give information about the relative dimensions of the crystal
faces by associating the external crystal shape to resembling geometric elements (e.g. cubes,
cylinders) or to objects with well-known shape (e.g. needles, fibres). How well the faces are
developed in a crystal is categorised by employing the terms euhedral (well-developed),
subhedral (incompletely developed) and anhedral (undeveloped) (Best 2003).

 In the field of ore mineralogy, textures are characterized based on the presence of valuable
minerals (ore minerals) and their relationship with the gangue phases in the orebody (Bonnici
2012). Barton (1991) presents a detailed analysis of ore textures based on the spatial
relationship between valuable and gangue minerals and its implications for mineral
stratigraphy, hydrothermal processes and mineral formation. This provided guides to
understand the nature and duration of geological processes.

 In mineral processing and metallurgy, the term texture (also referred to as micro-structure)
is applied to describe the size and shape of particles (broken fragments of rocks) and then
extended to the description of quantity and types of mineral components that make up the
particle (Bonnici 2012 and references therein). In these fields, the classification of ore grain
textures is intended to associate grains to processing characteristics, i.e. attributes that are
likely to influence the processes of liberation, flotation and ultimately the recovery of the
valuable mineral phase (Cropp et al. 2013; Bonnici 2012 and references therein). Thus, a
particle can be classified based on the number of mineral phases it comprises. This

 8
Textural and Mineralogical Characterization of Li-pegmatite Deposit

classification assumes that the fewer mineral phases are contained in a particle, the more likely
that the valuable mineral will be exposed on the particle surface and the more likely that it will
be recovered e.g. by flotation (Figure 3). However, particles of the same size, shape and
mineral composition can present significantly different mineral processing properties based
on their textures (Bonnici 2012; Figure 4).

 Figure 3. Classification for describing the composition of particles – four mineral phases considered (modified
 after Jones 1987 in Bonnici 2012). Binary: composed of two mineral phases (A and B); Ternary: composed of
 three mineral phases (A, B and C); Quaternary: composed of four mineral phases.

Figure 4. Particles with similar size, shape and composition but different texture (modified after Jones 1987 in
 Bonnici 2012). Particles 1 and 2 will have different flotation behaviour. Particles 3 and 4 are similar in size,
 shape and mineral composition. In particle 4, mineral phases can be partially separated, but in particle 3 it is
necessary to decrease particle size to achieve the liberation of mineral C. In particle 5, mineral B is not available
 for attack by leaching agents, but in particle 6, mineral D is readily for leaching.

 There are several terms to describe and classify the distribution of minerals in particles,
which typically refers to the location of the valuable mineral phase with respect to the particle
surface (Bonnici 2012). This nomenclature brings up the concept of liberation, which gives
information about the amount of target mineral exposed on the particle surface. Liberation is
one of the major objectives of comminution, by releasing the valuable minerals from associated
gangue at the coarsest possible particle size (Wills and Napier-Munn 2006). This concept can
be divided into four main terms: (1) Complete liberation, indicating the total exposition of the
target mineral. (2) Locked mineral, which indicates that target minerals are completely
enclosed by gangue minerals. (3) Middling, referring to particles formed by locked minerals.
(4) Refractory, associated with ores that are difficult to treat due to complex mineralogy or
because target minerals are finely disseminated (Bonnici 2012).

 2.3.1 Texture as a Function of Scale
 There are three different scales for the identification and description of textural features, i.e.
mega-, macro- and micro-scale. They are based both on the size of the sample and the size of the
features to identify, i.e. mega-, macro- or micro-textures. Thus, the term mega-texture is related to
features that are observable from a distance, macro-textures are observed in hand specimen and
micro-textures can only be recognised with the aid of magnification instruments (Bonnici 2012).

 9
Textural and Mineralogical Characterization of Li-pegmatite Deposit

 Generally, the acquisition of textural data is performed at different scales during the entire
history of exploration, exploitation and processing of an ore deposit. For instance, drill-core
logging is routinely undertaken by geologists, but it typically does not document attributes
that are likely to affect mineral processing behaviours other than the relative abundance of
valuable minerals and vein structures. On the other hand, mineral processors and
metallurgists typically do not consider geological features as texture for selecting true ‘ore
types’ which will directly impact the design of mining operations. Thus, the integration of
mineralogical and textural features that are identified at various scales is tremendously
important since it is the bridge that links geological attributes to mineral processing
behaviours (Bonnici 2012; Bonnici et al. 2008 and references therein).

 2.3.2 Textural Measurements
 Qualitative or categorical classification of textures made by geologists, besides being
difficult to integrate into models, has no information to establish a direct relationship with
mineral processing properties (Bonnici 2012). If the description of textures can be performed
numerically, and even with additive parameters, then it is possible to process them with
geostatistical methods similarly to metal grades in resource estimation (Lund et al. 2015 and
references therein).

 With the aim of performing comprehensive quantitative textual analysis of a rock, particle
or mineral, texture needs to be considered in terms of its individual components. This will
allow the understanding of how individual textural parameters can influence the processing
behaviours. Typical textural parameters are size (referred to the measure of space occupied by
an object), shape (associated to the external form or contour of minerals), modal mineralogy
(relative distribution of minerals), mineral associations (relationship between target mineral and
gangue phases) and mineral distribution (Bonnici 2012).

 There is a wide variety of techniques that allow the measuring of textural features or
descriptors, which allow us to obtain information on the textural parameters above mentioned.
The application of these techniques depends on the scrutiny scale and the required precision.
For instance, visual logging, optical microscopy and SEM-based techniques can give
information about the mineral phases and their proportion within the ore, but the
measurement scales are completely different. However, these can be integrated to extract
complementary data.

 2.4 Data Acquisition Techniques
 In this study, the acquisition of textural and mineralogical data has been performed both
on macro- and micro-scale, through the visual inspection of drill cores and the application of
SEM-EDS.

 A series of image analysis techniques were applied to generate a model for the automated
drill core mineral classification. Subsequently, hyperspectral analyses served as reference data
to compare the results obtained from the image analysis processes. Finally, machine learning
methods allowed to establish the link between ore textural data and processing behaviours.

 10
You can also read