The Breeding Birds of Tommy Thompson Park - Toronto and Region Conservation Authority
←
→
Page content transcription
If your browser does not render page correctly, please read the page content below
The Breeding Birds of
     Tommy Thompson Park

                         2019

               Virginia Rail Nest (I. Sturdee)

Toronto and Region Conservation Authority

                     Prepared by
             Don Johnston and Ian Sturdee

                      April, 2020
Table of Contents

1. Introduction

   1.1   Study Area (Tommy Thompson Park) ……………………………………………………...............                 1

2. Colonial Waterbirds and Managed Waterfowl

   2.1   Project Background…………………………………………………………………………………….                                  1

   2.2   Results in 2019 .………………………………………………………………….…………………….                                 2
         2.2.1 Managed Waterfowl …………….………………………………………………………………                               5

3. Landbirds and Non-colonial Waterbirds

   3.1   Project Background………………………………………………………………………..……………                                 5
         3.1.1 Rationale………………………………………………………………………………………….                                   5
         3.1.2 Change in Data Reporting………………………………………………………………………                            5

   3.2   Results in 2019
         3.2.1 Variable Circular Plot Point Count Results…………………………………………………..                 5
               3.2.1.1 VCP Station Vegetation Survey..…………………………………………………..                    5
               3.2.1.2 VCP Observations..………………………………………………………………….                            8
         3.2.2 Nest Searching and Monitoring Results………………………………………………………                     12
               3.2.2.1 Changes in Nest Density for Each Zone ……………….…………………………                15
               3.2.2.2 Nest Productivity……………………………………………………………………..                          16
               3.2.2.3 Nest Predation in 2019 …………………………………………………………….                        16
               3.2.2.4 Species Detected During the Breeding Season from All Studies ……………..   17
               3.2.2.5 Gray Catbird Recycling a Red-winged Blackbird Nest …………….……………         17
               3.2.2.6 Parasitism by Brown-headed Cowbirds…………………………………………...                 18

   3.3   The Overall Picture in 2019……………………………………………………………………………                             19

4. Acknowledgments……………………………………………………………………………………..........                                  20

References…………………………………………………………………………………………………………                                            21

Appendices
  A Description of VCP Stations (Habitat Pictures and Maps) …………………………………………..                24
  B Map of TTP Breeding Bird Zones …………………………………………………………………........                          33
  C Species Accounts …………………………………………….…………………………………….........                                34
  D Map of 2019 Landbird Nest Locations ……………….……….……………….………………………                           40
  E Breeding Status Codes for Each Species Detected in 2019 …………………………………………                  41
  F Breeding Bird Report Methodologies and Protocols .…………………………………………………                     42
  G Notes to Annual Breeding Bird Reports 2005 to 2019 ……………………………………..…………                   45

                                                    i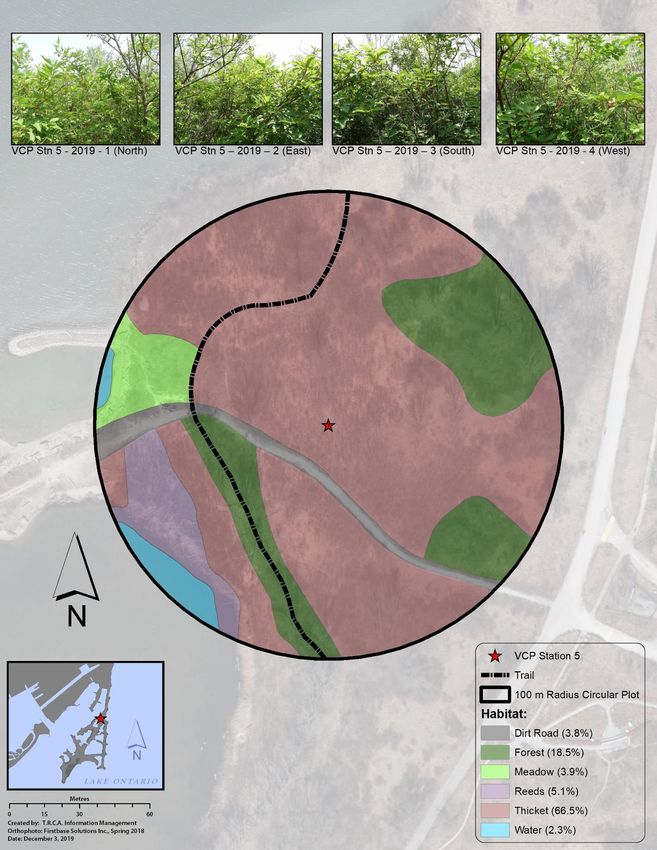
Tables and Figures

                         Colonial Waterbirds and Managed Waterfowl

Tables
2.1 Colonial Waterbird Nests at TTP, 2008 – 2019 …………………………………………………….                  4

Figures
2.A Colonial Waterbird Nesting Areas, 2019 …………………………………………………………….                     2
2.B Double-crested Cormorant Nests at TTP by Sub-colony, 1998 – 2019 ………………………….        3
2.C Black-crowned Night-Heron Nests at TTP by Sub-colony, 1998 – 2019 ………...………………      3

                            Landbirds and Non-colonial Waterbirds

Tables
3.1 2010 - 2019 VCP Station Vegetation Analysis …………………………………………………….                    7
3.2 VCP Species Lists and Total Birds Detected by Species Within 100 Metres …………..………    9
3.3 Total Nests by Species from 2010 to 2019 …..……………………………………………………..                  13
3.4 Species Reaching New Nest Highs in 2019 ………………………………………………………..                     14
3.5 Nest Productivity from 2010 to 2019 ……………….……………………………………….………                      16
3.6 Summary of Species Detected During Breeding Season From All Studies .………..………….     17
3.7 Brown-headed Cowbird Parasitism Rates from 2010 to 2019 ……………………………………              18
3.8 Species Recorded Only By VCP Counts Versus Species Recorded Only By Nests ………….     20
3.9 2019 Effort by Nest Searching Project Participants (hours) ………………………………………          20
F.1 VCP Station Information ………………………………………………………………………………                              42
F.2 Primary Habitat Type by Zone ……………...………………………………………………..………                        43

Figures
3.A Annotated Map of Tommy Thompson Park with VCP Station Locations ……………………….           6
3.B Total Bird Abundance per VCP Station .……………………………………………………………                       11
3.C Species Richness per VCP Station ….……………………………………………………………..                        11
3.D Nest Searching Effort per Zone from 2010 to 2019 ………………………………………………..               12
3.E Nest Density by Zone …………………………………………………………………………………                                15
3.F Known Nest Failure Rate Trend …………...…………………………………………………………                         16
3.G Brown-headed Cowbird Parasitism Rate Trend ……………………………………………………                     19

                                               ii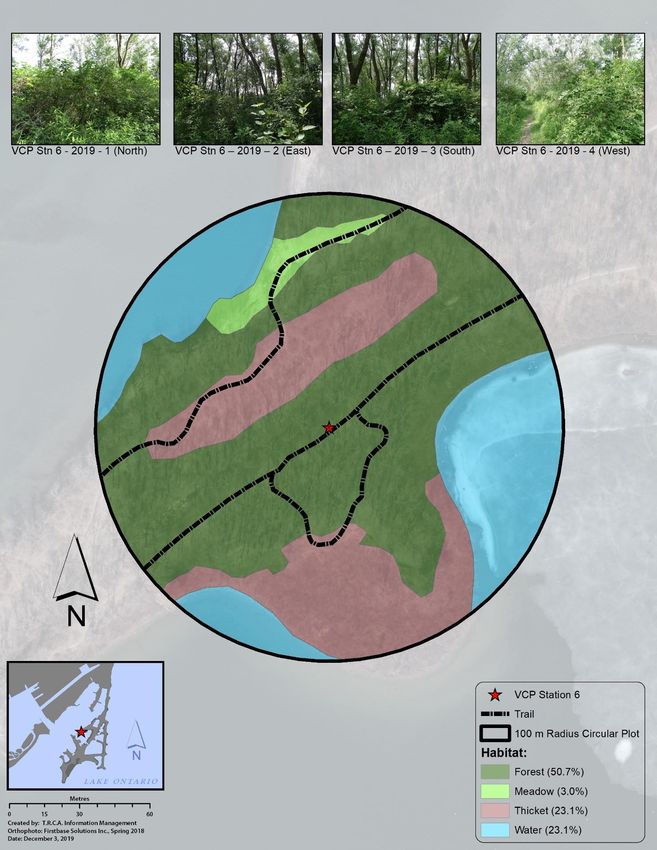
1. Introduction

     1.1 Study Area
                                                           Tommy Thompson Park (TTP) is located on the Leslie
                                                           Street Spit, a 471-ha, 5-km long man-made peninsula
                                                           extending into Lake Ontario in Toronto. When construction
                                                           of the Spit began in 1959 by the Toronto Harbour
                                                           Commission (now Ports Toronto), the intention was to create
                                                           new lands for port related facilities. However, for a variety of
                                                           reasons port related expansion did not occur and natural
                                                           succession was allowed to progress. As such, the Province
                                                           of Ontario awarded Toronto and Region Conservation
                                                           Authority (TRCA) the responsibility of creating a Master Plan
                                                           for a public park. Landform construction was ongoing until
                                                           2015, and while the final size of the Spit (including waterlots)
                                                           is complete, occasional works will be required into the future
                                                           to maintain shoreline stability.

               TTP Aerial View (TRCA, 2014)                Over the years, the Spit evolved into the largest area of
                                                           natural habitat on the Toronto waterfront, both through
natural succession and habitat enhancement projects by TRCA. A variety of vegetation communities, including
successional forests, meadows, coastal wetlands and sand dunes, provide diverse habitats for a wide range of
species. Gulls and terns began nesting in the early 1970s, and continued nesting by these species and night-herons
earned TTP the designation of an Environmentally Significant Area in 1982. Further, in 2015, this designation was
extended to the entire Spit due to rare species and/or rare communities, and significant ecological functions.

The diverse habitats at the park, along with the geographical position have made it a critical site for birds throughout
the year. To date, 323 species have been recorded at the park, and in 2000, the Leslie Street Spit/TTP was named an
Important Bird Area by BirdLife International. This designation is due to the globally significant populations of nesting
colonial waterbirds, the continentally significant numbers of overwintering waterfowl, and nationally significant numbers
of migratory birds.

2.     Colonial Waterbirds and Managed Waterfowl

     2.1 Project Background
                                                             Colonial waterbirds have a long history at Tommy
                                                             Thompson Park and are one of the reasons the park was
                                                             designated a globally significant Important Bird Area in
                                                             2000 (Wilson et al., 2001).

                                                             In 2019, five species of colonial waterbirds nested at
                                                             Tommy Thompson Park, namely two species of tree-
                                                             nesters (Black-crowned Night-Heron and Great Egret), two
                                                             species of ground-nesters (Common Tern and Ring-billed
                                                             Gull), and one species which nests both in trees and on
                                                             the ground (Double-crested Cormorant).

              Great Egret on Nest (P. Robillard)

                                                          -1-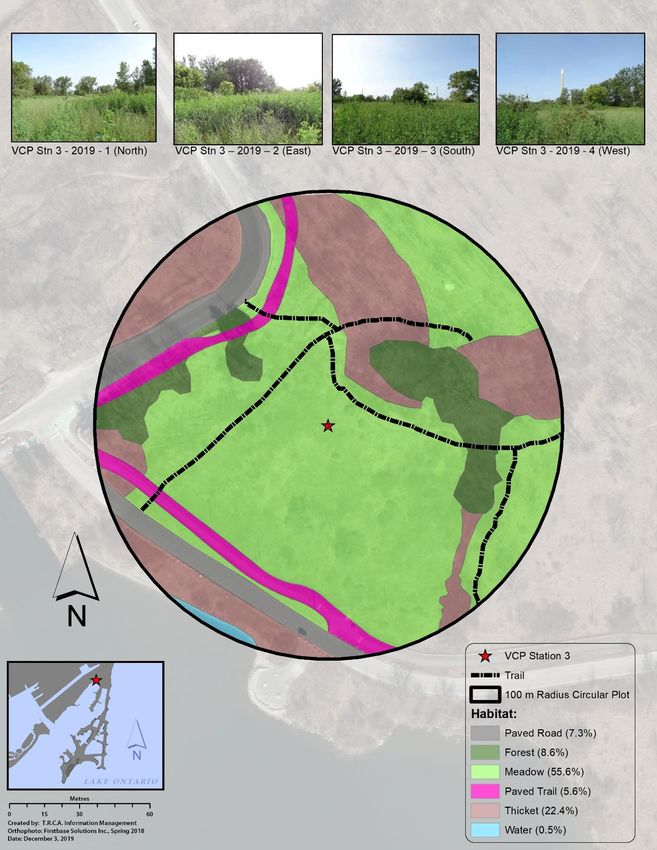
2.2 Results in 2019
In 2019 Double-crested Cormorants nested in trees on Peninsulas A, B and C, as well as on the ground on
Peninsulas A and B. Black-crowned Night-Herons nested on Peninsulas B and C, and in the treed areas north of
Goldfish Pond. Great Egrets nested on Peninsulas B and C. Ringed-billed Gulls nested on the ground on
Peninsulas A and B, and on the Embayment A Common Tern nesting raft. The nesting areas of cormorants, night-
herons, egrets and Ring-billed Gulls is illustrated in Figure 2.A. Common Terns nested on the artificial nesting raft
in Embayment D, and one individual nest was found in the Cell 2 wetland. Caspian Tern and Herring Gull nesting
attempts were not observed.

         Figure 2.A. Colonial Waterbird Nesting Areas, 2019

     Cormorant nests numbered 13,614, including 8,681 ground nests (Figure 2.B). The overall population
     decreased 6% from 2018 as a result of significant flooding from record high Lake Ontario water levels in the
     ground nest colonies. Tree nesting increased 23% and ground nesting population decreased by 17% over the
     previous year. As indicated in Figure 2.B, 64% of the TTP cormorant colony nested on the ground in 2019,
     compared to 72% in 2018. Ground nesting is a target of the Double-crested Cormorant Management Strategy,
     which aims to achieve a balance between a healthy, thriving cormorant colony and the other ecological,
     educational, scientific and recreational values at the park (TRCA, 2008).

                                                       -2-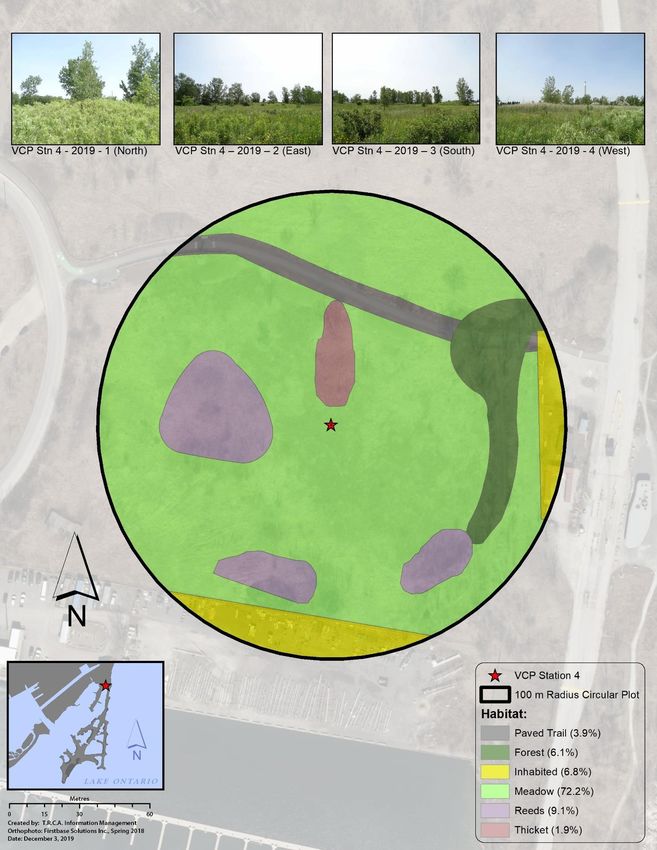
16000
                        Pen A tree
   14000                Pen A ground
                        Pen B tree
   12000
                        Pen B ground
   10000                Pen C tree
                        Total
     8000

     6000

     4000

     2000

           0

       Figure 2.B. Double-crested Cormorant Nests at TTP by Sub-colony, 1998 - 2019

Black-crowned Night-Heron nests numbered 293, a decrease of 2% from the previous year (Table 2.1). Most
night-heron nesting occurred at the base of Peninsula B, where they face less competition from cormorants.

   1400

   1200
                                                                                        Pen B
   1000
                                                                                        Pen C
                                                                                        Total
     800

     600

     400

     200

       0

               Figure 2.C. Black-crowned Night-Heron Nests at TTP by Sub-colony, 1998 - 2019

                                                -3-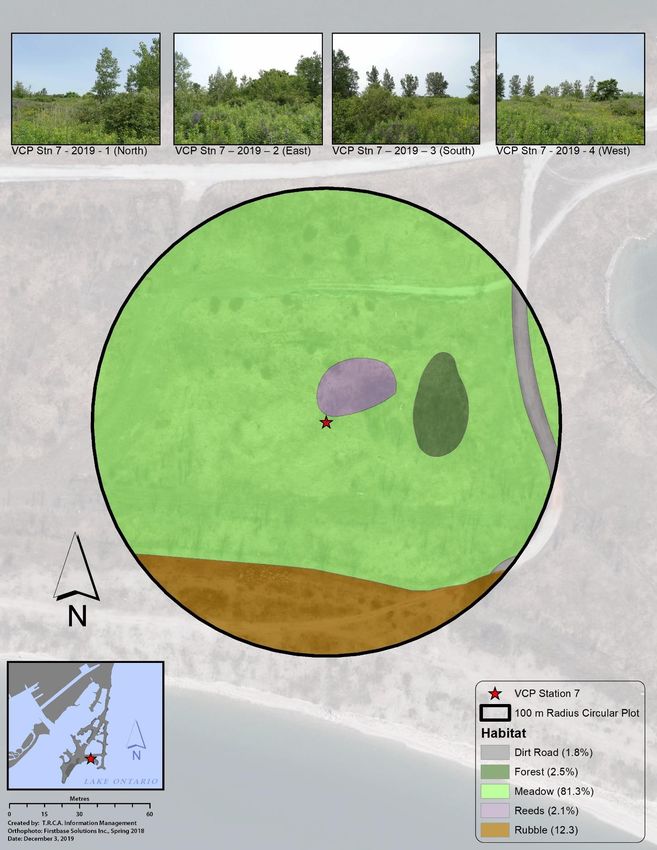
Double-crested Cormorant on Nest (P. Robillard)                   Black-crowned Night-Heron (P. Robillard)

Table 2.1. Colonial Waterbird Nests at TTP, 2009 – 2019

         2009         2010        2011       2012      2013      2014     2015      2016      2017      2018        2019
DCCO     7564         9434        11374      11741    11990     12409     11908    13275     12,841    14,515       13,614
BCNH      617a         431         423        410       297      397       194       335      358        300         293
GREG       7             5           7         8         4          6       6         6        11         5          10
RBGU    30000*       28000*      32000*      32000*   35000*    35000*   35000*    35000*      NC     15,000*        NC
HEGU      NC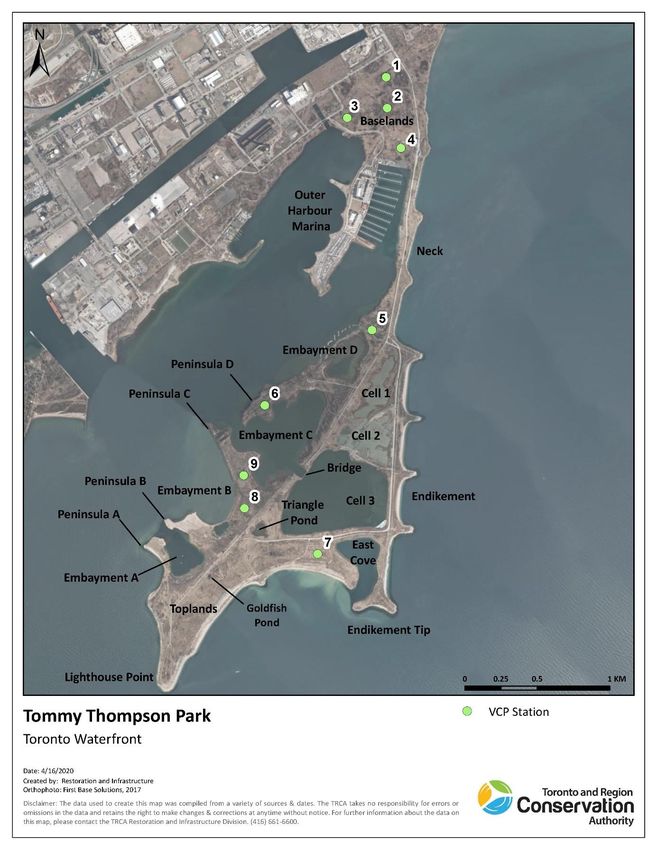
2.2.1 Managed Waterfowl
Canada Geese and Mute Swans regularly nest at TTP and are monitored and managed by TRCA. The Mute
Swan is an introduced species and all nests encountered are managed to eliminate reproduction. Canada
Goose nests are also managed due to the high number of human-wildlife conflicts on the Toronto waterfront.
Management includes egg addling by removal to eliminate or reduce reproduction. This technique mimics
natural predation events, after which the adults typically leave the nest site and forgo nesting until the next
breeding season. In 2019 there were a total of nine Canada Goose nests and one Mute Swan nest at TTP.
3. Landbirds and Non-colonial Waterbirds
3.1 Project Background
Until 2005, comparatively little effort had been put toward TTP’s nesting bird species other than the colonial
waterbirds of the previous section. The project detailed in this section of the report was initiated in 2005 as a
method of monitoring and documenting landbirds and non-colonial waterbirds for the site.
3.1.1 Rationale
The project is organized around monitoring of breeding landbird and non-colonial waterbird density and diversity
in response to habitat succession and restoration. Regular surveys of breeding landbird and non-colonial
waterbird species at TTP provide the following:
Relative abundance data
Detailed and accurate nest records
A measurement of breeding bird abundance and diversity in relation to landscape level change
Assessment of nesting success including parasitism and predation rates
Data that can help steer habitat restoration work
This project is appropriate for TRCA because the labour and material cost is low, and the expertise is both
readily available and able to provide monitoring of avian response to habitat restoration efforts. TRCA
volunteers, with some staff support, have carried out the project annually in spring and summer since 2005.
3.1.2 Change in Data Reporting
Commencing with the 2016 Breeding Bird Report, project data are presented on a rolling 10-year basis. (Data
from earlier years, commencing with 2005, the first year of the project, are available in earlier annual reports.)
3.2 Results in 2019
3.2.1 Variable Circle Plot Point Count Results
3.2.1.1 VCP Station Vegetation Survey
Table 3.1 below depicts the result of the triennial vegetation surveys conducted in 2010 and 2019 for each
station. In addition, Appendix A contains a habitat map and photographs for each station in 2019. (The
habitat maps and photographs from 2010 can be found in the Breeding Bird Reports of 2010 – 2012, those
from 2013 can be found in the reports of 2013 – 2015, and those from 2016 can be found in the reports of
2016 – 2018.) See Appendix F for an explanation of variable circle plot point counts.
As can be seen from Table 3.1, several changes in habitat have occurred over the past nine years. This is
not surprising, however, since most of TTP is intentionally left to naturally succeed on its own. Changes of
note include:
Station 2: The meadow areas observed in 2010 have been completely overtaken by dogwood and willow.
Station 3: Some meadow has been replaced by the Martin Goodman Trail and the link trail.
-5-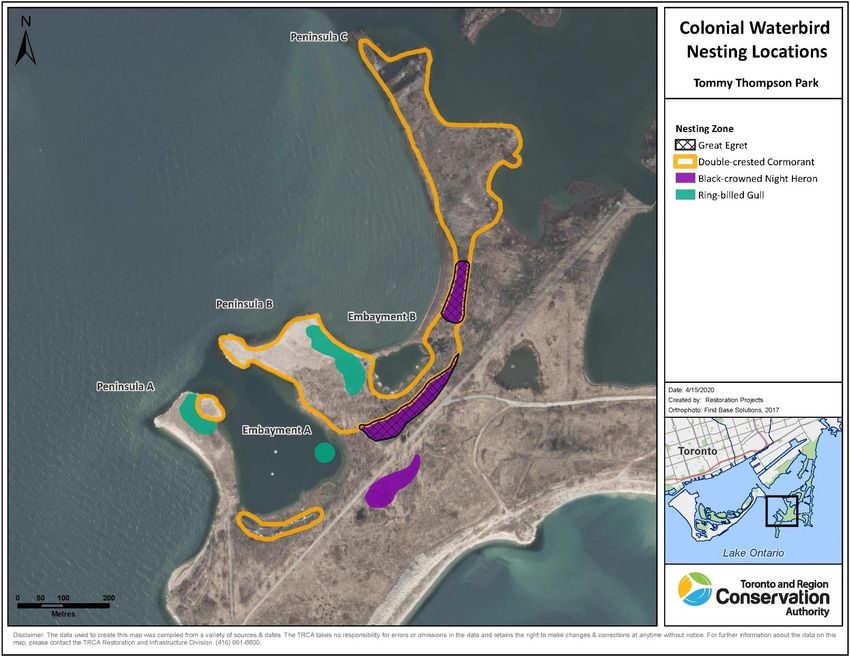
Station 4: A portion of the meadow has been replaced by a wider link trail, as well as forest and thicket
expansion.

Station 5: The area along the shoreline has been largely rebuilt, resulting in less shoreline and water, and
more reeds. The dogwood and forest have also increased significantly.

Figure 3.A          Annotated Map of TommyThompson Park with VCP Stations

                                             -6-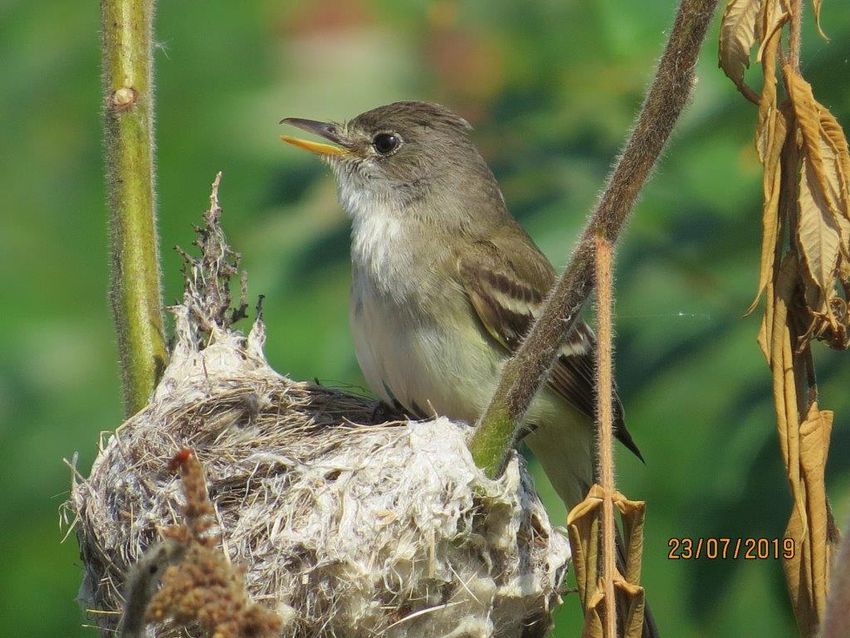
Station 8: Some thicket has been replaced by forest growth and wetland.

      Station 9: Station 9 is located within the previous tree-nesting cormorant colony, and the result of the
      birds’ excrement has been the loss of many trees and other vegetation. As the trees were lost, the tree
      nests largely disappeared within the Station area, and the previously barren soil has started to show signs
      of regeneration.

Table 3.1. 2010 - 2019 VCP Station Vegetation Analysis

                                               2010 OBSERVATIONS
                                                                    VCP Station
                                                  1     2     3     4    5      6          7       8       9
                       % of Major Habitats Within 100 m Radius of Each VCP Station
 Meadow (tree cover ≤ 25%; shrub cover ≤ 25%)        55    40    70     95     10           85       5       5
 Thicket (tree cover ≤ 25%; shrub cover ≥ 25%)       15    20    20            65    20             20      20
 Deciduous Forest (tree cover ≥ 60%)                 25    40     5            10    50             65      60
 Mixed Forest (tree cover ≥ 60%; conifers ≥ 25%)
 Wetland (permanently saturated; water ≤ 2 m)         5
    Vegetation Sub-total (see detail below)         100   100    95     95     85    70     85      90      85
 Sand Dune/Sand Barren (incl active shorelines)                                       5
 Roads/Trails                                                      5     5      5           10
 Lake Ontario Shoreline (open water)                                           10    25      5      10      15
    Non-vegetation Sub-total                                      5      5     15    30     15      10      15
    Total of All Habitats                           100   100   100    100    100   100    100     100     100
                          Dominant Vegetation Within 100 m of Each VCP Station
 Poplars (e.g., Eastern Cottonwood)                  20    35     5      5     10    40        5    55      45
 Dogwoods (e.g., Red-osier Dogwood)                  10    15    10            20    15              5      15
 Honeysuckles                                                                        10
 Shrub Willows                                       10     5     5      5     30     5      5       5
 Grasses and Sedges                                  55    40    65     60     15           45      20      10
 Goldenrods and Asters                                      5    10     20     10           20               5
 Reeds (e.g., Cattails, Bulrushes)                   5                   5                             5
 Miscellaneous Herbs (e.g., Vetch, Nettles, etc.)                                           10              10
    Vegetation Sub-total                            100   100    95     95     85    70     80      90      85
                                               2019 OBSERVATIONS
                                                                    VCP Station
                                                  1     2     3     4    5      6          7       8       9
                       % of Major Habitats Within 100 m Radius of Each VCP Station
 Meadow (tree cover ≤ 25%; shrub cover ≤ 25%)        51          56     72      4     3     81       5      44
 Thicket (tree cover ≤ 25%; shrub cover ≥ 25%)        7    59    22      2     67    23              9      20
 Deciduous Forest (tree cover ≥ 60%)                 22    41     9      6     18    51        3    70      16
 Dead Deciduous Forest                                                                                       1
 Mixed Forest (tree cover ≥ 60%; conifers ≥ 25%)
 Wetland (permanently saturated; water ≤ 2 m)        18                  9      5            2       5
    Vegetation Sub-total (see detail below)          98   100    87     89     94    77     86      89      81
 Sand Dune/Sand Barren (incl active shorelines)                                                      2       3
 Roads, Trails and other man-made areas              2           13     11      4           14
 Lake Ontario Shoreline (open water)                                            2    23              9      16
    Non-vegetation Sub-total                          2          13     11      6    23     14      11      19
    Total of All Habitats                           100   100   100    100    100   100    100     100     100
                          Dominant Vegetation Within 100 m of Each VCP Station
 Trees (e.g., Eastern Cottonwood)                    25    35     5      5     15    40        7    60      10
 Dogwoods (e.g., Red-osier Dogwood)                  18    40    13            50    15              3      20
 Honeysuckles                                                                        12
 Shrub Willows                                              5     5      5     20     5      5       4
 Grasses and Sedges                                  25    20    32     40      4     5     44      15         6
 Goldenrods and Asters                               10           5     30                  10
 Reeds (e.g., Cattails, Bulrushes, Phragmites)       20                  8      5            5         7
 Miscellaneous Herbs (e.g., Vetch, Nettles, etc.)                27      1                  15              45
    Vegetation Sub-total                             98   100    87     89     94    77     86      89      81

                                                    -7-
While some VCP locations have not seen a major change in vegetation over the course of the project, others
have demonstrated significant change. The following photographs demonstrate one station (4) which is an
example of the former and two stations (2 and 9) which are examples of the latter.
The south view at Station 4 (dry meadow) continues to see little change over the life of the project other than
changes in the make-up of the ground cover.
2010 2016 2019
Station 2 (forest – north view) showed significant shrub growth between 2010 and 2016 and has now become
completely surrounded by tall shrubs.
2010 2016 2019
Station 9 (forest – north view) is located within the Double-crested Cormorant colony, and the effect of the
birds’ excrement on both the trees and the ground-level vegetation can be seen in 2016. In 2019, with the trees
and nests almost gone in this view, excrement is no longer a problem, and ground cover is returning.
2010 2016 2019
3.2.1.2 VCP Observations
Analysis of VCP count data presented here is a basic summation of results. More sophisticated analysis will
require the use of analytical software that allows users to estimate the size or density of biological populations.
-8-Table 3.2. VCP Species Lists and Total Birds Detected by Species Within 100 Metres
Species 2010 2011 2012 2013 2014 2015 2016 2017 2018 2019 AVG
ALFL 1 0
AMGO 22 35 8 14 19 7 37 36 19 19 22
AMKE 1 0
AMRE 2 0
AMRO 34 41 40 22 15 25 23 27 26 19 27
AMWO 1 0
BANS 4 14 35 7 22 4 106 7 9 3 21
BAEA * 0
BAOR 13 28 22 26 21 25 15 23 19 9 20
BARS 8 32 31 22 15 55 48 41 68 76 40
BCCH 4 3 1 3 5 7 2 3 3
BEKI 1 1 1 0
BGGN 3 2 3 2 1
BHCO 19 10 17 12 5 3 6 7 3 8
BLJA 1 1 1 1 0
BLPW 1 0
BRTH 1 3 1 1 1
CANG * * 7 3 1
CEDW 19 31 47 17 16 12 18 12 1 12 19
CHSW 2 3 2 2 1 1
CLSW * 1 0
COGR 17 23 8 12 5 17 5 11 14 6 12
COHA 1 0
COYE 2 2 4 1 3 1
DOWO 2 1 1 1 2 1 4 1
EAKI 20 18 12 7 2 9 3 6 8 2 9
EAWP 1 8 6 8 6 9 7 2 2 5
EUST 41 52 39 8 44 9 46 18 18 4 28
GADW 1 16 * 2 * 2 1 2
GBHE * 0
GCFL 1 1 0
GRCA 38 16 21 16 21 12 18 22 18 33 22
HOFI 1 0
HOWR 2 1 1 1 1
KILL 3 2 5 4 5 2 7 2 3
LEFL 11 11 8 10 4 5 1 3 6 7 7
MALL * * 2 5 1 11 2
MODO * 3 1 2 1 1
NOCA 3 1 2 5 3 3 10 21 17 4 7
NOFL 2 2 4 1
NOMO * 1 1 1 0
NRWS 5 14 * 4 * 9 10 5 7 6 6
OROR 1 1 1 2 2 5 1 1
RBNU 1 0
REVI 1 0
RWBL 199 244 295 265 276 247 192 214 316 215 246
SAVS 1 0
SOSP 55 46 50 66 47 51 59 57 102 93 63
SPSA 3 4 2 1 5 7 2 2 1 8 4
TEWA 1 0
TRES 16 24 11 25 30 52 41 54 37 47 34
TRFL 1 2 2 2 1
WAVI 30 39 50 53 46 32 46 27 44 40 41
WIFL 14 25 16 17 20 18 16 27 24 15 19
YEWA 100 168 136 146 166 155 169 181 201 177 160
Birds 685 913 862 783 816 783 898 840 979 830 839
Species 32 30 28 34 37 29 32 38 32 35 33
* Species observed beyond 100 metres and/or flying over
-9-Species recording a new high VCP count for the most recent 10 years were Barn Swallow, Mallard and Spotted Sandpiper. In total, the number of birds recorded in all VCP counts was slightly below the average for the past ten years. Prior to 2015, swallows were recorded differently by different project participants during the VCP counts, with the result that swallow numbers in Table 3.2 are somewhat understated for the years 2010 – 2014. A summary of abundance per species detected by VCP counts (
180
                                                                                                                                      2010
                                           160
                                                                                                                                      2011
                                           140
                   Abundance per Station

                                                                                                                                      2012
                                           120
                                                                                                                                      2013
                                           100
                                                                                                                                      2014
                                            80
                                                                                                                                      2015
                                            60
                                                                                                                                      2016
                                            40
                                                                                                                                      2017
                                            20
                                                                                                                                      2018
                                             0
                                                                                                                                      2019
                                                    Stn 1     Stn 2    Stn 3    Stn 4   Stn 5    Stn 6   Stn 7    Stn 8     Stn 9

 Figure 3.B. Total Bird Abundance per VCP Station

 Species richness, or diversity, is shown in Figure 3.C below. In 2019, Stations 1 (meadow), 2 (thicket) and 6
 (forest) experienced diversity that was significantly lower than the most recent 10-year average, while Station 9
 (mixed) was considerably higher than its average. Stations 1, 2 and 6 have all experienced thicker vegetation
 around the centre of their areas (where the count is taken), which might help to account for the decrease in
 diversity, while the vegetation around Station 9 has become much more bird friendly. The other stations were
 all within about 10% of the 10-year average for the station.

 As with bird abundance, species diversity at Stations 8 and 9 suffers in comparison to the other stations due to
 the dense vegetation and Black-crowned Night-Herons at Station 8 and the lack of biodiversity caused by the
 Double-crested Cormorants at Station 9.

                           25
                                                                                                                                        2010
                           20                                                                                                           2011
                                                                                                                                        2012
  Species per Station

                           15                                                                                                           2013
                                                                                                                                        2014

                           10                                                                                                           2015
                                                                                                                                        2016

                                    5                                                                                                   2017
                                                                                                                                        2018
                                                                                                                                        2019
                                    0
                                                 Stn 1      Stn 2     Stn 3    Stn 4    Stn 5    Stn 6    Stn 7     Stn 8     Stn 9

Figure 3.C. Species Richness per VCP Station

                                                                                        - 11 -
3.2.2 Nest Searching and Monitoring Results
In 2019, eight volunteers contributed a total of 669 hours to the project. This level of participation is a
continuation of recent years’ volunteer experience, which has been a major contributor to the number of nests
which have been found over the past few years. Figure 3.D shows the breakdown of effort per zone. Due
primarily to its lack of suitable habitat, Zone D continues to have the fewest number of nests by far, with the
result that little monitoring time is required in that zone, as is reflected in the lowest level of effort expended.
See Appendix B for a map of the TTP breeding bird survey zones.
200
Zone A
Hours per Zone
150
Zone B
100 Zone C
Zone D
50
Zone E
0 Zone F
2010 2011 2012 2013 2014 2015 2016 2017 2018 2019
Figure 3.D. Nest Searching Effort per Zone from 2010 to 2019 (hours)
The use of standard nest searching data forms, along with greater nest searching and monitoring effort,
combined with experience gained in previous years, have proved to be very successful in increasing the number
of nests found in the most recent years of the project. In 2019, 1,060 nests were discovered, significantly higher
than the most recent 10-year average of 858. Of the total, 736 nests were monitored and reported to Project
Nestwatch (see Tables 3.3 and 3.5).
Willow Flycatcher on Nest (J. Alvo)
- 12 -Table 3.3. Total Nests by Species from 2010 to 2019
Species 2010 2011 2012 2013 2014 2015 2016 2017 2018 2019 AVG
AMGO 33 23 13 17 18 16 23 26 14 13 20
AMRO 69 115 93 93 89 78 113 125 104 122 100
AMWO 3 1 1 1 1 1
BANS 2 1 15 16 1 4
BAOR 10 17 16 15 35 17 18 24 16 13 18
BARS 2 4 11 26 31 24 29 49 51 51 28
BBCU 1 1 0
BCCH 1 2 1 2 2 2 1
BEKI 1 0
BGGN 2 4 6 7 6 4 4 4 4
BRTH 2 2 1 2 2 2 1 1
CANV 1 0
CEDW 14 21 23 19 37 40 49 33 35 18 29
CLSW 24 11 4
COGR 4 4 2 3 2 5 5 1 7 6 4
DOWO 1 1 1 1 1 2 3 1 1
EAKI 14 12 27 21 20 27 24 25 21 14 21
EAME 1 0
EAWP 1 1 1 1 0
EUST 12 4 5 8 4 5 3 1 2 4
GADW 1 3 4 1 2 1 1 1
GRCA 11 16 21 24 34 30 46 33 21 35 27
GWTE 0
HOFI 2 3 1
HOSP 0
HOWR 2 1 1 3 2 1
KILL 13 2 4 3 4 3 4 5 1 4
LEBI 2 0
LEFL 1 3 2 1 1
MALL 12 6 9 8 5 5 8 5 2 6 7
MODO 1 1 1 3 1
NOCA 1 1 1 3 2 4 14 12 5 4
NOFL 3 3 1 1 5 3 2 2
NOMO 2 0
NRWS 1 1 2 2 5 1
OROR 2 1 2 3 2 1 2 1 3 4 2
RWBL 167 232 268 310 361 404 356 464 418 357 334
SOSP 8 2 3 2 8 10 7 4 10 4 6
SPSA 8 4 5 6 3 6 3 5 4 2 5
TRES 9 5 5 12 13 20 20 28 15 18 15
TRUS 1 1 1 1 2 2 1
VIRA 2 0
WAVI 9 15 12 13 31 12 18 21 18 19 17
WIFL 15 12 14 13 18 15 19 18 15 19 16
WODU 1 0
YEWA 82 88 86 127 164 189 237 253 211 320 176
Total 512 595 633 733 902 926 1,018 1,175 1,027 1,060 858
Total Effort (hours) 427 385 397 360 542 538 618 596 676 669 520
Efficiency
1.2 1.54 1.59 2.04 1.67 1.72 1.65 1.97 1.52 1.59 1.65
(nests/hour)
Note: A Trumpeter Swan nest was observed in 2014, but not included in these reports until 2015 when another
nest was observed and reported to NestWatch, The unreported 2014 nest has been included in subsequent
reports for completeness. The Trumpeter Swan is the species of swan native to the Toronto region. Nearly
- 13 -extirpated in the early-mid 1900s, recovery efforts in southern Ontario are seeing success. From 2013 through
2017, there has been one nest annually at TTP, fledging between five and seven cygnets. In 2018 and 2019,
there were two successful nests.
In 2019, as in 2017, Lake Ontario water levels reached record levels, resulting in extreme flooding around the
periphery of TTP, with many areas that are normally dry being covered with up to one metre of water.
Nevertheless, the 1,060 nests located in 2019 represented the second highest total of the project. A possible
partial explanation for 2017 and 2019 realizing the highest number of nests might be that the birds which
normally nest on the periphery were forced to retreat to higher ground and a smaller overall area, making them
easier to locate. Further, the extraordinary water levels in Lake Ontario would have resulted in higher than
normal levels of insects for the birds to eat, which may have encouraged some species to have second (or more)
broods. It will be interesting to see what future water levels will be.
The reasons for the continued high number of nests compared to the early years of the project include: (a)
extensive tree and shrub planting by TRCA over recent years; (b) the natural spreading and maturation of
appropriate breeding habitat in some areas, particularly dogwood, honeysuckle and reeds, which represent the
most common hosts for Red-winged Blackbirds and Yellow Warblers, the most prolific non-colonial-waterbird
nesters at TTP; (c) the ever-increasing nest-searching skills in the project participants; (d) the availability of more
volunteer effort; and (e) the discovery of areas rich in nests that had not been explored until recent years.
Table 3.4 lists those species realizing new nest highs or matching previous highs for the project in 2019.
Table 3.4. Species Reaching New Nest Highs in 2019 or Matching Previous Highs
Increase in Number of Nests
Species
over Previous High
Barn Swallow Matched high of 2018
Black-capped Chickadee Matched high of several years
House Finch 50%
Northern Rough-winged Swallow 150%
Orchard Oriole 33%
Trumpeter Swan Matched high of 2018
Virginia Rail New in 2019
Willow Flycatcher Matched high of 2016
Yellow Warbler 26%
Five species nesting in 2019 deserve special mention.
Virginia Rails nested at TTP for the first time during the
project, although it is known to have nested at TTP
historically. After hearing regular calling from the rails in
the spring, two nests were found, although only one
contained eggs.
Barn Swallows (listed as Threatened in Ontario)
continued to take advantage of the buildings with
appropriate overhangs to match the high nest count
realized in 2018.
After its first nesting of the project in 2018, two House
Finch nests were found in 2019.
Orchard Orioles, who announce themselves with their
distinctive song, continue to build their presence at TTP.
Barn Swallow Nest (L. Freeman) This is another species whose nests can be difficult to
locate.
Yellow Warbler nests exploded in 2019, with the total number being 26% above the previous high and 82%
above the most recent 10-year average.
- 14 -Nest-searching efficiency figures (Table 3.3) can be misleading, as they are highly dependent on an area’s
vegetation (e.g., forest versus shrubland), the species found in the dominant habitat (e.g., shrub nesters versus
high tree nesters) and the time spent on monitoring as opposed to finding nests. The efficiency realized in 2019
was below the 10-year average, but an increase from 2018 as new volunteers gain experience.
3.2.2.1 Changes in Nest Density for Each Zone
ZONE
NESTS PER HECTARE
A
B
C
D
E
F
2010 2011 2012 2013 2014 2015 2016 2017 2018 2019
Figure 3.E Nest Density by Zone
In Figure 3.E, the nest density for each zone is determined by the number of nests per hectare. (In this chart,
the number of hectares for Zone F has been reduced to eliminate the area occupied by the colonial
waterbirds.) A map of the zones can be found in Appendix B.
• With the exception of Zone D, the nest density has increased in each zone over the most recent 10
years. This can be attributed to the same reasons given in the previous section for the increase in
overall nest numbers in the last few years.
• There is, of course, a spike in nest density in 2017, which reflects the high number of nests found that
year. It is interesting, however, that there was no spike in Zones B and D.
• Zones A and E have shown the greatest increase in nest density over the past 10 years, probably
primarily because of the increase in nest-friendly shrubs in these zones. As they are the two largest
zones, they have therefore contributed significantly to the overall increase in nest totals.
• Zone B, the smallest zone, levelled off after 2014 and had the highest nest density until 2017.
Possible reasons for this and the lack of a spike in 2017 include (i) storm damage on the eastern side
of the Neck, (ii) habitat rehabilitation on the western side of the Neck, and (iii) the shrubs in a major
section becoming so dense in recent years as to restrict nesting opportunities.
• Zone D has shown little or no growth in nest density over the 10 years, and this and the lack of a spike
in 2017 would have been due to (i) the considerable construction on the Endikement and in Cell 2 in
recent years, and (ii) the lack of trees and shrubs in this zone, which means fewer nesting options and
also less protection for the other vegetation.
• Starting in 2016, all the zones apart from Zone D appear to be have settled at a nest density range of 5
– 7 nests per hectare. It will be interesting to see whether this rate holds in future years as the
vegetation continues to evolve.
- 15 -3.2.2.2 Nest Productivity
In 2019, 736 nests were recorded online with Project NestWatch (Table 3.5). In terms of nest productivity, of
the 493 nests which had known outcomes, 111 (or 23%) failed, while 382 (or 77%) were successful in fledging
young. The remaining 243 nests which were monitored and reported to NestWatch, but had unknown
outcomes, represented 33% of the nests reported to NestWatch. (The nests with unknown outcomes included
all ground nests from Canvasback, Gadwall, Killdeer, Mallard, Song Sparrow and Spotted Sandpiper, which,
commencing in 2012, were not monitored once found.)
As can be seen in Table 3.5, the 2019 nest failure rate of 23% is the highest since 2015, although still below
the latest 10-year average. Of the 111 failures, 32 occurred at the egg stage, six at the young stage and 73 at
either the egg or the young stage.
Table 3.5. Nest Productivity from 2010 to 2019
2010 2011 2012 2013 2014 2015 2016 2017 2018 2019 AVG
Nests discovered 512 595 633 733 902 926 1,018 1,175 1,027 1,060 858
Nests monitored &
440 430 464 549 690 657 702 801 663 736 613
reported to NestWatch
• Unknown outcome 213 155 213 266 232 226 211 301 244 243 230
• Known outcome 227 275 251 283 458 431 491 500 421 493 383
➢ Successful 144 177 171 186 338 323 388 394 335 382 284
➢ Failed 83 98 80 97 120 108 103 106 86 111 99
➢ Failure rate 37% 36% 32% 34% 26% 25% 21% 21% 20% 23% 26%
Figure 3.F demonstrates how the known nest failure rate continues to trend lower, notwithstanding that the rate
in 2019 was the highest of the last four years. However, the rate has been relatively constant at about 20% for
the last four years, which could indicate that lower rates are unlikely in future.
50
Nest Failure Rate
40
30
20
10
0
2004 2006 2008 2010 2012 2014 2016 2018 2020
Year
Figure 3.F Known Nest Failure Rate Trend
3.2.2.3 Nest Predation in 2019
Nest predation continues to be the most common cause of nest failure. Possible predators at TTP, in addition
to other bird species, include raccoons, gartersnakes, mink, coyotes and, rarely, squirrels. Of the 111 failed
nests noted in Table 3.5, a total of 74 nests were predated, representing 15% of nests with a known outcome.
Nine species had at least one nest predated in 2019, with the most common being Yellow Warbler at 22% of
nests with a known outcome, Willow Flycatcher at 21%, Red-winged Blackbird at 19% and American Robin at
15%.
- 16 -3.2.2.4 Species Detected During the Breeding Season from all Studies
As can be seen in Table 3.6, the 40 confirmed breeders are exactly the same as the 10-year average, while
the 79 total species detected in 2019 are highest of the last 10 years.
The first section of Table 3.6 provides a breakdown of the 40 confirmed breeders in 2019. Nests of 29 species
of landbirds, including Brown-headed Cowbird, were found in 2019. To this were added four other species
confirmed as breeders by the presence of recently fledged young or adults carrying food: Downy Woodpecker,
European Starling, Killdeer and Wood Duck. When the five confirmed colonial waterbird nesters (i.e., Black-
crowned Night-Heron, Common Tern, Double-crested Cormorant, Great Egret and Ring-billed Gull), as well as
Canada Goose and Mute Swan, are added, the total becomes 40 species nesting at TTP in 2019.
Table 3.6. Summary of Species Detected During Breeding Season from All Studies
2010 2011 2012 2013 2014 2015 2016 2017 2018 2019 AVG
Breeding Species:
Colonial Waterbirds 6 6 7 7 7 5 7 5 6 5 6
Managed Waterfowl 2 2 2 2 2 2 2 2 2 2 2
Sub-total 8 8 9 9 9 7 9 7 8 7 8
Landbirds 31 28 29 26 32 29 30 33 33 29 30
Nests confirmed by young 1 0 2 5 2 3 0 1 3 4 2
Sub-total 32 28 31 31 34 32 30 34 36 33 32
Confirmed Breeding Species
40 36 40 40 43 39 39 41 44 40 40
(total of above)
Probable Breeding Species 2 4 3 5 5 3 4 3 2 6 4
Possible Breeding Species 8 3 6 4 8 14 11 8 5 4 7
Other Species Observed 11 14 17 11 8 15 12 17 20 29 15
Total Species Detected 61 57 66 60 64 71 66 69 71 79 66
Looking at the past 10 years of data, some conclusions and trends continue to emerge. As noted previously,
Bobolink, Eastern Meadowlark and Savannah Sparrow have virtually disappeared from both the VCP counts
and confirmed nests, although there has actually never been a confirmed Bobolink nest at TTP. Herbaceous
vegetation at TTP is becoming denser, which has an adverse effect on nesting suitability for these and other
ground-nesting species. At the same time, the spread of dogwood, honeysuckle and reeds, as well as tree and
shrub planting by TRCA, has created more nesting opportunities for species such as Red-winged Blackbirds,
American Robins and Yellow Warblers.
3.2.2.5 Gray Catbird Recycling a Red-winged Blackbird Nest
An unusual nest was located at TTP in 2019 – a Red-
winged Blackbird nest containing Gray Catbird eggs. This
is the second such discovery during the project. Mark Peck
of the Royal Ontario Museum reported that “we don't have
any record here of a catbird using another species nest but
I did check Birds of North America online and it turns out
they have reports of catbirds taking over a Northern
Cardinal nest and a Brown Thrasher nest”. (pers. comm.)
Cardinal and thrasher nests are similar to catbird nests in
that all three make considerable use of small twigs, but the
Red-winged Blackbird nest is quite different, relying on
leaves and stems with a deeper cup.
An Example of Nest Recycling – Gray Catbird Eggs in a Red-winged
Blackbird Nest (D. Johnston)
- 17 -3.2.2.6 Parasitism by Brown-headed Cowbirds
Brown-headed Cowbird parasitism is a major issue for small landbird populations in more open habitats and
forest fragments. In 2019, a total of 19 nests of three species were parasitized by Brown-headed Cowbirds
(Table 3.7). (For purposes of this report, a nest was considered parasitized if a cowbird egg was observed,
regardless of what happened to that egg.) The parasitism rates in Table 3.7 were calculated as the ratio of
parasitized nests to the total parasitized and non-parasitized nests. (Note that nests of parasitized species
were not included in this table unless evidence of parasitism, or lack thereof, could be confirmed.)
Table 3.7. Brown-headed Cowbird Parasitism Data and Rates from 2010 to 2019.
Brown-headed Cowbird Parasitism
Red-
American American Gray House Northern Song Willow Yellow
winged Totals
Goldfinch Robin Catbird Finch Cardinal Sparrow Flycatcher Warbler
Blackbird
Nests checked* 19 28 11 0 1 110 4 11 66 250
2010
No. parasitized 0 0 0 0 0 27 1 2 21 51
% parasitized 0% 0% 0% 0% 0% 25% 25% 18% 32% 20%
Nests checked* 13 26 16 0 0 81 2 11 36 185
2011
No. parasitized 2 0 0 0 0 18 0 0 10 30
% parasitized 15% 0% 0% 0% 0% 22% 0% 0% 28% 16%
Nests checked* 8 17 19 0 1 77 2 8 33 165
2012
No. parasitized 0 0 0 0 0 30 0 2 7 39
% parasitized 0% 0% 0% 0% 0% 39% 0% 25% 21% 24%
Nests checked* 9 26 20 0 1 145 2 11 75 289
2013
No. parasitized 1 1 0 0 0 33 0 1 22 58
% parasitized 11% 4% 0% 0% 0% 23% 0% 9% 29% 20%
Nests checked* 10 27 27 0 3 134 6 13 96 316
2014
No. parasitized 0 0 0 0 0 22 0 2 11 35
% parasitized 0% 0% 0% 0% 0% 16% 0% 15% 11% 11%
Nests checked* 5 18 21 0 2 181 7 7 82 323
2015
No. parasitized 0 0 1 0 0 27 1 0 8 37
% parasitized 0% 0% 5% 0% 0% 15% 14% 0% 10% 11%
Nests checked* 7 38 18 0 4 133 3 12 123 338
2016
No. parasitized 0 0 1 0 0 26 0 1 28 56
% parasitized 0% 0% 6% 0% 0% 20% 0% 8% 23% 17%
Nests checked* 12 45 20 0 7 182 4 12 128 410
2017
No. parasitized 1 0 0 0 1 24 1 1 12 40
% parasitized 8% 0% 0% 0% 14% 13% 25% 8% 9% 10%
Nests checked* 6 34 10 2 6 153 6 9 73 299
2018
No. parasitized 0 0 0 1 1 14 3 0 10 29
% parasitized 0% 0% 0% 50% 17% 9% 50% 0% 14% 10%
Nests checked* 5 38 17 1 4 135 3 13 135 351
2019
No. parasitized 0 0 0 0 0 14 0 1 4 19
% parasitized 0% 0% 0% 0% 0% 10% 0% 8% 3% 5%
Avg nests
checked * 9.4 29.7 17.9 0.3 2.9 133.1 3.9 10.7 84.7 292.6
AVG
Avg parasitized 0.4 0.1 0.2 0.1 0.2 23.5 0.6 1 13.3 39.4
Avg %
parasitized 4.3% 0.3% 1.1% 33.3% 6.9% 17.7% 15.4% 9.3% 15.7% 13.5%
* Nests checked includes only those nests where parasitism could be observed and/or monitored; therefore
not all nests on site are included in this total
- 18 -The overall rate of parasitism in 2019 of 5% was the lowest
rate experienced during this project. Yellow Warblers, the
second most heavily parasitized species at TTP in terms of
total number of nests parasitized, reached its lowest rate of
parasitism at 3% in 2019.
Based on the average rate of parasitism over the past 10
years, Red-winged Blackbirds and Yellow Warblers
continue to be the most heavily parasitized species,
although the rate of parasitism for 2017 - 2019 clearly
shows a trend to lower rates (see Table 3.7). (House Finch
shows a higher average rate, but this is based on only three
nests.)
The overall parasitism rate in 2019 of 5% continued the 10-
Brown-headed Cowbird Egg (the large egg) year downward trend, as demonstrated in Figure 3.G. In
in Willow Flycatcher Nest (D. Johnston) line with this, there was a complete absence of cowbirds
observed in the VCP counts of 2019, continuing the downtrend trend which started in 2014. As mentioned in
earlier reports, possible explanations for this downward trend include (i) a reduction in the cowbirds’ preferred
foraging habitat at TTP due to the increase in tall herbaceous vegetation, and (ii) an overall decline in cowbird
populations in Ontario, with the exception of the Carolinian region, as noted in the Atlas of the Breeding Birds
of Ontario, 2001-2005 (p. 602).
40
Brown-headed Cowbird
30
Parasitism Rate
20
10
0
2005 2010 2015 2020
Year
Figure 3.G Brown-headed Cowbird Parasitism Rate Trend
It should be noted that Table 3.7 above includes only the nine species where at least one instance of
parasitism has been observed during the project. While it is not possible to monitor for parasitism in nests
which are too high, no evidence of parasitism was confirmed for 12 additional species which represented a
total of 82 nests.
3.3 The Overall Picture in 2019
The most valuable aspect of this project will be its ability to reveal changes in breeding bird abundance and diversity
over time at TTP. Breeding avifauna will respond to changes in habitat distribution, composition and structure due to
natural succession and habitat creation. Although the most recent years have seen a few unexpected nests (e.g.,
Least Bittern, Virginia Rail), the breeding bird communities (i.e., non-colonial waterbirds and landbirds) are largely
typical of early successional environments. Dominant species in the past 10 years of VCP counts include Red-
winged Blackbird, Yellow Warbler, Song Sparrow and European Starling, all of which require basic habitat
conditions with a few fundamental components to thrive.
Commencing in 2014, the top three landbird nesters, Red-winged Blackbird, Yellow Warbler and American Robin,
have respectively represented approximately 40%, 20% and 10% of the total nests each year. There have naturally
been years when the percentage for one or more of the three has varied somewhat, such as Yellow Warbler in
2019, but overall these percentages have remained remarkably consistent. It will be interesting to see if 2019 was
an anomaly for Yellow Warblers, or whether this species is about to establish a new level of nesting density.
- 19 -With the addition of Virginia Rail in 2019, there have been 49 nesters confirmed since the current project
commenced. This total includes the 46 species listed in Table 3.3, plus Brown-headed Cowbird, Canada Goose
and Mute Swan, with the latter two species not being monitored as part of the project. In addition, the seven
colonial waterbirds described in Section 2 of this report have also been confirmed as nesters: Black-crowned Night-
Heron, Caspian Tern, Common Tern, Double-crested Cormorant, Great Egret, Herring Gull and Ring-billed Gull.
When all species and historical records are included, there are now 71 species confirmed to have bred at Tommy
Thompson Park. Some rare and isolated breeding records are unlikely to recur with any regularity, if at all, (e.g.,
Wilson’s Phalarope). A complete historical breeding bird species list is presented in Appendix C, Species Accounts.
Current habitat conditions remain appropriate for nesting by some additional species, so it is anticipated that the list
of known breeding species may well continue to grow. Natural change, along with the habitat creation and
restoration projects carried out by TRCA throughout TTP, such as the changes to Cell 2 to create a new marsh
similar to Cell 1 (which are now largely complete), are also expected to increase the variety of habitats suitable for
species not yet on the confirmed breeders list.
It is always interesting to note the species detected during VCP counts, but for which no nest was confirmed, versus
those species not detected during VCP counts, but for which a nest was confirmed (Table 3.8). A variety of reasons
exist to explain why a species could be recorded by one method, but not the other: (i) low abundance at TTP (e.g.,
Trumpeter Swan), (ii) secretive habits (e.g., Black-billed Cuckoo), (iii) well-hidden nests (e.g., Least Flycatcher), (iv)
nests or normal habitat not located near VCP stations, and (v) nests not normally located at TTP (e.g., Blue Jay).
Table 3.8 Species Recorded Only by VCP Counts Versus Species Recorded Only By Nest
VCP-recorded Species With No Nest Confirmed Species With Nest But Not Recorded During VCP
American Redstart Black-capped Chickadee
Belted Kingfisher Blue-gray Gnatcatcher
Blue Jay Brown-headed Cowbird
Blackpoll Warbler House Finch
Brown Thrasher House Wren
Common Yellowthroat Northern Flicker
Gadwall Trumpeter Swan
Least Flycatcher Virginia Rail
4. Acknowledgements
The colonial waterbird data were collected and presented by TRCA staff, who also produced all of the maps in the
report and provided valuable assistance in editing this report.
The landbird and non-colonial waterbird section of this report is the result of the ongoing efforts of several dedicated
volunteers. The 2019 VCP observations were collected by Don Johnston and Ian Sturdee, and the volunteer
contributions to the nest searching phase of the project in 2019 are enumerated in Table 3.9.
Table 3.9 2019 Effort by Nest Searching Project Participants
Name Total Hours
Jack Alvo 95
Marc Dupuis-Desormeaux 4
Lynne Freeman 52
Don Johnston 105
Jan McDonald 64
Pierre Robillard 96
Ian Sturdee 135
Paul Xamin 118
Total 669
- 20 -References
Baicich, Paul J. and Harrison, Colin J. O. 2005. Nests, Eggs, and Nestlings of North American Birds. Princeton
University Press, Princeton, 347 pp.
Cadman, M.D., D.A. Sutherland, G.G. Beck, D. Lepage and A.R. Couturier (eds.). 2007. Atlas of the Breeding Birds of
Ontario, 2001-2005. Bird Studies Canada, Environment Canada, Ontario Field Ornithologists, Ontario Ministry of
Natural Resources, and Ontario Nature, Toronto, xx11 + 706 pp.
Canadian Wildlife Service. Herring Gull monitoring. Unpublished raw data.
Dupuis-Desormeaux, Marc et al. First record of Least Bittern nesting at Tommy Thompson Park in Toronto, Ontario.
Ontario Birds Volume 35 Number 3 December 2019 pp 146 – 150
Harrison, Hal H. A Field Guide to the Birds’ Nests - United States East of the Mississippi River. Houghton Mifflin
Company Boston New York, 1975, 257 pp (The Peterson Field Guide Series)
Jarvie, S., H. Blokpoel, and T. Chipperfield. 1999. A geographic information system to monitor nest distributions of
Double-crested Cormorants and Black-crowned Night-Herons at shared colony sites near Toronto, Canada. Pages
121-129 In Symposium on Double-crested Cormorants: Population Status and Management Issues in the Midwest
(M.E. Tobin, ed.). USDA Tech. Bull. No. 1879. 164pp.
Metropolitan Toronto and Region Conservation Authority. 1982. Environmentally Significant Areas Study (ESA No.
120, Tommy Thompson Park). MTRCA.
Metropolitan Toronto and Region Conservation Authority. 1994. Environmentally Significant Areas Study Update.
MTRCA.
Metropolitan Toronto and Region Conservation Authority. 1996. Reefrafts for Common Terns and Fish: Guidelines for
Design, Construction and Operation. Environment Canada.
Peck, G.K, M. K. Peck, & C. M. Francis. 2001. Ontario Nest Records Scheme Handbook. ONRS. Toronto, Ontario.
Toronto and Region Conservation Authority. 2008. Double-crested Cormorant Management Strategy, May 2008.
Authority Meeting Recommendation #110/08.
Toronto and Region Conservation Authority. 2006. The Breeding Birds of Tommy Thompson Park Project.
Toronto and Region Conservation Authority. 2006. The Breeding Birds of Tommy Thompson Park 2006.
Toronto and Region Conservation Authority. 2008. The Breeding Birds of Tommy Thompson Park 2007.
Toronto and Region Conservation Authority. 2010. The Breeding Birds of Tommy Thompson Park 2008.
Toronto and Region Conservation Authority. 2010. The Breeding Birds of Tommy Thompson Park 2009.
Toronto and Region Conservation Authority. 2011. The Breeding Birds of Tommy Thompson Park 2010.
Toronto and Region Conservation Authority. 2011. The Breeding Birds of Tommy Thompson Park 2011.
Toronto and Region Conservation Authority. 2012. The Breeding Birds of Tommy Thompson Park 2012.
Toronto and Region Conservation Authority. 2014. The Breeding Birds of Tommy Thompson Park 2013.
Toronto and Region Conservation Authority. 2015. The Breeding Birds of Tommy Thompson Park 2014.
Toronto and Region Conservation Authority. 2016. The Breeding Birds of Tommy Thompson Park 2015.
Toronto and Region Conservation Authority. 2017. The Breeding Birds of Tommy Thompson Park 2016.
Toronto and Region Conservation Authority. 2018. The Breeding Birds of Tommy Thompson Park 2017.
- 21 -Toronto and Region Conservation Authority. 2019. The Breeding Birds of Tommy Thompson Park 2018.
Wilson, W.G., E.D. Cheskey and IBA Steering Committee. 2001. Leslie Street Spit - Tommy Thompson Park
Important Bird Area Conservation Plan. Canadian Nature Federation, Bird Studies Canada, Federation of Ontario
Naturalists.
- 22 -Appendices
- 23 -Appendix A: Description of VCP Stations (Habitat Pictures and Maps)
Station 1
- 24 -Appendix A: Description of VCP Stations (Habitat Pictures and Maps)
Station 2
- 25 -Appendix A: Description of VCP Stations (Habitat Pictures and Maps)
Station 3
- 26 -Appendix A: Description of VCP Stations (Habitat Pictures and Maps)
Station 4
- 27 -Appendix A: Description of VCP Stations (Habitat Pictures and Maps)
Station 5
- 28 -Appendix A: Description of VCP Stations (Habitat Pictures and Maps)
Station 6
- 29 -Appendix A: Description of VCP Stations (Habitat Pictures and Maps)
Station 7
- 30 -Appendix A: Description of VCP Stations (Habitat Pictures and Maps)
Station 8
- 31 -Appendix A: Description of VCP Stations (Habitat Pictures and Maps)
Station 9
- 32 -Appendix B: Map of TTP Breeding Bird Survey Zones
This map was updated in 2015 to reflect a minor change in zone alignment; changes in the TTP land base due
to lake-filling activities; and mapping tool refinements. This has resulted in area increases to every zone except
Zone B and an overall area increase of 11.5%. The land base at TTP is expected to continue to change as
habitat creation and enhancement work continues.
- 33 -Appendix C: Species Accounts
The following accounts include species that were listed as observed during the breeding season, or as possible,
probable or confirmed breeders in 2019, as well as historically confirmed breeders. Species highlighted in red were
detected in 2019 during the breeding bird survey, but they have not yet been classified as confirmed breeders at
Tommy Thompson Park. Species observed, but clearly out of their breeding range (shorebirds, e.g.) are not
included here. For TTP locations specified in the following section, please consult Figure 3.A, an annotated map of
the park.
Alder Flycatcher (2019 - observed) This species has never been confirmed as a breeder at TTP. The birds
observed at various points in TTP were presumably late migrants.
American Black Duck (2019 - absent) Known to have bred historically at TTP.
American Crow (2019 - absent) Known to have bred historically at TTP, but not in recent years.
American Goldfinch (2019 - confirmed) This species is a regular late nester at TTP. In 2019, 13 nests were
discovered, which is well below the most recent 10-year average.
American Kestrel (2019 – absent) Known to have bred historically at TTP.
American Redstart (2019 - probable) This species has never been confirmed as a breeder at TTP. Singing
males have been present throughout the breeding season in most recent years, and in 2019, a pair was observed
demonstrating agitated behavior which could indicate the presence of a nest.
American Robin (2019 - confirmed) Common nesting species in forested areas throughout TTP. In 2019, 122
nests were recorded, well above the most recent 10-year average.
American Woodcock (2019 - probable) This species is found regularly throughout much of TTP during the
spring and summer. In 2019, birds were discovered displaying in several apparent territories at TTP and a pair was
observed. The 2012 change in protocol with regard to ground-nesting birds makes locating nests much less likely.
Baltimore Oriole (2019 - confirmed) Common nesting species in forest areas of TTP. A total of 13 nests was
recorded in 2019, below the average of the past 10 years of this project.
Bank Swallow (2019 - confirmed) In 2019, nesting was confirmed by the presence of recently fledged young.
Barn Swallow (2019 - confirmed) Barn Swallows are regular nesters at TTP under the eaves of buildings. In
2019, 51 nests were found, matching the high for the project which was achieved in 2018. This species, listed as
Threatened on the Ontario Species at Risk, continues to take advantage of buildings constructed by TRCA in
2011/2012.
Bay-breasted Warbler (2019 - observed) This species has never been confirmed as a breeder at TTP. The
birds observed at various points in TTP were presumably late migrants.
Belted Kingfisher (2019 - possible) This species was confirmed for the first time in 2003 based on
observations of fledged young. In 2019, a bird was observed twice in suitable nesting habitat during the breeding
season.
Black-capped Chickadee (2019 - confirmed) A regular but uncommon nester at TTP. Two nests were found
in 2019.
Black-crowned Night-Heron (2019 - confirmed) 293 nets were confirmed in 2019, which is 15% lower than
the most recent 10-year average, but consistent with the last several years. At their peak in 2000, an estimated
30% of the Canada-wide population of Black-crowned Night-Herons were breeding at TTP.
- 34 -You can also read