The detection of oil layers on metal surfaces: comparing the measurement procedures
←
→
Page content transcription
If your browser does not render page correctly, please read the page content below
Press information from Sensor Instruments
January 2021

The detection of oil layers on metal surfaces:
comparing the measurement procedures
21/01/2021. Sensor Instruments GmbH: The use of oils is imperative in the forming process of
metals. For example, the application of cutting oils to metal bands ensures low wear on the punching
tools. Drilling oils make an essential contribution to the protection of the drilling and milling tools
during chipping processes. Oils also serve to protect semi‐products such as sheets and metal foils
against corrosion. After further processing, it is important to remove the oil residues from the
finished products as completely as possible. This task is performed by special cleaning systems, in
which the metal parts are washed and blown dry.

                                        In order to ensure that environmental specifications are
                                        maintained during the application of the oils, and to ensure
                                        that the process is economical, it is advisable to ascertain the
                                        quantity of the oil applied. Oil quantity measurement can be
                                        performed INLINE. A number of measurement procedures
                                        are available to this end and which constitute the focus here.
                                        The cleaning process can be monitored using the same
                                        sensors. The challenge is to determine even small quantities
                                        of oil residue accurately, preferably INLINE. Electrically
                                        conducting components such as copper busbars or power
                                        current lines require the lowest possible transfer resistance.
                                        A residual oil layer would pose a problem as this restricts the
                                        conductive efficiency to a considerable degree.

How have we performed monitoring up to now?
When measuring oil layers, we usually first think of a certain layer thickness, for example measured
in µm. A common method is to ascertain the grammage of the oil film. This requires knowledge of
the weight of the entire component. Precise scales and an identical non‐oiled component are
required to ascertain the difference in weight. To determine the layer thickness from the grammage
requires information about the concentration of the respective oil and the surface of the respective
component. The large difference in weight between the actual oil layer and the weight of the
component is not conducive to exact determination of the oil layer thickness. A further source of
error is the difference in weight between components in their unoiled state.

                                       EN_PI_2021-01-21_SI_The detection of oil layers on metal surfaces.docx 1/19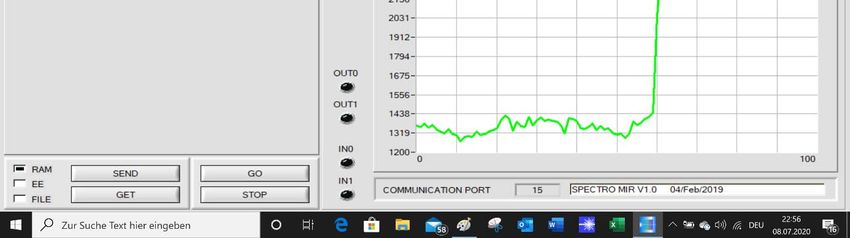
The lack of simple methods for measuring the layer thickness directly could explain the increasing
popularity of the method for determining the surface tension of parts. The presence of a thin oil
layer on a metal surface reduces the surface tension from more than 50mN/m in non‐covered state
to under 40mN/m in an oiled state (depending on the layer thickness and the oil type). Test inks
covering a range from 30mN/m to 50mN/m in two‐interval steps (30mN/m, 32mN/m, 34mN/m, …)
serve to prove the respective surface tension. The test ink is brushed onto the area to be investigated
using the brush included in the scope of delivery of the bottles. If the test ink rolls off of the surface,
the next lower test ink will be applied in the same fashion until the test ink adheres to the surface
over a longer period and does not run off. The surface tension lies between the two test inks last
used. It can be observed that reduction in the surface tension is associated with increase in the
thickness of the oil layer.

                                                             The test ink rolls from the oil‐covered
                                                             metal surface, which indicates a surface
                                                             tension which is smaller than the value
                                                             specified on the test ink.

                                                             In this diagram, the test ink adheres to the
                                                             oil‐covered or degreased metal surface.
                                                             The surface tension of the metal surface is
                                                             higher than the value specified for the test
                                                             ink.

                                         EN_PI_2021-01-21_SI_The detection of oil layers on metal surfaces.docx 2/19
The three measurement procedures
   Measurement procedure 1:
   Absorption of UVC radiation (265nm central wavelength range) by the oil layer

   A fiber optic sensor (SPECTRO‐1‐FIO‐UVC/UVC) is used in reflected light operation. A UV‐LED with a
   central wavelength range of 265nm serves as a light source. A quartz optical fiber (R‐S‐A3.0‐(3.0)‐
   1200‐22°‐UV) directs the UVC light to the section of the metal surface to be measured, which reflects
   it, partially diffusely and partially directly. A part of the reflected radiation is directed towards the
   detector integrated in the sensor using the reflex fiber optic bundle. A degreased metal surface to
   which no oil has been applied (should be the same material and present an identical surface
   structure as with the subsequent measurements) serves as a reference. If an oil layer is between the
   surface of the face of the optical fiber and the metal surface, it will absorb a part of the UVC light
   during both incidence and return. A signal decrease can be measured on the detector side. If the
   sensors are used for INLINE measurement, we recommend a working distance of c. 5 mm between
   the surface of the face of the optical fiber and the metal surface. The beam divergence lies at 22° and
   the light spot assumes a diameter of some 5 mm on the metal surface to be investigated. With
   OFFLINE measurements, a spacer (A3.0‐OFL) is also used, which can be attached to the head of the
   optical fiber.

                                                                                  R‐S‐A3.0‐(3.0)‐1200‐22°‐UV

SPECTRO‐1‐FIO‐(UVC/UVC)

                                                                                   A3.0‐OFL
               R‐S‐A3.0‐(3.0)‐1200‐22°‐UV + A3.0‐OFL

                                           EN_PI_2021-01-21_SI_The detection of oil layers on metal surfaces.docx 3/19
Measurement procedure 2:
Stimulation of an oil layer for fluorescence in the visible wavelength range using UVA light (365nm
central wavelength range)

To this end, a color sensor (SPECTRO‐3‐30‐UV/BL‐
MSM‐ANA) is used; its transmitter unit consists of
UV‐LEDs (365nm central wavelength range). When
conducting INLINE measurements, we recommend
a working distance of 15mm. The spacer (SPECTRO‐
3‐15‐d65‐OFL) can also be used OFFLINE (the
distance between the sensor and object also
amounts to 15mm). The detection range assumes a
diameter of c. 12 mm with this clearance.

The UV‐LEDs are arranged in a ring formation; a receiver part is located in the center of the sensors,
which uses upstream optical filters to detect in the visible wavelength range, whilst UV light is
blocked. With this measurement method, it should be taken into account that the intensity of the
measured fluorescence also depends on the metal surface, as this serves as a reflector. Calibration to
the respective surface or the respective object form is mandatory.

                                       EN_PI_2021-01-21_SI_The detection of oil layers on metal surfaces.docx 4/19
Measuring procedure 3:
Absorption of MIR light (3µm central wavelength range) by an oil layer
A wide‐band MIR light source covering a wavelength
range from c. 2µm to 6µm was used as a light source. A
standardized signal evaluation is performed using two
receivers fitted with different optical filters. Receiver 1
operates in a narrow wavelength range with a central
wavelength range of c. 3µm, whilst receiver 2 also works
in a narrow wavelength range and is fitted with a central
wavelength range of c. 4µm. Receiver 2 functions as a
reference, as its wavelength range is not observably
influenced by the oil layer in comparison to the
wavelength range of receiver 1. Equal reflection in both
wavelength ranges was issued from the metal surface. A
standardized evaluation of the two measurement signals
provides information about the absorption of the oil
layer; the result is largely independent of the metal
surface present. The measuring distance between the
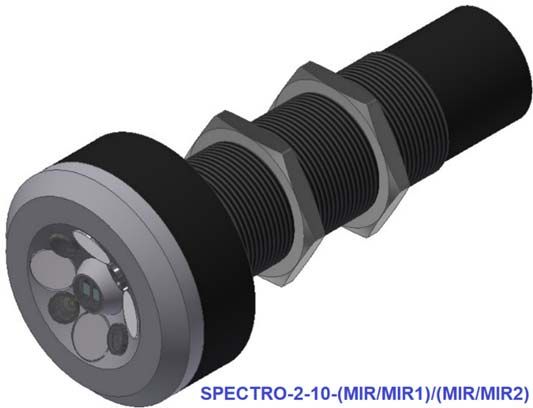
sensors (SPECTRO‐M‐10‐MIR/(MIR1+MIR2)) and the
metal surface during INLINE measurement amounts to
10mm; the detection range is 10mm in diameter.
Restriction of the measurement resulting from ambient
light (white light LED interior lighting) could not be
determined and a high measurement frequency (> 1 kHz)
can be used. A spacer (SPECTRO‐M‐30‐OFL) is available
for OFFLINE measurement, which also ensures a
measurement clearance to the metal surface of 10mm.
SPECTRO‐M‐10‐MIR/(MIR1+MIR2) SPECTRO‐M‐30‐OFL
EN_PI_2021-01-21_SI_The detection of oil layers on metal surfaces.docx 5/19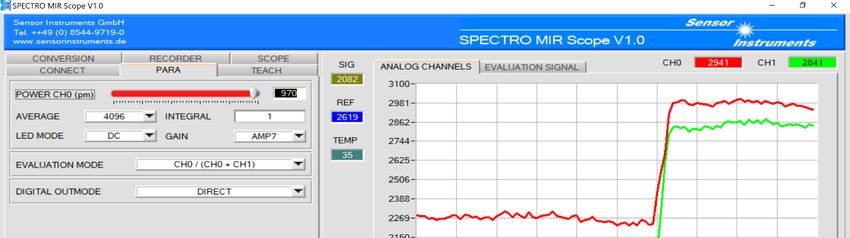
The measurement
A stainless steel sheet was used as a measurement object, onto the surface of which oil layers of
various thicknesses (but of the same type of oil) were applied. The oil layers can range from
Oil sample: CASTROL Iloform HFO 10

                                                          Test inks: 30mN/m, 32mN/m, 34mN/m
                                                          and 36mN/m

                                                          Sector: 1

                                                          Oil sample: CASTROL Iloform HFO 10

                                                          Test inks: 30mN/m, 32mN/m, 34mN/m,
                                                          36mN/m, 38mN/m and 40mN/m

                                                          Sector: 4

Oil sample: BECHEM BERUFORM STO 533
Test inks used: 30mN/m ‐ 44mN/m in the 9 various sectors

                                     EN_PI_2021-01-21_SI_The detection of oil layers on metal surfaces.docx 7/19
The oil samples
The following oils were available for the tests:
CASTROL HFO10
BECHEM STO533
Z+G KTL N16
BECHEM KFP95
BECHEM MF85
WILKE 628
WISURA AK3614SF
RAZIOL CLF11S
RAZIOL CLF11L
TRUMPF C462
TRUMPF B30
TRUMPF SRH/5
TRUMPF AKAMIN
OW 30 NEUTRAL
OW 30 0.01% GREEN
OW 30 0.01% UV‐COLOR
Comparison of the surface tension of the various oils with an approximately identical oil layer
thickness.
Investigation of the various oils has shown that the surface tension in similar oil layer thickness have
different values depending on the respective oil.
Surface tension in mN/m of various oils with an identical layer thickness
We compared the surface tension values in sector 6, the smallest oil quantities applied (layer
thickness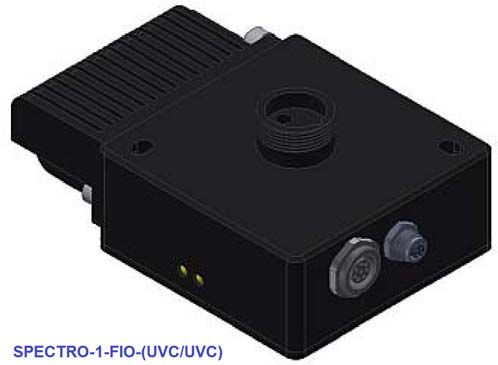
The measurement results
Measurement procedure 1:
Absorption of UVC radiation (265nm central wavelength range) by the oil layer

Measurement was performed with a
SPECTRO‐1‐FIO‐(UVC/UVC) fiber optic
sensor inc. R‐S‐A3.0‐(3.0)‐1200‐22°‐UV
reflex light guide and an A3.0‐OFL offline
optical fiber attachment, initially per oil
type in sectors 10 to 13 (this serves as a
reference when ascertaining the measured
values and the surface tension of the
degreased metal surface) and then in
sectors 1 to 9. The optical fiber head inc.
offline attachment was placed in the
center of the respective sector.

Comparison of the sensitivities of the various oils with the same layer thickness

Investigations of the oil types present using measurement procedure 1 produced significantly
different measurement results as shown in the following diagram:

       Comparison of the "sensitivity” of various oil types with an approximately identical oil layer thickness and an
       identical metal background

                                                            Oil type

The signal dip of the UVC radiation reflected from the metal surface and registered by the fiber
opticsCH0ref minus the UVC radiation CH0 reflected from the metal surface and reduced by
absorption on both the incidence and return path. The ratio of the difference CH0ref‐CH0 from the
oil samples subject to the strongest absorption to the oil sample which behaves almost neutrally
amounts to a factor of 22.

                                                   EN_PI_2021-01-21_SI_The detection of oil layers on metal surfaces.docx 9/19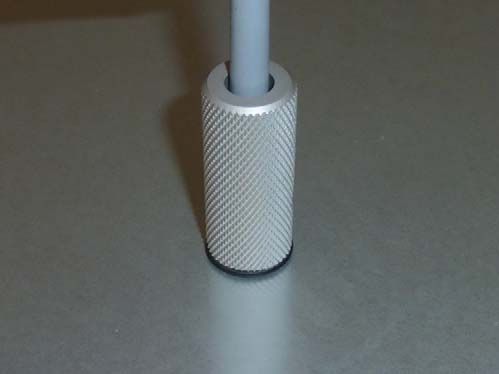
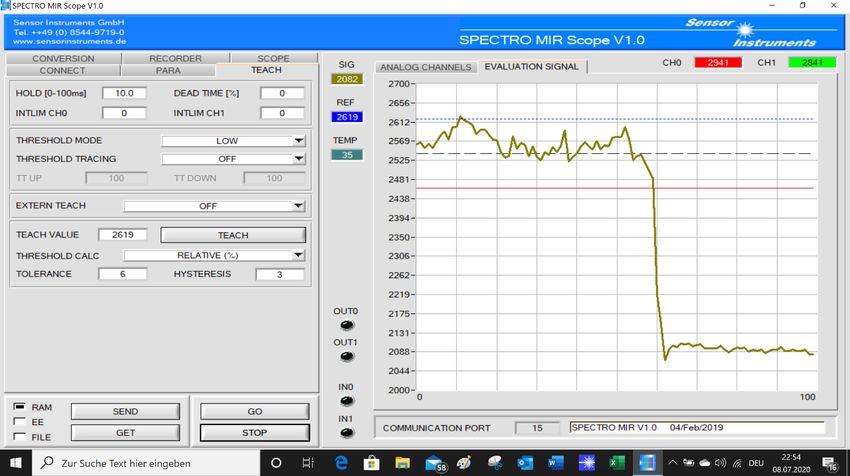
Investigation of the UVC absorption of an oil layer in dependence on time

In this measurement method, the fiber optic front end A3.0‐OFL is placed on a certain location of the
oil film over a long period of time; the signal course CH0 was recorded during this time.

A clear reduction in the absorption (Delta = 1600) of the UVC radiation could be observed over a
period of 36 min (CH0ref = 3975), which corresponds to a relative reduction of the absorption effect
by a factor of 2. When determining the measured value, the time after the placement of the
measuring head on the respective oil sample is decisive.

Measurement procedure 2:
Secondary emission in the visible wavelength range (fluorescence) with stimulation in the UVA
range (365nm)

                                      EN_PI_2021-01-21_SI_The detection of oil layers on metal surfaces.docx 10/19
A SPECTRO‐3‐30‐UV/BL‐MSM‐ANA with a UVA ring illumination (365nm) was used as a sensor and a
receiver‐side detection range of type 450nm to 700nm was used. To enable prone measurement, the
INLINE system was fitted with a SPECTRO‐3‐15‐d65‐OFL spacer at the front. First of all, an average
reference value was determined (10‐13) on the reference points and then an oil sample was
measured for the points 1‐9.
Comparison of the sensitivities of the various oils with the same layer thickness
Comparison of the "sensitivity” of various oil types with an approximately identical oil layer thickness and an
identical metal background
Oil type
This measurement procedure also produced considerable differences in the Y‐Yref value with the
same oil layer thickness of the individual oil types. If the oil types which do not tend to fluorescence
are not taken into account, a difference of c. 61 results between the most sensitive (Z+G KTL N16)
and the least sensitive sample (TRUMPF B30).
It was not possible to determine fluorescence with stimulation in the UVA range using the
following oil types:
WILKE 628
WISURA AK 3614SF
RAZIOL CLF 11S
RAZIOL CLF 11L
TRUMPF AKAMIN
EN_PI_2021-01-21_SI_The detection of oil layers on metal surfaces.docx 11/19Investigation of the fluorescence in the visible wavelength range with UVA stimulation of an oil
layer in dependence on time
The sensors were placed on a certain measuring point over a long period of time (a number of
minutes) and the signal strength Y was recorded during this time.
For example, over a period of c. 38 minutes, the oil type BECHEM BERUFORM STO533 presents a
reduction in the fluorescence signal Y‐Yref by a factor of 3. The exact time at which the measured
value was recorded after applying the sensors is of decisive importance in this measurement
procedure for determining the surface tension at the respective location. This consideration is of less
importance during INLINE sensor application, as each measurement sample is subject to the
relatively intensive UVA radiation for only a short time and the measurement can be performed at
the same time after positioning. The time synchronous sequence is performed between the
Programmable Logic Controller (PLC) and the respective actuating elements
Measurement procedure 3:
Standardized comparison of two wavelength ranges in the mid‐wavelength infrared light range
(MIR)
A SPECTRO‐M‐10‐MIR/(MIR1+MIR2) was used as a sensor; measuring points 1‐9 were also taken
into account, whilst positions 10‐13 served as reference points. The INLINE measurement system has
been converted to a hand‐held measuring device using the SPECTRO‐M‐30‐OFL spacer. The distance
to the measuring surface was 10 mm. The standardized measured value is the result of the two
ascertained measured values of the two measuring windows in the MIR range with the center
wavelengths of 3µm / 4µm. The second serves as a reference window, as prior spectrometric
investigations have shown that no noticeable absorption of the MIR radiation occurs in this
wavelength range.
EN_PI_2021-01-21_SI_The detection of oil layers on metal surfaces.docx 12/19During measurements, a connection to the PC was established using a serial interface.
Parametrization of the sensors and the numerical and graphical display of the measurement data is
performed via the Windows® software SPECTRO MIR Scope V1.0.
EN_PI_2021-01-21_SI_The detection of oil layers on metal surfaces.docx 13/19In addition to the display of the two measured values CH0 (reference value with 4µm) and CH1
(measured value at 3µm) the standardized value SIG = 4095xCH0/(CH0+CH1) is also shown.
The MIR MONITORING software can be used during INLINE measurement. The system operator is
shown the current quality situation and the trend on a PC monitor during production via a column
diagram. The measurement data is saved in a suitable format so that it can then be used with Word®
or Excel®.
Comparison of the sensitivities of the various oils with the same layer thickness.
Even when using this measurement method, it was still possible to ascertain differences in sensitivity
between the various oil types (with comparable layer thickness). In comparison to the two other two
measurement methods, it was possible to detect all oil types. The difference between the most
sensitive and insensitive sample amounted to a factor of only 7.
EN_PI_2021-01-21_SI_The detection of oil layers on metal surfaces.docx 14/19Comparison of the "sensitivity” of various oil types with an approximately identical oil layer thickness and an
identical metal background
Oil type
Investigation of the standardized absorption of MIR light in the wavelength ranges c. 3μm or 4μm
of an oil layer in dependence on time
The sensors were placed on a measuring point to which an oil film of a certain oil type had been
applied and measurement data recording was performed over a longer period (c. 43 min).
EN_PI_2021-01-21_SI_The detection of oil layers on metal surfaces.docx 15/19A decrease in the standardized range of only 5% could be determined (corresponds to a factor of c.
1.05). In comparison to the two previous measurement procedures, the signal dip is significantly
smaller, which is not just due to the standardized evaluation but the fact that MIR radiation would
seem to exercise a much lower influence on a change of the absorption behavior of oils.
Investigation of the standardized absorption behavior in the MIR range in dependence on the
surface tension of the respective oil type
Measurements were conducted at points 1‐9 (STANDARD) and an average reference value was
established from the four reference positions (STANDARDref). The difference between the two
values STANDARD ‐ STANDARDref serves as the degree of the surface tension. The value of the
surface tension was determined using the test ink method.
EN_PI_2021-01-21_SI_The detection of oil layers on metal surfaces.docx 16/19The gradients show that this measurement method also requires the performance of calibration to
the oil used in connection with the respective metal surface. The user can perform calibration using
the Windows® software SPECTRO MIR Scope V1.0. The value of the surface tension can also be
displayed in addition to the respective STANDARD value.
Summary
In practice, the presence of oil films on metal surfaces is very often checked using test inks.
This is a contact method, as test ink must be applied to the respective surface. This test ink
method for determining the surface tension is also dependent on the visual approach of the
observer (droplet formation yes/no and in which time) and the fact that only a relatively
coarse graduation of test inks in relation to the surface tension (in 2mN/m steps) means that
an exact analysis is not of especial value. This method requires a certain size of test surface
EN_PI_2021-01-21_SI_The detection of oil layers on metal surfaces.docx 17/19(width of the brush stroke x c. 15mm in length). Measurement procedures 1 and 2 permit
very small measurement surfaces, but not all oils react to the respective physical effect and
remain neutral. Measurement procedure 3 requires a somewhat larger test surface which
should also be plane. With all other criteria, this procedure performs better in comparison to
measurement procedures 1 and 2. One of the important advantages of measurement
procedure 3 is the standardized evaluation. This cannot replace the individual calibration per
oil type and metal surface but variations in the metal surface and any intensity drift of the
light source used can be compensated for the most part. No influence from artificial light
(white‐light LEDs) for room illumination (ambient light) on the measuring result can be
observed.
Which oils are suitable for the respective measurement procedure? (green: suitable, red: unsuitable)
Further important characteristics of the respective measurement procedures in comparison:
Measurement procedure UVC UVA MIR
Sensitivity difference factor
22 61 7
of the various oil types
Signal attenuation factor with
2 3 1.05
long‐term illumination
Sensitivity to extraneous light
Medium Strong Low
in comparison to artificial light (white‐light LED)
Measurement distance in mm
5 15 (11)* 10
Detection range in mm
5 12 (1)* 10
* There is also a fiber optic system version for the UVA measurement procedure, with which correspondingly
small detection ranges can be achieved.
EN_PI_2021-01-21_SI_The detection of oil layers on metal surfaces.docx 18/19Contact:
Sensor Instruments
Entwicklungs- und Vertriebs GmbH
Schlinding 11
D-94169 Thurmansbang
Tel. +49 8544 9719-0
Fax. +49 8544 9719-13
info@sensorinstruments.de
EN_PI_2021-01-21_SI_The detection of oil layers on metal surfaces.docx 19/19You can also read