The Effects of Conservation Grazing Management on Habitat Structure and Reptile Assemblage of Complex Grassland-Heathland Systems
←
→
Page content transcription
If your browser does not render page correctly, please read the page content below
The Effects of Conservation Grazing Management on
Habitat Structure and Reptile Assemblage of Complex
Grassland-Heathland Systems

A technical report prepared from an MRes Wildlife Conservation project,
Marwell Wildlife & University of Southampton
Carla Broom
Marwell Wildlife & University of Southampton
September 2018
5

Contents

i. Summary for the Layman                            9

ii. Abstract                                         11

iii. Abbreviations                                   13

1. INTRODUCTION                                      15

  1.1 Habitat Loss                                   15

  1.2 Grazing Management                             16

  1.3 Reptiles                                       17

     1.3.1 Population Decline                        17

     1.3.2 General Habitat Requirements              18

     1.3.3 Species Specific Habitat Requirements     19

       1.3.3.1 Slow Worms (Anguis fragilis)          19

       1.3.3.2 Common Lizards (Zootoca vivipara)     19

       1.3.3.3 Sand Lizards (Lacerta agilis)         20

       1.3.3.4 Grass Snakes (Natrix natrix)          20

       1.3.3.5 European Adders (Vipera berus)        21

       1.3.3.6 Smooth Snakes (Coronella austriaca)   21

  1.4 Aim and Objectives                             22

  1.5 Hypotheses                                     22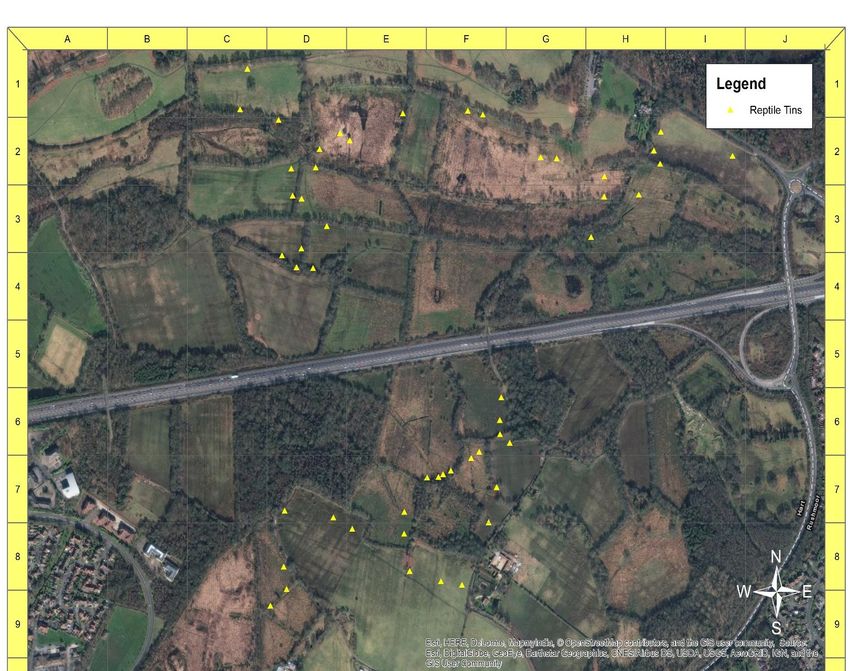
6

2. METHODOLOGY                                23

 2.1 Study Area                               23

   2.1.1 Eelmoor Marsh                        24

   2.1.2 Foxlease and Ancells Meadows         25

   2.1.3 Frensham Flashes                     26

 2.2 Study Period                             27

 2.3 Reptile Surveys                          28

 2.4 Vegetation Surveys                       32

 2.5 Analysis                                 33

   2.5.1 Management Approaches                33

   2.5.2 Principal Component Analysis (PCA)   33

   2.5.3 Generalised Linear Models (GLM)      34

   2.5.4 Occupancy Modelling                  34

   2.5.5 Heat Mapping                         35

3. RESULTS                                    36

 3.1 Management Approaches                    36

   3.1.1 Reptile Abundance                    36

   3.1.2 Species Proportions                  38

   3.1.3 Habitat Differences                  39

   3.1.4 Vegetation Differences               41

   3.1.5 Prey Abundance                       42

 3.2 Principal Component Analysis             43

 3.3 Generalised Linear Models                44

 3.4 Occupancy Models                         46

 3.5 Heat Mapping                             47
7

4. DISCUSSION                                                         49

  4.1 Grazing Management Systems                                      49

  4.2 Relationships between Reptile Abundance and Grazing Intensity   51

  4.3 Recommendations                                                 53

  4.4 Limitations and Improvements                                    55

  4.5 Further Study                                                   57

  4.6 Conclusion                                                      58

iv. Appendix                                                          60

  Appendix 1                                                          60

  Appendix 2                                                          62

  Appendix 3                                                          63

  Appendix 4                                                          64

  Appendix 5                                                          65

v. References                                                         66

vi. Acknowledgements                                                  79
8
9

i. Summary for the Layman

The way land is used is continually changing, leading to loss of important wildlife
habitat, resulting in declines in wildlife populations and impairing the environment’s
ability to function. Lowland heath has been particularly badly affected, declining 84%
since the 1800’s. This is partially due to incorrect management, allowing more
dominant vegetation to take over which has affected many species relying on grass-
heathland habitat, such as reptiles. Reptiles have very specific vegetation
requirements, such as needing open areas to bask in and dense areas to shelter. One
method of maintaining heathland systems and providing this habitat for reptiles is
through grazing management.

       This study aimed to investigate how the level of grazing intensity changes
habitat and thereby determines the species of reptiles present in the surrounding area.
This was achieved by carrying out reptile surveys across three sites in Northern
Hampshire and Surrey, in south-east England, and measuring vegetation across the
sites to ascertain the grazing intensity. The variation in grazing intensity across the
sites was shown, and relationships between the number of reptiles and the intensity
of grazing were identified. The sites were divided into equal patches, and the presence
of reptiles within each patch was estimated based on vegetation measurements.

       The study found that implementing grazing as a management tool reduces
vegetation height and increases the range of vegetation types, thereby creating
suitable habitat for many reptile species. Grazing systems that rotate cattle between
fields did not seem to be beneficial, neither for reptiles nor heathland, as it results in
some areas being very heavily grazed and some left over-grown. However, having a
low density of free-roaming grazers was beneficial for both reptiles and heathland.
Recommendations for management systems were made for each site. It is important
to note that implementing grazing as a management tool is not suitable for all
situations, and any decisions should be carefully considered and planned out before
action is taken. Future work should focus on restoring landscapes in between sites,
which contain little suitable habitat. Grazing could help to achieve this goal, allowing
reptiles and other animals to move between areas and enhance their populations.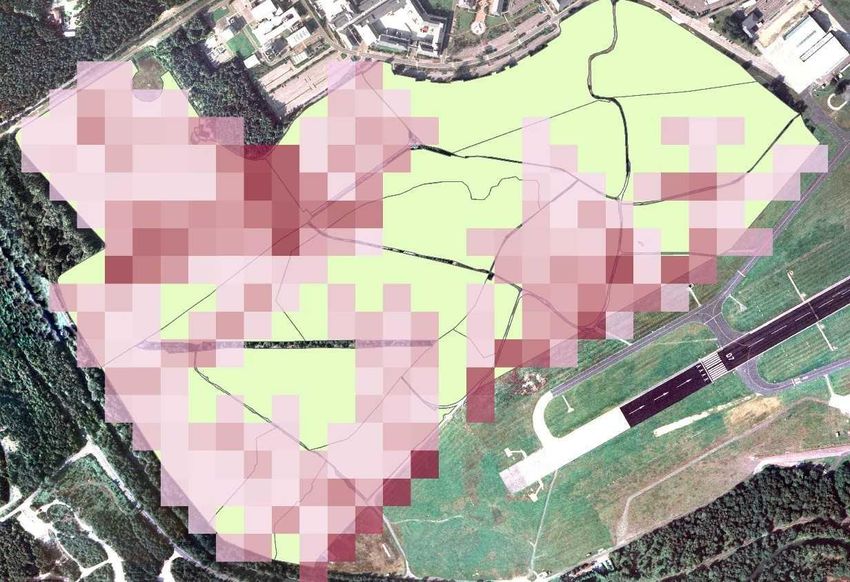
10
11

ii. Abstract

Land-use change is the leading cause of habitat loss, resulting in loss of biodiversity
and ecosystem function. Lowland heath in particular has declined 84% since the
1800’s, partially due to inappropriate management not preserving the intermediate
successional stage required for heathland to thrive. The loss of grassland-heathland
systems has greatly affected species relying on this habitat, such as reptiles. Reptiles
rely on a number of important micro-habitat features, which require a high level of
variation in structural complexity. One method of preventing succession to woody
vegetation and increasing heterogeneity is through controlled grazing management.

       The aim of this study was to assess how grazing intensity drives patch-level
reptile assemblage by modifying habitat structure, by undertaking reptile surveys
across three sites in Northern Hampshire and Surrey, in south-east England, and
measuring various vegetation parameters as a proxy for grazing intensity. Principal
component analysis showed patterns and variation in grazing intensity between the
sites, and relationships between abundance and grazing intensity were identified using
generalised linear models. Occupancy models were used to estimate patch occupancy
based on these parameters.

       The study found that conservation grazing reduces sward height and increases
structural complexity of vegetation, creating suitable habitat for many reptile species.
Rotational grazing systems do not seem beneficial for heathland restoration or reptile
abundance due to high disparity between grazed and un-grazed areas, however free-
roaming low-intensity stocking systems are suitable. Management recommendations
are made, though it is important to note grazing is not applicable for all situations and
decisions should be carefully considered and modelled before any action is taken.
Future work should focus on restoring the fragmented landscape to increase
connectivity, possibly by implementing grazing.

Key Words: reptile, assemblage, grazing, management, heathland, grassland, patch
occupancy

Target Journal: Journal of Applied Ecology
ERGO number: 31907.A1
12
13

iii. Abbreviations

AIC                  Akaike’s Information Criterion
ARC                  Amphibian and Reptile Conservation Group
EEL                  Eelmoor Marsh
FOX                  Foxlease & Ancells Meadows
FLA                  Frensham Flashes
GIS                  Geographic Information System
GLM                  Generalised Linear Model
GLMM                 Generalised Linear Mixed-Effect Model
HIWWT                Hampshire and Isle of Wight Wildlife Trust
HLS                  Higher Level Stewardship
MoD                  Ministry of Defence
NARRS                National Amphibian and Reptile Recording Scheme
PCA                  Principal Component Analysis
RDI                  Raw data, Descriptive and Inferential Statistic Plot
SARG                 Surrey Amphibian and Reptile Group
SSSI                 Site of Special Scientific Interest
SINC                 Special Importance for Nature Conservation
SPA                  Special Protection Area
14
15

1. INTRODUCTION

1.1 Habitat Loss

Land-use change leading to habitat destruction is the main driver of species extinction
(Tilman et al., 2001), leading to biodiversity loss (Dobson et al., 2006), reduction in
functional diversity and therefore ecosystem function (Flynn et al., 2009). Habitat
conversion is 8 times higher than protection in temperate areas (Hoekstra et al., 2005)
largely for agriculture, leading to massive habitat loss across Europe (Krauss et al.,
2010). Should this dependence on agriculture continue, 10 9 hectares of natural
ecosystems will be converted by 2050 (Tilman et al., 2001). By 2100, vegetation cover
could decrease by 58%, causing up to 21,000 species extinctions (Jantz et al., 2015).

       Habitat destruction leads to fragmentation, often defined as “landscape-scale
processes involving habitat loss and breaking apart of habitat” (Fahrig, 2003), creating
biodiversity ‘hotspots’ of clumped distributions containing threatened species (Brooks
et al., 2002). For example, more than 50% of endangered species are found in less
than 2% of US land area (Dobson et al., 1997). These fragments can be considered
‘islands’ within larger, unsuitable habitat (Pimm & Raven, 2000), allowing the
application of Island Biogeography Theory; larger fragments sustain higher species
diversity and populations (MacArthur & Wilson, 1967). Fragments are therefore heavily
reliant on size, habitat quality and connectivity to support colonisation and reduce
extinction (Jantz et al., 2015) by allowing movement of metapopulations (Hanski,
1998). Habitat destruction could be reduced with wide-scale preservation and
lessening the impact of land-use activities (Jantz et al., 2015).

       Heathlands in particular have been hugely affected by increased agriculture,
increased timber production and growing human populations (Moore, 1962; Critchley
et al., 2013). British heathlands are better developed than in Europe due to the oceanic
climate and higher humidity, with three main types: lowland, upland and wet heath.
Lowland heath is especially important and has declined rapidly, an estimated 84%
since the 1800’s (Jackson and McLeod 2008) and is highly fragmented with multiple
small patches instead of the original continuous habitat (Moore, 1962). Hampshire, in
southern England, has the largest proportion of the country’s lowland heath and 14%
of that in Europe (Groves et al., 2012).
16
One cause of heathland decline is the lack of management to prevent
succession into woody vegetation (Harrison, 1976). Although a strong coloniser, when
left unmanaged heather gives way to shrubs and other vegetation (Gimingham, 1992),
increasing homogeneity and reducing biodiversity of many taxa (Fitch, 2006). If
intermediate vegetation is maintained, more species can thrive (Pielou, 1966).
Furthermore, heathland restoration is facing many constraints, including increased
nitrogen deposits and fertilisers causing Calluna vulgaris, one of the main heather
species along with Erica tetaralix (Farrell, 1989), to give way to grass species such as
Molinia caerulea (Purple moor grass) (Heil and Diemont 1983; Heil and Bruggink
1987) which is difficult to control (Ross et al. 2003; Marrs et al. 2004). This has
hindered development of semi-natural habitat from agricultural land, with heathland
development hugely decreasing throughout the 20th century (Ejrnæs et al., 2008).
1.2 Grazing Management
This intermediate successional state is important for many ground-dwelling species,
including reptiles, and was previously maintained by herbivores that are no longer
present. It now requires human intervention (Webb, 1998) such as introducing
livestock as grazers. This balance of wildlife and livestock is ever more important as
agriculture intensifies, especially as the introduction of grazing on heathland is set-
aback by the lack of information on methods and effects (Bullock & Pakeman, 1997).
Controlled conservation grazing increases soil quality and allows colonisation
of new plants (Read et al., 2016), as well as aiding nutrient cycling, increasing spatial
heterogeneity and plant resilience (Wilkie, 2013). However, it requires long-term
planning and monitoring with a deep understanding of the ecosystem and how
populations will be affected by change (Gordon et al., 2004). High stocking density
can lead to over-grazing, degrading grasslands (Mysterud, 2006), increasing the
amount of bare soil and reducing the variation in vegetation across the landscape
(Augustine et al., 2012), leading to biodiversity loss (Kay et al., 2017). Moderate
grazing is considered most beneficial for conservation (Howland et al., 2014), with
free-roaming grazers maintaining patches of varying vegetation and habitat (Bullock
& Pakeman, 1997).17
1.3 Reptiles
1.3.1 Population Decline
Reptiles are area-sensitive, declining with habitat size (Hager, 1998) and land-
use change, such as agriculture (Atauri & de Lucio, 2001). This, along with increased
urbanisation and disturbance, is resulting in habitat loss, the main driver of reptile
decline (Cox & Temple, 2009) and creating fragmented populations. This sensitivity
can be used to measure environmental conditions, and as reptiles show long-term
population declines (Cox & Temple, 2009) they are suitable bioindicators of habitat
change (Morris et al., 2008; Lindenmayer & Likens, 2011). Habitat restoration through
management is required, however general land management does not consider
microhabitat requirements (Edgar et al., 2010). There is little research on wide-scale
management for reptile communities, as ideal habitat likely includes a huge variety of
different factors that are largely unknown (Marum, 2006, unpublished). In the UK,
areas with high reptile abundance can be marked as ‘interest features’ for protection,
such as sites of special scientific interest (SSSI). More than 50 SSSIs are designated
due to reptile populations, however even in protected areas care is not always taken
to ensure management techniques are suitable (Edgar et al., 2010).
Globally, 35% of reptile species are threatened by extinction (IUCN, 2017) and
in Europe, 41.7% of species are declining, with the most threatened families being
Viperidae and Lacertidae. There are six native UK species; slow worm (Anguis
fragilis), common lizard (Zootoca vivipara), sand lizard (Lacerta agilis), grass snake
(Natrix natrix), European adder (Vipera berus) and smooth snake (Coronella
austriaca). Most are found across a range of habitat including heathland, open
woodland and grassland (Edgar et al., 2010; Stumpel & Van der Werf, 2012), though
heathlands are particularly important for species relying on mature heather,
particularly when combined with M. caerulea. There are few instances of all six species
occurring together in other habitats (Spellerberg, 1989). Although extinction risks are
‘Least Concern’ (Agasyan et al., 2009; Agasyan et al., 2010a; b; European Reptile and
Amphibian Specialist Group, 1996; Crnobrnja Isailovic et al., 2009a; b), distributions
are varied and all suffer from habitat loss (Edgar et al., 2010; Inns, 2011). All are
protected under the 1981 Wildlife and Countryside Act against killing, injuring, taking
and trading (JNCC, 1981), and are part of the ‘Post-2010 Biodiversity Framework’
(JNCC & DEFRA, 2012), focusing on integrating species with habitat restoration.18
1.3.2 General Habitat Requirements
Although some have specific needs, UK reptiles require similar microhabitat features
(Webb et al., 2010). As ectothermic animals, all require open habitat to bask. South-
facing slopes are preferred, with a mix of open ground and dense cover to alternate
and control body heat. Nearby shelter from predators and adverse weather is required,
provided by deep vegetation pockets such as prickly gorses and deep mosses and
lichen to cool down (Edgar et al., 2010). If vegetation is too short or sparse, predation
is higher and reptile populations decrease (Kreulen, 1979; Sato et al., 2014), however
highly dense vegetation inhibits basking. Vegetation tussocks also provide hibernation
sites. Habitat edges of woodland, hedgerows and grass-scrub interfaces create
‘transitional zones’, allowing reptiles to move between and across sites, increasing
connectivity. As most species have short dispersal, they require large areas of
continuous habitat or patches linked by favourable habitat to move through. For
species with separate hibernation and breeding sites, connectivity is especially
important to form larger meta-populations which reduce inbreeding, retain genetic
diversity and allow re-colonisation of locally extinct areas (Edgar et al., 2010).
Across all habitats, vegetation drives reptile assemblage. Mowing, cutting and
grazing prevent natural succession and maintain varying degrees of intermediate
vegetation, providing the mosaic of ages, heights and types, required by reptiles
(Edgar et al., 2010). Growth of trees and shrubs, agricultural abandonment and
succession removes open land and leads to over-shading (Cox & Temple, 2009),
leading to degradation of key micro-habitat features. Wide-scale habitat management
for reptile communities must incorporate these general needs, which also benefits
other taxa saving time and costs (Edgar et al., 2010). Specific management aimed at
rarer reptile species will also benefit those relying on similar features (Inns, 2011).
Grazing is a widely applicable way of retaining intermediate vegetation
(Gimingham, 1992), however there is contradictory research on responses of reptile
populations and which treatments are most successful. Reptile densities vary with litter
cover, sward height and percentage cover (Marum, 2006, unpublished), increasing
with habitat complexity (Santos et al., 2016). This suggests they benefit from
conservation grazing, as abundance increases with livestock density. They are not
affected by rotational grazing systems (Dorrough et al., 2012), but free-roaming19 grazers are thought to be beneficial as they create ideal heterogeneous conditions through high and low intensity grazing to suit many species (Howland et al., 2014). A range of grazing approaches should be applied to suit as many species as possible (Kay et al., 2017). Conversely, research shows even light grazing can increase local extinctions (Larson, 2014), with over-grazing causing fragmentation and conversion from heathland to grassland (Hester & Baillie, 1998) and cattle grazing reducing reproductive rate of many UK reptiles (Reading and Jofre 2015; 2016). Other studies show no impacts of grazing on abundance (Beever & Brussard, 2004). 1.3.3 Species Specific Habitat Requirements 1.3.3.1 Slow Worms (Anguis fragilis) Slow worms are generalists, tolerating lower diversity of vegetation than other species (Edgar et al., 2010). They bask less openly than other lizards, especially in very warm weather (Inns, 2011), and are mostly fossorial, staying underground and within vegetation. They require loose soil for burrowing, and avoid very wet or very dry areas (Edgar et al., 2010). A. fragilis are mainly diurnal, but sometimes forage on warm evenings for prey such as slugs and worms (Inns, 2011). They have small home ranges of several hundred square metres (Edgar et al., 2010). 1.3.3.2 Common Lizards (Zootoca vivipara) Common lizards are also generalists, thriving in habitats with sufficient sunlight, structure and cover. They tolerate a range of conditions, preferring damp environments but are largely absent from countryside dominated with agriculture, dense woodland or heavily grazed grassland due to structural uniformity and lack of prey. Their wide habitat tolerance enables a large range of prey (Edgar et al., 2010) such as spiders and small insects. Z. vivipara operate at lower temperatures, spending less time basking than sand lizards and often basking with other individuals (Inns, 2011). Ranges are limited to a few tens of meters, however juveniles can rapidly colonise nearby habitat if available (Edgar et al., 2010).
20

1.3.3.3 Sand Lizards (Lacerta agilis)

Sand lizards are rare in the UK and confined to limited sites, so are strictly protected
with licensing required for some activities (ARC Trust, n.d.). They have highly specific
microhabitat requirements, only found on dry, lowland heath (holding 95% of the UK
population) and coastal sand dunes. Key requirements can be met by many habitats,
suggesting plant species are less important than the structural conditions they provide,
but these conditions are lacking. As the species is on the edge of its European range,
they require especially warm habitats. Breeding adults require mature dry, sandy
heathland and good ground cover of bryophytes and lichens. Warm, sandy ground
with nearby dense cover is essential for egg-laying, however will be avoided if heavily
grazed (Edgar et al., 2010). L. agilis bask in open areas with nearby mire and water in
hot weather, returning to the same site for several years. They hunt on a variety of
invertebrates, including spiders, grasshoppers and even bees. They are the only UK
reptile species to dig their own holes for hibernation (Inns, 2011). Home ranges are
only a few hundred square meters and can overlap; while not territorial, males have
dominance hierarchies when competing for females. In favourable habitat, individuals
can be highly sedentary and rarely venture into unsuitable habitat (Edgar et al., 2010).
Suitable management involves controlling vegetation to reduce shading, increasing
bare sand and preserving structural diversity of vegetation (Edgar & Bird, 2006).

1.3.3.4 Grass Snakes (Natrix natrix)

Although generalists, grass snakes require ponds and lakes for fish and amphibian
prey but can travel far from water. Amphibian decline has affected populations (Inns,
2011), however lack of monitoring and high mobility makes it difficult to determine their
status. They require decomposing matter for egg-laying, in communal areas that
females return to every year. The loss of these sites has caused population declines,
so conservation efforts are focused on pond management to increase prey and
restoring breeding sites. N. natrix are mobile, migrating several kilometres between
breeding and hibernation sites, so are less dependent on structural diversity at single
sites and may migrate through poor quality habitat to reach favoured areas (Edgar et
al., 2010). They hibernate underground and in deep litter, sometimes sharing with
adders, and disperse rapidly after emergence (Inns, 2011).
21

1.3.3.5 European Adders (Vipera berus)

Adders are found in most open habitats, however require ‘Adder banks’, which are
underground hibernacula that need to be dry, with dense vegetation cover and nearby
basking sites (McInerny, 2014). They often utilise disused mammal burrows to
hibernate communally, returning every year; if these are damaged or removed, for
example through unsuitable land management, it can hugely affect populations (Edgar
et al., 2010). They prefer chalk or sandy soil and are rarely found in areas with intense
agriculture. With more restricted habitat preferences, adders are less resistant to
human-induced changes leading to local extinctions (Inns, 2011), so habitat
connectivity is particularly important. V. berus feed mainly on small mammals. They
have distinct seasonal migrations between spring breeding and wetter, summer
foraging sites, which can be up to two kilometres apart, requiring high connectivity with
adequate vegetation cover (Edgar et al., 2010).

1.3.3.6 Smooth Snakes (Coronella austriaca)

Smooth snakes are a highly localised species, confined to specific habitats and are
therefore strictly protected by law with licensing required for some activities (ARC Trust
n.d.). They are secretive, staying in mature heathland with deep layers of bryophytes
and lichens. They prefer a lower body temperature than other reptiles, so are less
likely to bask in the open, making population estimates difficult (Edgar et al., 2010).
They often occur with sand lizards and benefit from similar management regimes.
They feed mainly on lizards, including slow worms, and sometimes small mammals
(Inns, 2011). C. austriaca do not undertake long seasonal migrations, with ranges
rarely exceeding 100m, making them especially sensitive to habitat loss (Edgar et al.,
2010).
22

1.4 Aim and Objectives

Aim
Assess how various grazing regimes implementing different grazing intensities modify
habitat structure and drive patch-level reptile assemblage within complex grassland-
heathland systems.

Objectives
1. Compare reptile assemblage and vegetation parameters as a proxy for grazing
   intensity between management systems.
2. Determine how grazing intensity drives reptile assemblage through modification of
   habitat structure.
3. Quantify patch occupancy of reptiles based on grazing intensity parameters.

1.5 Hypotheses

Null hypotheses:
1. Different grazing management systems will support equal reptile abundance
2. Different grazing management systems will support equal species proportions.
3. Proportion of reptiles in each habitat type will not vary from proportion of tins.
4. There will be no variation in vegetation height, percentage ground cover,
   vegetation structure or canopy cover between grazing management systems.
5. Different grazing management systems will support equal reptile prey abundance.
6. There will be no relationship between reptile abundance and grazing intensity or
   weather conditions.
7. All areas, regardless of grazing intensity, will show equal patch occupancy.
Alternate hypotheses:
1. Reptile abundance will vary with grazing management systems.
2. Species proportions will vary with grazing management systems.
3. Proportion of reptiles in each habitat type will vary from proportion of tins.
4. Vegetation height, percentage ground cover, vegetation structure and canopy
   cover will vary with grazing management systems.
5. Reptile prey abundance will vary with grazing management systems.
6. There will be a relationship between reptile abundance and grazing intensity and
   weather conditions.
7. Areas with varying grazing intensity will show different patch occupancy.
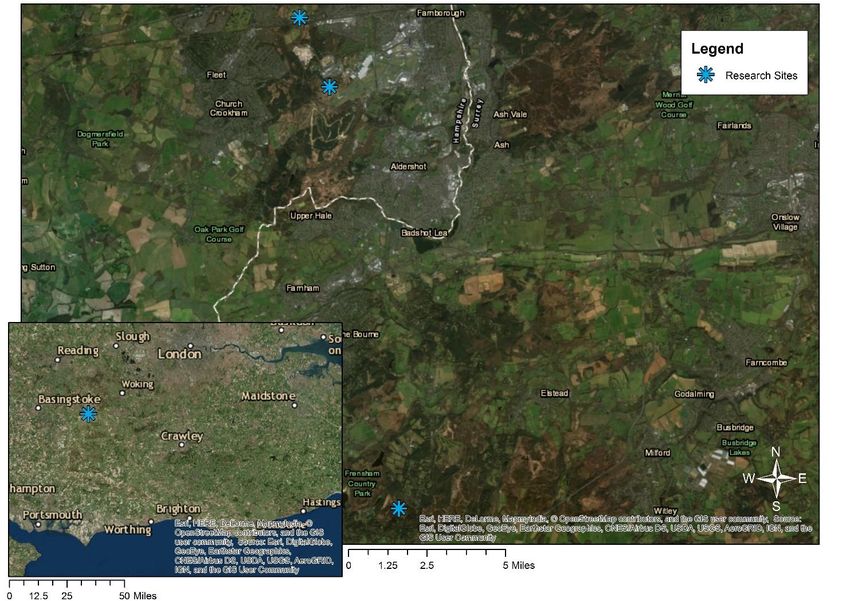
23

 2. METHODOLOGY

 2.1 Study Area

 The study was carried out across three sites in Northern Hampshire and Surrey (fig
 1). All are SSSI’s designated under Natural England.

Figure 1: locations of three sites visited for this study: Eelmoor Marsh (central), Foxlease
and Ancells Meadows (top) and Frensham Flashes (bottom). The inset map shows their
location in south-east England, UK. Made using ArcMap 10.4.1.
24

2.1.1 Eelmoor Marsh

Eelmoor Marsh SSSI (78.72 ha) was designated in 1978 due to rich flora species and
high invertebrate diversity present in the rare grass-heath system (Natural England,
1978). It is split into three units, which are all classed as ‘favourable’ condition by
Natural England (Natural England, 2014). The latest national vegetation classification
survey results (see appendix 1, fig. 1) can be broadly categorised into five types;
grassland (acid, neutral, and M. caerulea dominated), dry heathland, wet heathland,
woodland and mire, along with some aquatic features. The heathland, mire and
grassland are considered valued habitats (Hall et al., 2015). It has been part of the
Thames Basin Heaths Special Protection Area (SPA) since 2005 and contains the
Farnborough Airfield Site of Importance for Nature Conservation (SINC) established
in 2000 (Rushmoor Borough Council, 2017). The land has no public access and is
within a securely fenced area, however staff from the nearby technology park are
permitted during working hours on weekdays.

       The site is managed by Marwell Wildlife and QinetiQ estates, and is split into
24 management compartments, separated by physical features and vegetation
communities (see appendix 1, fig. 2). Vegetation is managed by free-roaming grazers,
with four Przewalski’s horses and six Highland Cattle on the south side, and three
cattle on the north.

       Eelmoor contains five of the six native UK reptile species (table 1). The four
most common species are regularly found across most compartments (see appendix
1, table 1), and L. agilis populations were reintroduced in 2017 (expected to be found
mostly in compartments one and two). All are expected to be breeding and hibernating
on site (Hutchins, 2004). Although reptiles likely benefit from general habitat
maintenance (Edgar & Bird, 2006), there is no specific management here for valued
species. Systematic surveys are carried out, and extensive monitoring has been
proposed for 2020 (Hall et al., 2015). Populations were found to be declining, however
this was based on small sample sizes so further study is required. All habitats present
are suitable for the reptile species (Langham, 2015).
25
2.1.2 Foxlease and Ancells Meadows
Foxlease and Ancells Meadows SSSI (70.54 ha) was designated in 1988 due to the
range of habitat forming a mosaic of plant diversity rarely seen in southern England,
and the extensive network of ponds and ditches harbouring many rare species
(Natural England, 1988). Foxlease and Ancells Meadows are separate sites but are
considered one designation under Natural England. They consist of nine units, all
classed as ‘Unfavourable – Recovering’ by Natural England apart from one, classed
as ‘Favourable’ (Natural England, 2013), but this unit is not included in the study as
there is no grazing present.
Foxlease and Ancells Meadows are owned by the Ministry of Defence (MoD),
used as training areas and managed by Hampshire and Isle of Wight Wildlife Trust
(HIWWT). Public are permitted onto the land for recreational use, such as dog walking.
The area is fenced into many separate fields (appendix 2, figure 3) enabling rotational
grazing under the higher-level stewardship (HLS) scheme, aiming increase habitat
condition to ‘Favourable’ or ‘Recovering’ (Natural England 2011a; 2009). This study
focused only on the fields where grazing is implemented (appendix 2, figure 3).
Foxlease north contains two herds, the first consisting of four British White and one
Hereford cow, and the second of 27 British White cows, one Hereford cow and one
Hereford Bull. Foxlease south contains one herd of 17 Sussex Red cows, and Ancells
Meadows contains one herd of 19 Shetland cows and one British White bull (Richard
Hennessey, pers. comm., 2018).
Although this SSSI contains the four most common British native reptile species
(table 1), there is no mention of reptiles as indicators of success in the HLS prescription
(Natural England 2011a; 2009) and no specific management aimed at their
conservation. There is little data on reptile abundance as previous to this study there
were no reptile tins present, however adders have been seen around Field F, and
grass snakes around Ancells Pond (Richard Hennessey, pers. comm. 2018).26
2.1.3 Frensham Flashes
Frensham Flashes (110.48 ha) is part of the SSSI Thursley, Hankley and Frensham
Commons designated in 1955. There are two units covering the Flashes, both
classified as ‘Favourable’. The commons were designated due to their incredibly high-
quality heathland habitat, providing an area of national importance for birds, all six
native reptile species, four amphibian species and many invertebrates. There are also
many areas of open water and bog (Natural England 2011b).
The land is owned and managed by Waverley Borough Council. Historically,
the western area was grazed (Darren Hill, pers. comm. 2018), but was abandoned in
2001 after foot and mouth outbreak. Currently there is no grazing management in
place, instead it is rotationally scraped and turf is removed to create bare soil important
for many species to the standard set by the HLS scheme. This work is carried out by
the Amphibian and Reptile Conservation Trust (ARC) under an agreement with the
council to create and preserve vital habitat for reptiles, that runs until 2020. Heather is
also mown to create bare ground, along with bracken removal to minimise damage to
ground nesting birds and reptiles. Grazing management has been suggested to
remove dense swards of Molinia caerulea, to ensure it does not cover more than 60%
of wet heath areas. The land is public access, and public engagement with nature is
of high importance within the management of this site. Dog walking can have negative
impacts on many species including reptiles, so leads are required from March-August
(Waverley Borough Council, 2017).
All six native reptile species are present here (table 1). It is possible that C.
austriaca populations were enhanced by reintroductions to an adjacent site (Steve
Langham, pers. comm. 2018). Regular surveys are undertaken by Surrey Amphibian
and Reptile Group (SARG).27
Table 1: summary of reptile species present at each survey site.
Site Slow Common Sand Grass European Smooth
Worm Lizard Lizard Snake Adder Snake
Eelmoor Marsh √ √ √ √ √
Foxlease and √ √ √ √
Ancells Meadows
Frensham Flashes √ √ √ √ √ √
2.2 Study Period
Two pilot surveys were carried out at Eelmoor to ensure reptiles had emerged from
hibernation. The study was undertaken during late spring of 2018 (for schedule, see
appendix 3, table 2). Reptiles are encountered more during these months due to cooler
weather leading to longer basking, and as reptiles are actively looking for mates (fig.
2) they are more resilient to disturbance (Spence-Bailey et al. 2010; Inns 2011).
Surveys were carried out weekly for 10 weeks, totalling 8 visits per site.
Figure 2: annual activity clocks of six native UK reptile
species, showing active periods when main life-cycle stages
occur, hibernation period, time of mating, egg laying and
birth. a) A. fragilis b) Z. vivipara c) L. agilis d) N. natrix e) V.
berum f) C. austriaca. Adapted from Inns, 2011. N.B: some
species are viviparous and give birth to live young.28
2.3 Reptile Surveys
The National Amphibian and Reptile Recording Scheme (NARRS) provides guidelines
on suitable surveying methods. Using metal reptile tins is a widely accepted method,
as reptiles bask on top or shelter underneath since they are warmer than the
surrounding environment (Sewell et al., 2013). Using this method requires little
maintenance, is low cost and provides means to quantify reptile abundance and
distribution (Grant et al., 1992).
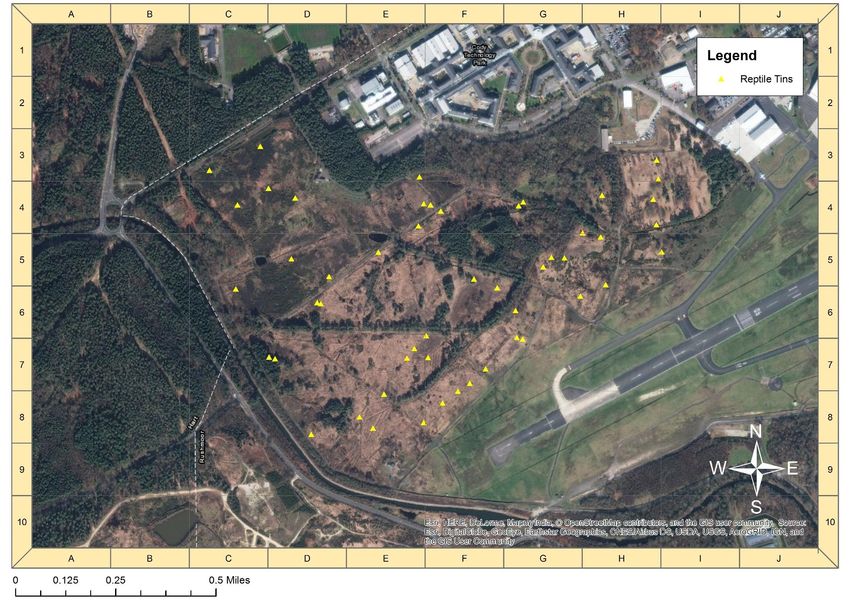
Prior to this study, there were 51 tins (at least 50cm x 50cm) present at Eelmoor
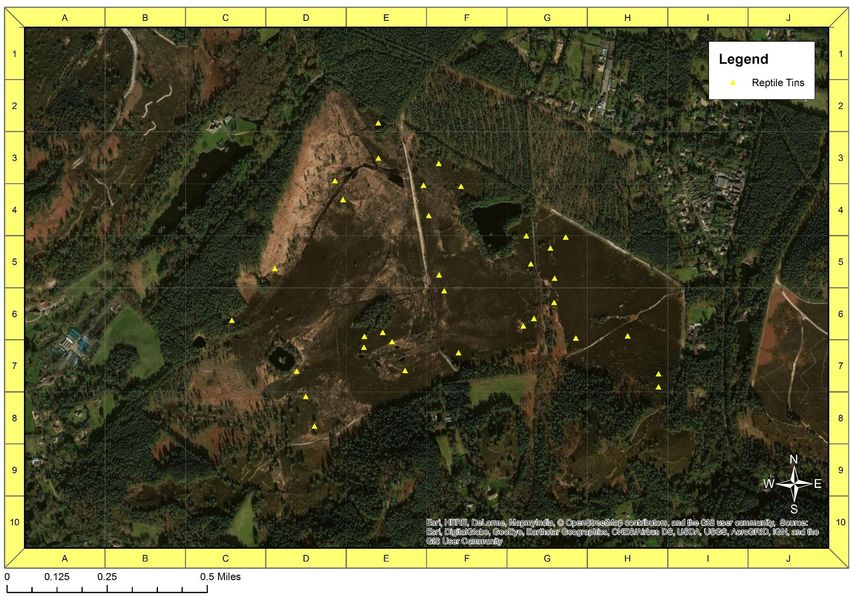
Marsh (fig. 3) and 33 at Frensham Flashes (fig 4). 54 tins were laid out at Foxlease
and Ancells Meadows (fig. 5), and left for two weeks to establish before surveying
began (Grant et al., 1992). The tins are spread between the various habitat types at
each site (table 2).
Table 2: distribution of reptile tins across five broad habitat types.
Site Habitat Type Number of Tins Percentage of tins in
each habitat
Eelmoor Marsh Grassland 5 9.8
Dry Heath 21 38.9
Wet Heath 11 21.6
Mire 8 15.7
Woodland 6 11.8
Foxlease and Grassland 28 51.9
Ancells Meadows Dry Heath 0 0
Wet Heath 12 22.2
Mire 13 24.1
Woodland 1 1.9
Frensham Flashes Grassland 1 3
Dry Heath 15 45.5
Wet Heath 14 42.4
Mire 2 6.1
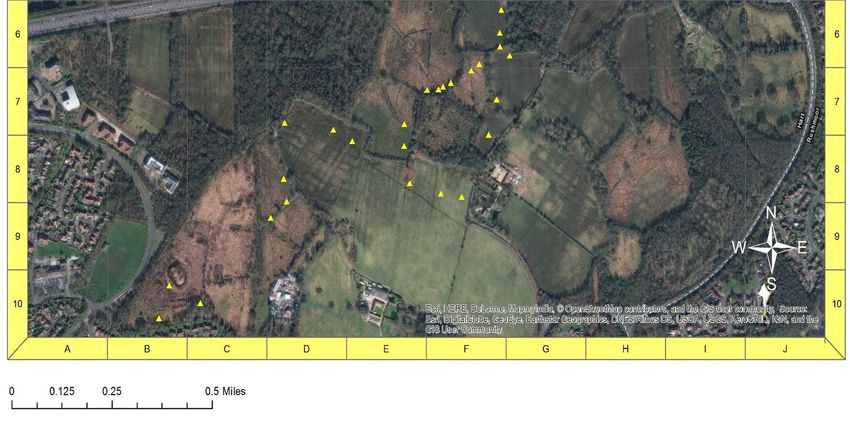
Woodland 1 329 Figure 3: distribution of 51 tins across Eelmoor Marsh. Created using ArcMap 10.4.1.
30

Figure 4: distribution of 54 tins across Foxlease and Ancells Meadows. Created using
ArcMap 10.4.1.
31

Figure 5: distribution of 33 tins across Frensham Flashes. Created using ArcMap
10.4.1.
32

       At each site visit, all reptile refugia were checked once following the same route,
which was reversed every visit to avoid bias due to time of day. Each tin was carefully
monitored before approaching as Z. vivipara and L. agilis tend to bask on top and are
often missed as they move away before being seen. Tins were lifted to identify
individuals underneath. Vegetation edges were visually monitored while moving
around sites (Sewell et al., 2013). Each reptile found was identified to species, gender
and age class (juvenile, sub-adult or adult), along with the time and the tin number.
Any reptiles seen while walking between tins were logged on a GPS unit and if
possible, species, gender and age also recorded.

       The location of any amphibians or small mammals found were noted. On each
surveying day, temperature, wind strength (Beaufort scale) and percentage cloud
cover were recorded.

2.4 Vegetation Surveys

Vegetation characteristics were recorded as a proxy of grazing intensity, to measure
the grass resource reptiles are in direct contact with and provide a quantitative index
of grazing intensity to compare across sites. Methodology was adapted from Howland
et al. (2014) and Howard and Hailey (1999). Vegetation surveys were carried out
across weeks six and seven.

       At each tin, four 1m x 1m quadrats were placed around it (top, bottom, left, right)
and percentage cover of vegetation estimated by eye. Mosses and lichens were
included as these provide important habitat for reptiles, but leaf litter was not. At the
mid-point of each quadrat, a meter ruler was used to measure vegetation height
(Howland et al., 2014). Complexity of surrounding vegetation (~20m radius) was
recorded using a scale adapted from Howard and Hailey (1999) (see appendix 4, table
3). As areas with lower grazing intensity may have increased shading (Edgar et al.,
2010), canopy cover above the tin was also measured using a densiometer.
33 2.5 Analysis Analyses were carried out and figures created using statistical software R v3.5.0. 2.5.1 Management Approaches Differences between grazing management approaches were measured by comparing reptile abundance, proportion of species, distribution across habitat types and prey abundance between sites. These were analysed using chi-squared goodness-of-fit tests, comparing observed and expected counts assuming random sampling and independent data points. Post-hoc testing identified where differences were seen by calculating standard residual values (Sharpe, 2015). Differences in average vegetation between sites were determined with Kruskal-Wallis tests, which do not assume normality as Shapiro-Wilk tests showed data were not normally distributed and transformations were not successful. Furthermore, each site had unequal numbers of data points so samples were unbalanced. R package ‘yarrr’ was used to create raw data, descriptive and inferential statistic (RDI) plots which show data distribution to detect skew or variance, the mean and range of the data and 95% confidence limits (Phillips, 2015). 2.5.2 Principal Component Analysis (PCA) PCA is a dimension reduction tool which condenses predictor variables into smaller sets with lower autocorrelation while retaining most of the information (Perez, 2017) by combining various matrices to capture patterns within the data (Wold et al., 1987). Using vegetation height, percentage ground cover and vegetation structure to visually represent grazing intensity showed patterns and variation between each site and guided further analysis. To aid interpretation of results, Spearman’s Rank correlation coefficient tests were carried out to investigate relationships between each parameter and PC value (Howland et al., 2014).
34

2.5.3 Generalised Linear Models (GLM)

GLMs identified relationships between reptile abundance and grazing intensity.
Canopy cover is included as a covariate as it may affect abundance but is not a
measure of grazing intensity. The model for this analysis is:

Reptile Abundance ~ Vegetation Height + Percentage Cover + Vegetation Structure
                                 + Canopy Cover + Ɛ

      The data were over-dispersed, due to correlations between variables identified
with a Spearman’s Rank correlation co-efficient test. To account for this, negative
binomial error structure was used with a logit link function. A chi-squared was used to
compare the residual deviance with the residual degrees of freedom to show the
negative binomial structure fits the data (Hinkelman, 2012). This method was also
used to investigate the effects of temperature, wind speed and cloud cover on reptile
abundance, as these could have affected the results. Akaike’s Information Criterion
(AIC) values are reported for each analysis, used to assess and select among
ecological models (Richards, 2008). Pseudo R-squared values were calculated,
allowing relative measures among similar models to indicate how well each model
explains variance in the response variable. The nagelkerke function of R package
‘rcompanion’ was used, which adjusts the result to a maximum value of 1 (all variation
explained) (Mangiafico, 2016).

2.5.4 Occupancy Modelling

When surveying, it is unlikely all present individuals will be found, but this does not
imply absence if detection probability is lower than 1 (Mackenzie et al., 2002).
Occupancy is the probability that a randomly sampled plot is occupied by a species.
Detection is the probability an animal is captured, given its presence (Larson, 2014).

      Each site was divided into equally-sized patches (fig. 3, 4, 5) with 24 at Eelmoor,
22 at Foxlease and 20 at Frensham Flashes. Patch occupancy models were used to
analyse dynamics of species ranges while accounting for poor detection probability,
using vegetation parameters and canopy cover as predictors of abundance. For
patches with more than one tin, averages were taken. The model assumes occupancy
is closed within seasons, and there are no false positives (Kery et al., 2013). It also
35 follows the basic assumption that local dynamics are difficult to model, so reduces this down to presence and absence data, necessary in large scale ecological studies (Steinberg & Kareiva, 1997). The R package ‘unmarked’ was used, providing a simple framework for occupancy analysis (Fiske & Chandler, 2012). Empirical Bayes- Estimate of occupancy was calculated to give the actual proportion of occupied patches, with a maximum of 1 (all patches occupied) (Rahman & Han, 2018). Post- hoc chi-squared analysis was used to compare occupancy estimates to 1. Estimated detection probabilities were also given. 2.5.5 Heat Mapping The observed abundance of reptile species was mapped using opensource ‘heatmapper’ software (Babicki et al., 2016) to create maps of each site, showing ‘hotspots’ of high reptile abundance. These were compared to patch occupancy estimates and used to infer which areas may be occupied.
36

3. RESULTS

3.1 Management Approaches

3.1.1 Reptile Abundance

Figure 6 shows the difference in observed and expected reptile abundance between
the three sites. As each site had a different number of tins, total abundance was
divided by the number of tins per site to acquire an abundance estimate per tin.
Expected abundance was calculated as equal abundance at each site, as expected
by null hypothesis 1.

      There is a difference between observed and expected raw abundance (chi-
squared= 143.5, d.f.= 2, p
37
a
b
Figure 6: a) reptile abundance comparison across sites.
b) reptile abundance per tin comparison across sites.38
3.1.2 Species Proportions
Figure 7 shows observed proportions of each species at each site. Expected
abundance is calculated as equal proportions of each species at each site, as
expected by null hypothesis 2.
Figure 7: proportions of species found at each site. AD: Adder. CL: common lizard.
GS: grass snake. SL: sand lizard. SS: smooth snake. SW: slow worm.
There is a difference in the observed and expected frequencies of reptile
species found at each site (chi-squared= 191.5, df= 10, p39
3.1.3 Habitat Differences
Proportions of tins in each habitat type was calculated as the expected proportion of
reptile abundance, as expected by null hypothesis 3. The proportion of reptiles in each
habitat type is the observed abundance. Figure 8 shows this comparison.
At Eelmoor, there was no difference in the observed and expected abundance
of reptiles (chi-squared= 6, d.f.= 4, p= 0.20024488). However, at Foxlease and
Frensham Flashes there was a difference (chi-squared= 25.7, d.f.= 4, p= 3.633-5; chi-
squared= 43.8, d.f.= 4, p= 1-8) with more reptiles in mire and fewer in wet heath than
expected, shown by post-hoc testing. Null hypothesis 3 can be rejected regarding
Foxlease and Frensham Flashes as differing habitat types support different reptile
abundance, but cannot be rejected regarding Eelmoor.40
a
b
c
Figure 8: reptile abundance (observed) and number of tins (expected abundance)
within each habitat type. a) Eelmoor Marsh, b) Foxlease and Ancells Meadows, c)
Frensham Flashes.41
3.1.4 Vegetation Differences
Data were not normally distributed (W= 0.98, p= 0.02207; W= 0.72, p= 5.539-15; W=
0.96, p= 2.879-4; W= 0.94, p= 1.796-5) and could not be transformed requiring non-
parametric Kruskal-Wallis tests. Figure 9 shows differences in vegetation parameters
between sites.
a b
c d
Figure 9: Raw data, descriptive and inferential statistic plots showing differences in a)
vegetation height b) percentage ground cover c) vegetation structure and d) canopy
cover between Eelmoor Marsh (EEL), Foxlease and Ancells Meadows (FOX) and
Frensham Flashes (FLA). These show distribution, mean and range of the data, and
inference bands showing 95% confidence limits.
There were differences in vegetation height (Kruskal-Wallis chi-squared=
27.17, d.f.= 2, p= 1.258-6), vegetation structure (Kruskal-Wallis chi-squared= 33.93,
d.f.= 2, p= 4.283-8) and canopy cover (Kruskal-Wallis chi-squared= 22.99, d.f.= 2, p=
1.018-5) between each site. There was no difference in percentage ground cover
(Kruskal-Wallis chi-squared= 5.92, d.f.= 2, p= 0.05174). Null hypothesis 4 can be
rejected for three vegetation parameters, but not regarding percentage ground cover.42
3.1.5 Prey Abundance
Figure 10 shows total observed abundance of prey species found at each site.
Expected abundance was calculated as equal abundance at each site, as expected
by null hypothesis 5.
Figure 10: total abundance of amphibian and small mammal prey at each site.
There is a difference in the observed and expected abundance of amphibians
at each site (chi-squared= 10.75, d.f.= 2, p=0.004631) and small mammals (chi-
squared= 12.8, d.f.= 2, p=0.00163). Post-hoc testing showed more amphibians than
expected at Foxlease, and fewer small mammals at Frensham Flashes. Null
hypothesis 5 can be rejected as each site supports varying prey abundance.43
3.2 Principal Component Analysis
Figure 11 shows the outcome of PCA.
Vegetation Structure
Figure 11: the outcome of PCA of vegetation parameters at each site, Eelmoor Marsh
(EEL), Foxlease and Ancells Meadows (FOX) and Frensham Flashes (FLA). The
size of the points represents the abundance of reptiles found at that location.44
Table 3: correlations between principle components and vegetation parameters.
Vegetation Height (mm) Ground Cover (%) Vegetation Structure
S p-value S p-value S p-value
PC1 78544045
Figure 12: relationships between reptile abundance and vegetation height,
percentage cover, vegetation structure and canopy cover. Regression lines show
direction of relationship.
Weather parameters were assessed to account for effects of variation in
temperature, wind speed and cloud cover. Figure 13 shows their effects across the
survey period. Data are over-dispersed with a dispersion parameter of 11.7, likely due
to high numbers of zeros as there are no correlations between variables (S= 3079.2,
p= 0.1053; S=2647.3, p= 0.4812; S=1538, p= 0.1138). When using negative binomial
error structure there is no difference between residual deviance and residual degrees
of freedom (p= 0.11156), showing the error structure fits the data (Hinkelman, 2012).
There is no relationship between reptile abundance and temperature (z2,20=
1.235, p= 0.21668), wind speed (z2,20= -0.701, p= 0.48338) or cloud cover (z2,20= 1.26,
p= 0.2075). The model has an AIC value of 174.7, and a pseudo R-squared value of
0.1.46 Figure 13: relationships between reptile abundance and temperature, wind speed and cloud cover. 3.4 Occupancy Models Figure 14 shows occupancy and detection probabilities at each site. Figure 14: Empirical Bayes-Estimate of occupancy and detection probabilities at each site.
47
Patch occupancy estimates are very high under all management systems,
suggesting almost all patches are occupied. Empirical Bayes-estimates give exact
numbers of occupied patches: 22 at Eelmoor and Foxlease and 18 at Frensham
Flashes. Chi-squared analysis shows no difference between empirical Bayes-
estimates and occupancy of 1, as expected by null hypothesis 7 (chi-squared= 0.02,
d.f.= 2, p= 0.99) which must be rejected as all areas show high patch occupancy
regardless of grazing intensity. Conversely, detection estimates are low, suggesting
many more reptiles are present at all sites than were found during this study.
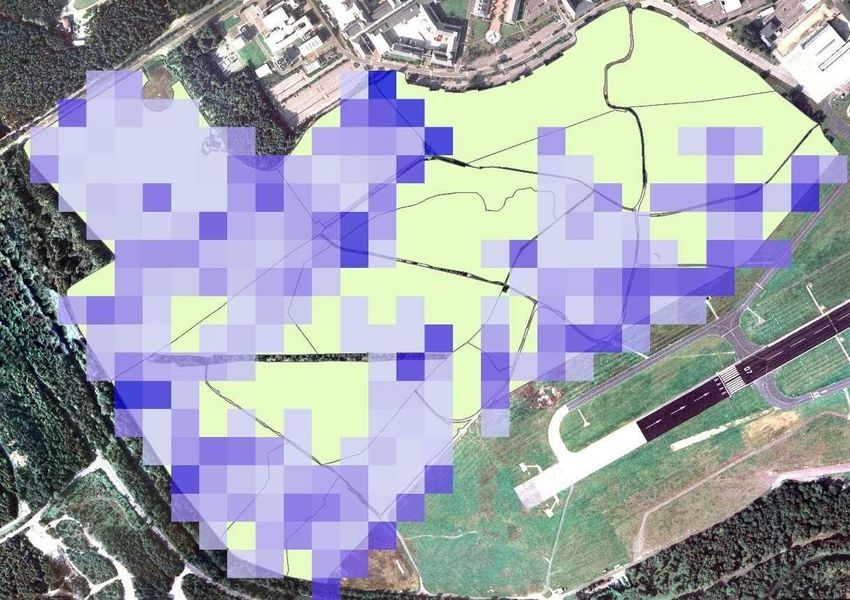
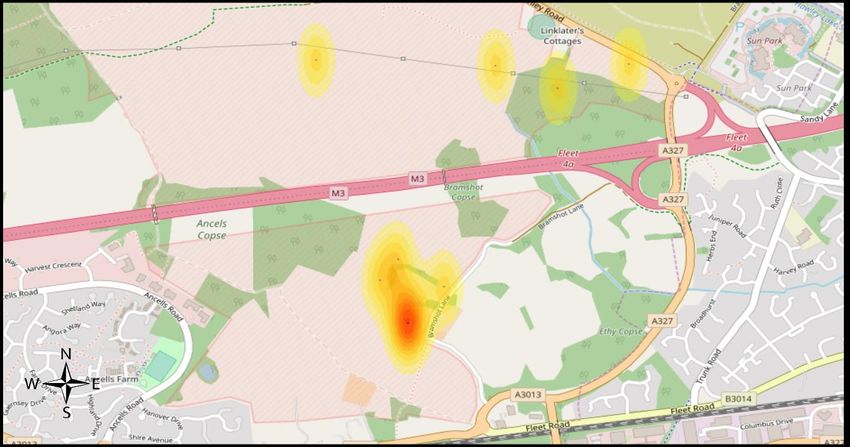
3.5 Heat Mapping
Figure 15 shows distributions of recorded reptiles. At Eelmoor, ‘hotspots’ of
abundance are spread amongst habitat types, as suggested by figure 8a. At Foxlease,
highest abundance is within grassland with others spread through mostly mire (see
figure 8b) and at Frensham Flashes, highest abundances are within dry heath and
mire (see figure 8c).a 48
b
c
Figure 15: heat maps of observed reptile abundance of a) Eelmoor Marsh, b) Foxlease
and Ancells Meadows, c) Frensham Flashes. Areas with no colour show where no
reptiles were found. Created using ‘heatmapper’ software (Babicki et al., 2016).49
4. DISCUSSION
Research on how reptiles respond to grazing is largely contradictive, with responses
driven by intensity and management systems. However, there is little specific research
into these differing systems. Three systems under varying intensities were compared
to identify how each modifies habitat structure and drives reptile assemblage, and
recognise which is most suitable for conservation grazing. The results support
research finding benefits of free-roaming grazing, but find new evidence showing
rotational grazing is disadvantageous to reptile assemblages.
4.1 Grazing Management Systems
Comparison of management systems showed that low-stocking density of free-
roaming grazers supported high numbers of reptiles, almost equal to the non-grazing
condition. This system is successful in replicating the more natural management of
scraping and mowing, with low-intensity grazing that is driving habitat change, but is
not too intense to cause over-grazing. This vegetation provides optimal reptile habitat,
with intermediate height, high ground cover, heterogeneric structural complexity and
low canopy cover (Edgar et al., 2010). The robust highland cattle are well-adapted to
grazing coarse vegetation (Grazing Animals Project, 2001), grazing equally between
habitat types (appendix 5, figure 4) allowing even reptile distribution, supporting null
hypothesis 5. All five reptile species are well-supported, especially slow worms due to
available open habitat for basking (Edgar et al., 2010; Inns, 2011). High prey
abundance is vital for reproductive success, and is positively correlated with female
body weight (Reading, 2004). Adder populations are well-supported by small mammal
prey however grass snakes may be hindered by fewer amphibians, although prey
estimates are likely inaccurate as surveys were reptile-specific.
Despite finding no differences between reptile abundance per tin, rotational
grazing supported far fewer reptiles. Rotations create disparity between grazed and
non-grazed fields, with some short vegetation and some overgrown, neither suitable
for reptiles (Edgar et al. 2010; Sato et al. 2014). Higher average vegetation and canopy
cover restricts basking sites and increases over-shading causing degradation of
important micro-habitat features (Cox & Temple, 2009; Pike et al., 2011). There were
more common lizards than expected, possibly as shorter vegetation provided
preferred open habitat (Edgar et al., 2010), however the sample is too small to draw50
conclusions and with more data proportions may change. Thresholds between
grassland and young heathland can be difficult to assess (Ejrnæs et al., 2008), and at
Foxlease areas classified as ‘wet heath’ were very similar to ‘grassland’. C. vulgaris
takes 40 years to mature and reaches one metre (Watt, 2018), which Foxlease’s 10-
year old vegetation is far from. As reptiles are associated with mature heather, this
little amount of heath could explain low abundance (Edgar et al., 2010). Furthermore,
these smaller patches are more susceptible to negative effects of grazing and
conversion to grassland (Moore, 1962), with development further hindered by public
access (Cox & Temple, 2009). High numbers of amphibians and small mammals show
potential for sustaining reptiles if habitat quality were improved.
Habitat management through scraping and mowing at Frensham Flashes
provided intermediate vegetation height, high ground cover and low canopy cover
required by reptiles (Edgar et al., 2010). Vegetation is predominantly uniform dry and
wet heathland with little variation in structural complexity, as shown by PCA and is
driven by lack of grazing (Pielou, 1966; Howland et al., 2014). The site supports large
C. austriaca populations preferring denser, less open areas due to lower body
temperature requirements (Edgar et al., 2010). If excluded from analysis, total
abundance is lower suggesting this habitat does not suit other reptile species despite
targeted management to provide habitat for all. However, site comparisons are biased
as smooth snakes were not present at all sites and may thrive equally well. Fewer
small mammals and amphibians at Frensham Flashes suggests a prey shortage,
perhaps as small mammals are also supported by heterogeneity in vegetation
structure (Spellerberg, 1989), however populations can be harmed by cattle grazing
(Read & Cunningham, 2010). Creating suitable reptile habitat through grazing could
also be detrimental to smooth snakes, reducing their reproductive rate (Reading &
Jofre, 2015) so increasing heterogeneity through other methods is favoured. Although
there are no controlled grazers, wild deer graze across heathland (Hester et al., 1999)
with large populations increasing fragmentation and grassland conversion (Hester &
Baillie, 1998). Negative effects are enhanced on slopes, with uphill grazing and
downhill trampling (Hester & Baillie, 1998) affecting reptiles relying on south-facing
slopes. Low-intensity deer grazing may increase vegetation quality at Frensham
Flashes, explaining some of the similarities to Eelmoor, however could hinder
heathland restoration at Foxlease as cattle grazing of M. caerulea promotes spring
growth, providing forage for deer and further increasing damage (Gordon, 1988).51
Reptile tins are often waterlogged in wetland areas, reducing sampling
effectiveness (Mitchell et al., 1993) due to reptile’s sensitivity to heat, humidity and soil
wetness (Grant et al., 1992). However, at Foxlease and Frensham Flashes there were
more reptiles than expected in mire. As the tins in Mitchell et al’s study (1993) were in
wooded areas, high shading was not accounted for and could have affected this result.
Some species also prefer damper habitats (Edgar et al., 2010). In Mediterranean
countries, N. natrix are found almost exclusively in wet areas (Capula et al., 1994),
perhaps as a means of thermoregulation. As spring temperatures were unusually high
(Met Office, 2018), reptiles may have sought damper habitats to cool down. There is
some suggestion of avoidance behaviour by reptiles, as livestock breeds do not move
evenly between habitat types (Rook et al., 2004) and some avoid mire when given the
choice (Bullock & Pakeman, 1997). Again, Foxlease’s small sample may show an
inaccurate depiction of reptile distribution between habitat types and with larger
samples proportions may equalise, as expected by tin distribution and supporting null
hypothesis 5.
4.2 Relationships between Reptile Abundance and Grazing Intensity
Low-level disturbance through grazing increases heterogeneity and drives suitable
habitat (Bullock & Pakeman, 1997; Wilkie, 2013; Howland et al., 2014), thereby
benefitting reptiles (Spellerberg, 1989). There is little research on ideal sward height,
but intermediate height is thought optimal as basking opportunities are lost in higher
vegetation (Edgar et al., 2010) and low vegetation does not provide adequate shelter
from adverse weather and predators (Kreulen, 1979; Sato et al., 2014). This is
supported by this study, as abundance decreased in higher vegetation, opposing null
hypothesis 6. Abundance also increased with variation in structural complexity,
providing micro-habitat structures such as basking sites and shelter required by all
reptiles (Garden et al., 2007; Edgar et al., 2010; Santos et al., 2016). Insufficient
grazing causes increased shading as vegetation succeeds further towards its woody,
dense climax (Edgar et al., 2010), leading to degradation of key micro-habitat features
(Cox & Temple, 2009) and lower abundance particularly in open-habitat species (Pike
et al., 2011). Rotational grazing systems are not intense enough to halt this
succession, creating heavily over-grown areas with high canopy cover and low reptile
abundance. Connectivity between and within patches and across landscapes could
be restored by implementing low-stocking density grazing systems to drive habitat
changes and create transitional zones to allow movement of metapopulations.You can also read