Barn Owls select uncultivated habitats for hunting in a winegrape growing region of California - Wildlife
←
→
Page content transcription
If your browser does not render page correctly, please read the page content below
AmericanOrnithology.org

                                                                                                                    Volume 123, 2021, pp. 1–15
                                                                                                              DOI: 10.1093/ornithapp/duaa058

RESEARCH ARTICLE

Barn Owls select uncultivated habitats for hunting in a winegrape growing
region of California

                                                                                                                                                 Downloaded from https://academic.oup.com/condor/advance-article/doi/10.1093/ornithapp/duaa058/6119084 by guest on 26 January 2021
Xerónimo A. Castañeda,1,2 Allison E. Huysman,1 and Matthew D. Johnson1,*,
1
 Department of Wildlife, Humboldt State University, Arcata, California, USA
2
 Audubon California, Sacramento, California, USA
* Corresponding author: matt.johnson@humboldt.edu
Submission Date: November 30, 2019; Editorial Acceptance Date: August 19, 2020; Published January 25, 2021

    ABSTRACT
    Large-scale conversion of uncultivated land to agriculture threatens wildlife and can diminish ecosystem services pro-
    vided by nature. Understanding how wildlife provision ecosystem services may incentivize wildlife conservation in ag-
    ricultural landscapes. Attracting Barn Owls (Tyto furcata) to nest on farms for pest management has been implemented
    worldwide but has not been evaluated in vineyard agroecosystems. Napa Valley, California, is a renowned winegrape
    growing region, and viticulturists encourage Barn Owl occupancy to help minimize damage from Botta’s pocket gophers
    (Thomomys bottae) and voles (Microtus spp.). This study modeled the use of habitats in space and time by hunting Barn
    Owls, providing information about their potential to provide the critical ecosystem service of pest consumption. We
    used global positioning system tags to track hunting owls and used a resource selection function to compare used and
    available habitats. We constructed the intensity of use and home range-movement maps using a time local convex hull
    analysis from location data. We found that Barn Owls selected uncultivated habitats when hunting, some of which were
    relatively rare on the landscape. Approximately, one-third of Barn Owl hunting locations occurred in vineyards, but this
    use was out of proportion to the availability of vineyards, which comprised 50% of the area around nest boxes. The owls’
    use of vineyards increased with decreasing amount of selected uncultivated habitat in the landscape. However, as re-
    ported by a previous study, the occupancy of nest boxes in vineyards increases with uncultivated habitats nearby. Future
    research should model landscape composition to determine the amount of preferred habitat necessary to support oc-
    cupancy as well as hunting in vineyards. A true test of pest management by Barn Owls awaits experimentation coupled
    with monitoring rodent populations.
    Keywords: ecosystem service, habitat heterogeneity, habitat selection, habitat use, pest management, Tyto furcata,
    vineyard

    LAY SUMMARY
    • Agricultural landscapes are composed of a variety of habitats, both cultivated and uncultivated, and it is vital to
      understand how wildlife use these areas, especially for predatory birds that may help control agricultural pests.
    • We used Global Positioning System telemetry to examine the selection of habitats for hunting by Barn Owls breeding
      in nest boxes in winegrape vineyards.
    • Barn Owls selected uncultivated habitats, such as oak savanna, riparian forest, and grasslands for hunting, some of
      which were relatively rare on the landscape.
    • Nonetheless, approximately, one-third of Barn Owl hunting locations occurred in vineyards, suggesting their predation
      of rodent pests could be useful for farmers.

    Tyto furcata selecciona hábitats no cultivados para cazar en una región vitivinícola de California
    RESUMEN
    La conversión a gran escala de tierra no cultivada a agricultura amenaza la vida silvestre y puede disminuir los servicios
    ecosistémicos brindados por la naturaleza. Entender cómo la vida silvestre brinda servicios ecosistémicos puede
    incentivar su conservación en los paisajes agrícolas. Atraer individuos de Tyto furcata a que aniden en granjas para el
    manejo de plagas ha sido implementado en todo el mundo, pero no ha sido evaluado en agro-ecosistemas de viñedos. El
    Valle de Napa en California es una región vitivinícola famosa, y los vitivinicultores alientan la ocupación de T. furcata para
    ayudar a minimizar los daños de los topos de la especie Thomomys bottae y de los campañoles del género Microtus spp.
    Este estudio modeló el uso de hábitat en espacio y tiempo por parte de individuos de T. furcata que cazan, brindando

Copyright © American Ornithological Society 2021. All rights reserved. For permissions, e-mail: journals.permissions@oup.com.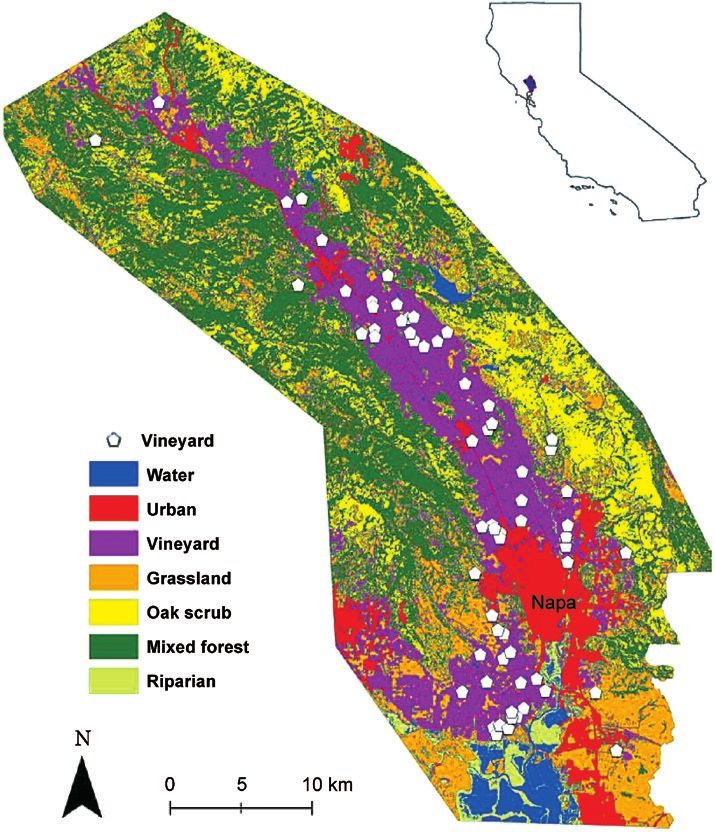
2   Barn Owl habitat selection in vineyard ecosystem                           X. A. Castañeda, A. E. Huysman, and M. D. Johnson

    información sobre su potencial para ofrecer el servicio ecosistémico crítico de consumo de plagas. Usamos marcadores
    en un sistema de posicionamiento global para seguir a los individuos que cazan, y usamos una función de selección
    de recursos para comparar a los hábitats usados vs. los disponibles. Elaboramos mapas de intensidad de uso y de
    movimiento en los rangos de hogar mediante un análisis de Envoltura Convexa Local de Tiempo (t-LoCoH, por sus siglas
    en inglés) a partir de datos de localización. Encontramos que T. furcata seleccionó hábitats no cultivados cuando caza,
    algunos de los cuáles fueron relativamente raros en el paisaje. Aproximadamente un tercio de las localizaciones de caza
    de T. furcata se ubicaron en viñedos, pero este uso fue desproporcionado con relación a la disponibilidad de viñedos,
    que representó el 50% del área alrededor de las cajas nido. El uso de viñedos por parte de T. furcata aumentó con una

                                                                                                                                    Downloaded from https://academic.oup.com/condor/advance-article/doi/10.1093/ornithapp/duaa058/6119084 by guest on 26 January 2021
    cantidad seleccionada decreciente de hábitat no cultivado en el paisaje. Sin embargo, como se reportó en un estudio
    anterior, la ocupación de las cajas nido en los viñedos aumentó con los hábitats no cultivados cercanos. Investigaciones
    futuras deberían modelar la composición del paisaje para determinar la cantidad de hábitat preferido necesaria para
    promover la ocupación así como la caza en los viñedos. Se necesita un verdadero test experimental de manejo de plagas
    por parte de T. furcata junto con un monitoreo de las poblaciones de roedores.
    Palabrasclave: función de selección de recursos, heterogeneidad de hábitat, manejo de plagas, selección de
    hábitat, servicio ecosistémico, telemetría, Tyto furcata, uso de hábitat, viñedo

INTRODUCTION                                                      in the United States, an industry valued at nearly $3 billion
                                                                  in 2014 (CDFA 2019). Within California, Napa Valley wine
Increasing human population sizes and rising per capita           and associated tourism have proven to be a dominant con-
consumption accelerate the conversion of uncultivated             tributor to both state and national economies and show no
lands to agriculture (Tanentzap et al. 2015), resulting in        signs of slowing down (Stonebridge Research Group 2012).
drastic declines in habitat quantity and quality that are pri-    Due to California viticulture’s heightened visibility in the
mary threats to biodiversity (Green et al. 2005, McLaughlin       public eye, its economic importance, and its impacts on
2011, Balmford et al. 2012). Expansion and intensification        wildlife, growers are seeking ways to promote more envir-
of agriculture not only diminish habitat quality for many         onmentally sustainable practices while maintaining profit-
species; increased use of agrochemical inputs (Matson             ability (Poitras and Getz 2006, Viers et al. 2013).
et al. 1997, Grismer and Asato 2012) can impair the ability          Integrated pest management is critical for improving
of agroecosystems to provide nonmarketed services, such           sustainability in agricultural industries. In Napa Valley,
as water purification, pollination, and pest control (Swinton     Botta’s pocket gophers (Thomomys bottae) and voles
et al. 2007). These concerns have stimulated research in al-      (Microtus spp.) are rodents that reduce farm function-
ternative management practices to alleviate detrimental           ality, threaten the health of the vines, and cause significant
impacts on ecosystems while also promoting factors that           economic losses (Ross 2009, Salmon and Baldwin 2009,
support nonmarket services (e.g., wildlife; Power 2010,           Salmon and Gorenzel 2010). Anderson et al. (2012) esti-
Hannah et al. 2013). Many of the studies have shown that          mated a 4% yield loss due to rodents and costs of $22 to $27
wildlife can benefit agroecosystems by enhancing pest             per acre for rodent control. By cutting roots and gnawing
control or pollination (Kremen and Merenlender 2018),             bark, rodents can slow the growth and productivity of
including services delivered by birds (Sekercioglu et al.         vines and, in extreme cases, kill the plants (Ross 2009).
2016). Thus, managing for wildlife that provide beneficial        Traditional rodent control techniques include trapping
services may be valuable to farmers and contribute to re-         and rodenticides, which must be evaluated with respect to
ducing negative impacts caused by expansion and intensi-          efficacy, cost, and safety to workers and the environment
fication of agriculture across the globe (Ricketts et al. 2004,   (Baldwin et al. 2014).
Green et al. 2005, Lindell et al. 2018).                             Integrating the use of natural predators with more
   In regions with unique and sensitive habitats, land-use        traditional techniques can produce effective management
conversion continues to be the greatest threat to ecosystems      of vertebrate pests (Bottrell 1979, Kogan 1998, Kross
(Myers et al. 2000, Wood et al. 2013). The Mediterranean          et al. 2012, Baldwin et al. 2014, Coeurdassier et al. 2014).
biome, which includes portions of California, is home             Life history attributes of Barn Owls (Tyto furcata) sug-
to some of the highest concentrations of endemism on              gest they could be part of such pest management systems
the planet but remains minimally protected (Myers et al.          (Labuschagne et al. 2016, Johnson et al. 2018). Nesting
2000, Viers et al. 2013). Despite this biome’s sensitivity and    Barn Owls are central place foragers, meaning their use
recognized importance to biodiversity, there has been a           of space centers on a nest site to which they frequently re-
worldwide increase in the conversion of land to agriculture       turn (Rosenberg and McKelvey 1999). They produce large
within the Mediterranean biome, particularly for the pro-         numbers of young, nest in close proximity to each other,
duction of winegrapes (Viers et al. 2013). California vine-       are easily attracted to nest boxes, and feed primarily on
yards account for over 90 percent of all winegrapes grown         rodents (Lyman 2012, Browning et al. 2016). Barn Owls

Ornithological Applications 123:1–15, © 2021 American Ornithological Society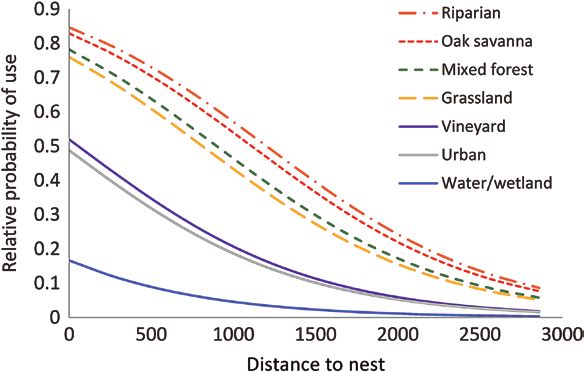
X. A. Castañeda, A. E. Huysman, and M. D. Johnson                           Barn Owl habitat selection in vineyard ecosystem   3

are cosmopolitan, found in habitats ranging from dry             and sustain Barn Owl hunting in and around their farms
savannas to rainforests, and adjust well to human settle-        (sensu Lindell et al. 2018).
ments and farms throughout North America and Europe                 In this study, we sought to document hunting habitats
(Johnsgrad 1988, Taylor 1994). Despite their widespread          of Barn Owls in Napa’s winegrape vineyards by addressing
distribution, Barn Owl populations still face significant        the following objectives: (1) determine hunting habitat se-
loss of nest sites and hunting habitats in some places as        lection by comparing habitats used to the overall habitat
well as threats from rodenticides and roadway mortality          availability, (2) model the intensity of use of different

                                                                                                                                    Downloaded from https://academic.oup.com/condor/advance-article/doi/10.1093/ornithapp/duaa058/6119084 by guest on 26 January 2021
(Colvin 1985, Taylor 1994, Bond et al. 2005, Hindmarch           habitats within the owls’ hunting range, and (3) examine
et al. 2012). In unaltered habitats, Barn Owls nest in cav-      the effect of landscape composition on Barn Owl use of
ities found in trees or rock faces or create cavities through    vineyards when hunting. This study provides practical in-
excavation (Martin 1973, Taylor 1994). Where natural nest        formation to farmers on how to attract Barn Owls, and it
sites are limited, Barn Owls use human-made structures           advances our understanding of how landscape compos-
such as barns or artificial nest boxes (Marti et al. 1979,       ition affects the delivery of regulating services such as pest
Taylor 1994). The potential for natural predators, such as       management by a highly mobile predator.
Barn Owls, to help control rodent pests may be an in-
centive for farmers to adapt integrated pest management          METHODS
practices that attract and sustain wildlife (Labuschagne
et al. 2016).                                                    Study Area
   The practice of attracting Barn Owls to nest on farms         Napa Valley is ~100 km north of San Francisco, California
for pest management has been implemented in rice and             (Figure 1). The valley sits between the Vaca Mountains to
oil palm fields in Malaysia (Duckett 1976, Wood and Fee          the east and the Mayacamas Mountains to the west (Napa
2003), alfalfa production in Israel (Meyrom et al. 2009, Kan     Valley Vintners 2015). The valley stretches for 80 km from
et al. 2014), row crops in Utah (Marti 2010), and sugarcane      the flats near San Pablo Bay in the south to the peak of
fields in Florida (Martin 2009). However, the use of Barn        Mount Saint Helena at 1,323 m in the north (Napa Valley
Owls for pest management in vineyards has only been              Vintners 2015). A mild Mediterranean climate hosts native
recommended and not robustly evaluated (Byron 2008,              vegetation consisting of coastal scrub and grasslands near
Tillmann 2012, but see Browning et al. 2016), and further        the bay to oak woodlands, oak savannas, and mixed for-
examination of this system is warranted (Johnson et al.          ests in the north (Warner 2007). Numerous microclimates
2018). A recent study in Napa Valley vineyards revealed          created by elevation and coastal gradients throughout
that Barn Owls select nest boxes with nearby grassland,          the valley make the region ideal for growing a variety of
mixed forest, and riparian habitats (Wendt and Johnson           winegrape cultivars (Napa Valley Vintners 2015). Total
2017). Open, grass-dominated habitat is also preferred           acreage in winegrape production has increased from
when hunting (Evans and Emlen 1947, Arlettaz et al. 2010,        12,345 ha in 1999 to 17,891 ha in 2019 (45% increase; Napa
Hindmarch et al. 2017), likely because of high rodent abun-      County Agricultural Commissioner’s Office 2019).
dance and accessibility (Taylor 1994). Barn Owls have also          The vineyards in this study have been part of ongoing
demonstrated the ability to hunt successfully in lightly         research started in spring 2014 by Wendt and Johnson
wooded environments as well as along urban edges (Fast           (2017). Vineyards included in the study were distributed
and Ambrose 1976).                                               throughout Napa Valley and varied in size, surrounding
   In a heterogeneous landscape, predators must balance          habitat, urban densities, growing techniques, and nest box
costs and benefits when selecting habitats for hunting           densities (Wendt and Johnson 2017).
(Rosenberg and McKelvey 1999). Highly mobile predators
such as Barn Owls can target hunting efforts in productive       Establishing Occupancy and Nest Box Monitoring
habitats within broad landscapes (Pyke et al. 1977). During      Protocols established by Wendt and Johnson (2017) were
the breeding season when provisioning prey to young, a           used to determine nest box occupancy and subsequent
Barn Owl must balance costs of prey depletion and travel         monitoring for this study. In California, Barn Owls begin
to determine whether hunting close to a nest may be              nest site selection as early as January with first eggs being
more cost effective than traveling further to a more pro-        laid as early as mid-February (Browning et al. 2016). Nest
ductive hunting area (Rosenberg and McKelvey 1999). In           boxes were checked for occupancy from 28 February until
Napa Valley, these balances may influence the likelihood         31 March, 2016. Nest monitoring was done using a GoPro
of a Barn Owl hunting on a vineyard where its nest box is        HERO Session camera, Riverside, California that was
located. Identifying habitat composition across the land-        mounted with an LED flashlight to the end of an extendable
scape and evaluating the hunting range and habitat pref-         pole, allowing access to the nest box opening with min-
erence of Barn Owls can provide useful information to            imal disturbance. The camera was connected wirelessly to
farmers for directing management practices that promote          a smartphone and showed a live feed of nest box contents.

                                                     Ornithological Applications 123:1–15, © 2021 American Ornithological Society
4 Barn Owl habitat selection in vineyard ecosystem X. A. Castañeda, A. E. Huysman, and M. D. Johnson
Downloaded from https://academic.oup.com/condor/advance-article/doi/10.1093/ornithapp/duaa058/6119084 by guest on 26 January 2021
FIGURE 1. Location of Napa Valley within California, ~161 km northeast of San Francisco (inset). Distribution of vineyards (white poly-
gons) that were surveyed for the presence of Barn Owls in spring 2016 (from Wendt and Johnson 2017).
Quantifying Habitat Use attaching the transmitter, 8–12 hr after handling. All moni-
During the 2016 breeding season, March through August toring and handling were approved by Humboldt State
2016, 24 individual female nesting Barn Owls were fitted University’s Institutional Animal Care and Use Committee
with Uria 300 Global Positioning System (GPS) units (IACUC No.15/16.W.43-A; see Acknowledgments).
(Gdynia, Poland). Barn Owls were captured in their nest Only females were tagged because they roost diurnally
box by covering the exit with a flat piece of wood on a pole, in the nest box for several weeks after the chicks hatch,
climbing a ladder to gain access, removing the owls (usu- increasing the likelihood of retrieving the transmitter at
ally through the side door of the box), calming them by a later time. Each telemetry tag was set to record a loca-
covering their heads with a cloth or placing them in a cloth tion once per minute to provide fine temporal scale data
bag, and lowering them to the ground from a ladder for on hunting habitat use. As this study was among the first
processing. Each owl was weighed to ensure they met the to use GPS tags on a bird of this size and with locations
minimum weight requirement and that the GPS unit, which taken so frequently, we experimented with deployment
weighed 13.5 g including harness, did not exceed 3% of the and programming details to optimize battery life and data
owls’ mass (Fair et al. 2010). Transmitters were attached retrieval. Battery life was shorter than initially expected
via a small backpack harness constructed of Teflon ribbon but was optimized by programming tags to not record lo-
that was designed not to impede the bird’s natural mobility cations when within range (~40 m) of a handheld base sta-
(Humphrey and Avery 2014). After the transmitter was at- tion placed directly at the nest box. This also increased the
tached, the owl was placed back in the nest box and the likelihood that all location data were retrieved.
entrance blocked for 10 min to reduce the risk of the owl Tags were deployed on females known to have chicks
flushing from the box. Total handling time did not exceed due to sensitivity to disturbance in earlier stages of nesting
20 min per bird. Telemetry tracking began the night after (i.e. laying and incubation). Barn Owl’s sex was determined
Ornithological Applications 123:1–15, © 2021 American Ornithological SocietyX. A. Castañeda, A. E. Huysman, and M. D. Johnson Barn Owl habitat selection in vineyard ecosystem 5
by the presence of a brood patch. Birds were selected if and their standard errors (β ± 1 SE) for each covariate in
their oldest young were ~10–15 days old at the beginning the top models.
of tag deployment. This stage was selected because it is Determining hunting habitat selection by comparing
after brooding when females are actively hunting to pro- used to available areas. A resource selection function
vision the chicks, but when chicks are still young enough (RSF-logistic model; Manly et al. 2002) was used to com-
to increase the likelihood the tagged female would still be pare used locations (GPS points) to available locations ran-
using the nest box for diurnal roosting 3 to 8 days later. domly distributed within each animal’s home range (i.e.
Downloaded from https://academic.oup.com/condor/advance-article/doi/10.1093/ornithapp/duaa058/6119084 by guest on 26 January 2021
This allowed for tag retrieval after the battery on the tag third order habitat selection, Johnson 1980). Because the
had drained and was no longer collecting locations. A total objective of the study was to understand habitat selected for
of 24 females were tagged; all but 3 tags were retrieved. hunting specifically, telemetry locations were filtered based
The age of young was determined via plumage develop- on criteria that best identified hunting behavior. For each
ment using an aging guide developed by The Barn Owl location, the GPS tags provided a rate of speed in meters
Trust (2015). per second. Locations were considered hunting locations if
they did not exceed a maximum speed threshold of 10 m
Habitat Sampling s–1 and were not stationary (i.e. roosting) for > 10 min at a
Using high-resolution ( 7
yard, grassland, oak savanna, mixed forest, and riparian m s–1 (Roulin 2020). To ensure that no single owl’s locations
(see Appendix A for a detailed description of each habitat weighted the model disproportionately, an equal number
category). Non-vineyard row crops were virtually absent of hunting locations (n = 260) were randomly selected for
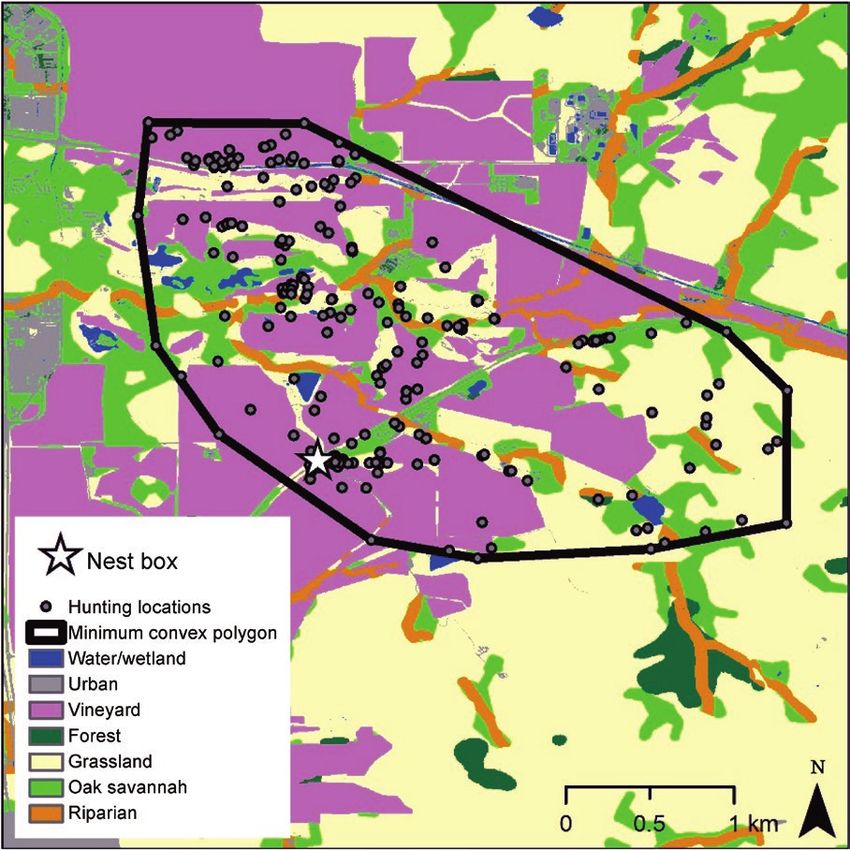
(6 Barn Owl habitat selection in vineyard ecosystem X. A. Castañeda, A. E. Huysman, and M. D. Johnson
Downloaded from https://academic.oup.com/condor/advance-article/doi/10.1093/ornithapp/duaa058/6119084 by guest on 26 January 2021
FIGURE 2. An example of habitat classification within and surrounding the MCP created using 260 randomly sampled hunting loca-
tions from a nesting female Barn Owl in Napa Valley, CA, spring 2016. Gray circles represent GPS locations and the white star represents
the nest box for this individual owl.
shortest possible sampling interval over the longest pos- defined as when a bird moved from one hunting habitat to
sible period (Rooney et al. 1998) appropriate for the study another, excluding when this occurred between the last lo-
question and to restrict inferences to the temporal and cation on one day and the first location on the next (n = 930
spatial scope justified by that time frame (Otis and White total habitat changes). Then, we calculated the duration of
1999). time between habitat changes and plotted frequency distri-
We conducted 4 analyses to examine autocorrelation butions. Fourth, we calculated Moran’s I on the residuals of
and spatial dependence of variables used in the RSF habitat the top-performing habitat selection model (see below for
selection analysis, using all telemetry locations classi- model section methods).
fied as hunting locations (n = 5,042; see below). First, These analyses showed that while the data were spa-
we calculated spatial (cross-) Mantel correlograms for tially autocorrelated (e.g., Moran’s I of model resid-
all continuous variables (i.e. “distance to” variables; see uals = 0.283), the mode time to change habitats was only
below) using the correlog function in the ncf package of R 1 min, and > 50% of all hunting habitat changes occurred
(Bjørnstad 2005). Second, we performed a data series auto- within 4 min (Appendix B). These patterns, combined with
correlation (time lag) analysis, shifting telemetry locations suggestions to use the shortest possible sampling interval
by 1–30 sequential positions and calculating the Pearson’s over the longest possible period, led us to retain all loca-
autocorrelation for continuous variables. For the categor- tions after randomly subsampling down to 260 locations
ical habitat variable, we calculated the proportion of loca- per owl, yielding a total of 2,860 telemetry locations used
tions that remained in the same habitat category after the in the RSF. The points ranged over a sampling period of
location time lag. Third, we identified all habitat changes, 6.00 ± 0.71 days per owl, which was the most possible
Ornithological Applications 123:1–15, © 2021 American Ornithological SocietyX. A. Castañeda, A. E. Huysman, and M. D. Johnson Barn Owl habitat selection in vineyard ecosystem 7
given battery life and logistics, and the time between se- vineyards. To examine the potential importance of land-
quential analyzed locations for the same owl on the same scape composition on the delivery of regulating services
day ranged from 1 to 321 min (mean = 9.71 ± 0.60 min). such as rodent pest removal, the proportion of each owl’s
Our primary intent for this model set was to examine hunting points that were within vineyard habitat was mod-
the effect of habitat and proximity to resources on the owls’ eled, using linear regression, against the proportion of un-
space use. Recognizing that nesting owls are central place cultivated habitats (riparian, oak savanna, grassland, and
foragers, predictor variables used in the RSF were habitat mixed forest) within the bird’s hunting range. Competing
Downloaded from https://academic.oup.com/condor/advance-article/doi/10.1093/ornithapp/duaa058/6119084 by guest on 26 January 2021
category (7 categories), distance from nest box (m), and dis- models were again compared with a tiered approach. First,
tance to each habitat category (m). We took a tiered model we determined whether each variable best predicted pro-
selection approach to determine which habitat was the best portion of hunting locations in vineyard with a linear or
predictor of use. First, we created a competing model set pseudo-threshold function form (i.e. logarithmic func-
with each distance to habitat as a unique model. From this tional form, Franklin et al. 2000). Then, we tested a priori
approach, we determined distance to oak savanna was the hypothesized combinations of these variables based on the
best distance variable as a predictor of use (see Results). previous habitat selection results and Barn Owl natural
Next, we included all additive combinations of habitat cat- history (Taylor 1994) while not including collinear (r ≥ 0.6)
egory, distance from the nest box, and distance to oak sa- predictor variables. Coefficients are reports ± 1 SE.
vanna habitat as predictor variables in candidate model
sets. All distances were scaled to a range of 0 to 1 for these
analyses, as is commonly practiced in RSF analyses (Manly RESULTS
et al. 2002), then back scaled for a clearer interpretation of
the effects of distance on habitat selection. Individual bird A total of 9,526 GPS telemetry locations were obtained
identity was included as a random effect in the models. from 20 owls (locations per owl: 476.3 ± 95.8). Of all loca-
Habitat selection model evaluation. The top model in tions, 26% were within grassland habitat, 26% within vine-
the candidate set, as determined by the lowest AICc score, yard, 25% within oak savanna, 12% within riparian habitat,
was evaluated following Boyce et al. (2002) and Johnson and the remaining 11% were spread between urban, mixed
et al. (2006). More specifically, the predicted probability of forest, and water/wetland environments. However, with
use for each used and the available location was calculated, GPS tags programmed to record locations at every minute,
then sorted, and divided into 10 equal bins. The mean pre- the batteries drained much faster than initially expected.
dicted probability of use for each bin was determined and Some of the tags first deployed only lasted about 2 nights
regressed against the proportion of used locations for each (n = 4), but once we optimized the deployment strategy
bin. A strongly predictive model should yield a Pearson’s (see Methods), the tag’s batteries lasted about 8 nights. Due
correlation coefficient near one and a positive slope signifi- to these complications, 9 birds did not have enough loca-
cantly different from zero (Johnson et al. 2006). tion points (8 Barn Owl habitat selection in vineyard ecosystem X. A. Castañeda, A. E. Huysman, and M. D. Johnson
TABLE 1. Results of the model set for an RSF predicted hunting TABLE 2. Coefficients, SEs, and CIs from the top RSF model of
habitat of Barn Owls in Napa Valley, CA, spring 2016. The response Barn Owl habitat use in the Napa Valley, CA, spring 2016.a
variable was used/available locations, and predictor variables in-
Covariateb Coefficient SE 95% CI LLc 95% CI ULd
cluded habitat category, distance to nest, and distance to oak
savanna, with owl identity as a random effect. Models were run Urban 0.22e 0.23 –0.23 0.67
using a generalized mixed model with random effect. Vineyard 0.35 0.11 0.13 0.57
Modela kb Loge(L)c ΔAICcd wie Grassland 1.43 0.12 1.19 1.67
Oak savanna 1.85 0.12 1.61 2.09
Downloaded from https://academic.oup.com/condor/advance-article/doi/10.1093/ornithapp/duaa058/6119084 by guest on 26 January 2021
Habitat + DNest + Dsav + (1|owl_id)f 10 –3,456.45 0.00 0.88 Mixed forest 1.55 0.18 1.20 1.90
Habitat + DNest + (1|owl_id) 9 –3,459.43 3.95 0.12 Riparian 1.98 0.17 1.65 2.31
Habitat + Dsav+ (1|owl_id) 9 –3,633.67 352.43 0.00 Water/wetland –1.34 0.30 –1.93 –0.75
Habitat + (1|owl_id) 8 –3,654.22 391.53 0.00 Dnest –4.07 0.23 –4.52 –3.62
DNest + (1|owl_id) 3 –3,768.25 609.57 0.00 Dsav –0.55 0.22 –0.98 –0.12
Dsav + (1|owl_id) 3 –3,882.42 837.90 0.00
1 + (1|owl_id) 2 –3,964.80 1,000.66 0.00 a
Use ~ Habitat + DNest + Dsav + (1|owl_id); see Table 1 for more de-
tails and abbreviations.
a
Dnest is the distance from nest; Dsav is the distance from oak sa- b
Nine covariates included in the top model.
vanna; habitat is the 7 categories of identified habitat within c
LL, lower limit.
hunting range (see Methods). d
UL, upper limit.
b
Number of parameters. e
Coefficients for habitat categories should be evaluated with re-
c
Loge(likelihood). spect to the mean among all 7 categories (0.87) to infer relative
d
Difference between model AICc and top model AICc. selection.
e
AICc weight.
f
Lowest AICc: 6,932.94.
1,000 m and 50% within 500 m of a birds’ nest box. Among
the 7 habitat categories, the strongest positive predictors
of use were for the uncultivated habitats (Table 2): riparian
(β = 1.98 ± 0.17), oak savanna (β = 1.85 ± 0.12), mixed
forest (β = 1.55 ± 0.18), and grassland (β = 1.43 ± 0.12;
Figure 3), and each had coefficient estimates well above the
overall average coefficient for all habitat categories (0.87).
Distance to oak savanna habitat also showed a negative re-
lationship (β = –0.55 ± 0.22), suggesting locations close to
oak savanna were selected for hunting.
Model evaluation indicated the top model was a strong
predictor of used locations. The linear relationship be- FIGURE 3. An RSF model using locations (i.e. Barn Owl hunting
tween the mean predicted probabilities and the proportion locations within Napa Valley, CA, spring 2016) as a function of
of use within each bin yielded a Pearson’s correlation co- habitat and distance to nest; distance to oak savanna habitat,
efficient of 0.968, and the slope of the regression line was which also appeared in the top model, was held constant (at its
overall mean). Farthest distance traveled was limited to within
significantly different from zero (F1,8 = 118.9, P < 0.01) mean maximum hunting range of all owls, 2.86 km. Uncultivated
with an adjusted R2 of 0.93. The high Pearson’s coefficient habitats (dashed) were the most strongly selected.
suggests that the model explained significant variation in
hunting habitat use by Barn Owls in this system. (β = 7.72 ± 0.79 and β = 1.14 ± 0.75, respectively), sug-
gesting the owls spent relatively more time hunting once
Intensity of Habitat Use arriving to locations farther from these resources (Table 4).
Model selection using AICc indicated that a model with
habitat, distance to nest, and distance to oak savanna was Habitat Composition Effects on Vineyard Use
the best for explaining the intensity of habitat use by hunting Model selection revealed that the proportion of an owl’s
Barn Owls (Table 3). Oak savanna and water/wetland habi- hunting locations that were in vineyard was best ex-
tats had the largest positive coefficients (β = 9.22 ± 1.29 plained by the relative proportion of riparian and oak sa-
and β = 8.68 ± 1.94, respectively; Table 4), suggesting that vanna habitats within an owl’s hunting range (Table 5).
when owls used these habitats, they did so for longer dur- As the log of the proportion of an owl’s hunting range
ations than the other habitats. Distance from nest and comprised of oak savanna increased, the proportion of
distance to oak savanna each had a positive, although com- hunting locations within vineyard declined, and this confi-
paratively weaker, association with intensity of habitat use dence interval (CI) for the coefficient did not overlap zero
Ornithological Applications 123:1–15, © 2021 American Ornithological SocietyX. A. Castañeda, A. E. Huysman, and M. D. Johnson Barn Owl habitat selection in vineyard ecosystem 9
TABLE 3. Results of the competing model set for the intensity of TABLE 5. AICc comparison of a competing model set predicting
habitat use by hunting Barn Owls in Napa Valley, CA, spring 2016. the proportion of Barn Owl hunting locations located within vine-
The response variable was the mean number of locations to a hull yards in Napa Valley, CA, spring 2016. The model set included the
per visit (mnlv; see Methods), and predictor variables included proportion of riparian, oak savanna, grassland, and mixed forest
habitat category, distance to nest, and distance to oak savanna, habitats as predictors; models were run using a generalized linear
with owl identity as a random effect. The models were run using a model.
generalized mixed model with a random effect.
Model ka Loge(L)b ΔAICcc wi d
Modela kb Loge(L)c ΔAICcd wie
Downloaded from https://academic.oup.com/condor/advance-article/doi/10.1093/ornithapp/duaa058/6119084 by guest on 26 January 2021
PRiparian + log(POakS)e 4 16.00 0.00 1
Habitat + DNest + Dsav+ (1|owl_id)f 11 –13,303.82 0.00 1 PRiparian + POakS + log(PGrass) 6 21.73 12.53 0
Habitat + Dsav + (1|owl_id) 10 –13,331.56 53.48 0 + log(PMixedF)
DNest+ (1|owl_id) 4 –13,413.05 204.43 0 PRiparian + log(PGrass) 4 8.27 15.45 0
Habitat + Dsav + (1|owl_id) 10 –13,570.16 530.67 0 PRiparian + log(PMixedF) 5 5.59 20.81 0
Habitat + (1|owl_id) 9 –13,608.42 605.18 0
1 + (1|owl_id) 2 –13,683.73 745.79 0 a
Number of parameters.
Dsav+ (1|owl_id) 4 –13,728.31 832.95 0 b
Loge(likelihood).
c
Difference between model AICc and top model AICc.
a
Dnest is the distance from nest; Dsav is the distance from oak sa- d
AICc weight.
vanna; habitat is the 7 categories of identified habitat within e
Lowest AICc: –15.99.
hunting range (see Methods).
b
Number of parameters.
c
Loge(likelihood).
d
Difference between model AICc and top model AICc. for hunting by Barn Owls nesting in boxes located in a
e
AICc weight. winegrape vineyard ecosystem. Water/wetland habitats
f
Lowest AICc: 26,627.68 were strongly avoided, while vineyard and urban habi-
tats were less strongly avoided. That Barn Owls actively
selected uncultivated habitats in the landscape, including
TABLE 4. Coefficients, SEs, and CIs from the top model of the in- rare riparian habitats, suggests that these habitats provide
tensity of habitat use by hunting Barn Owls in Napa Valley, CA,
spring 2016.a important resources for the owls, such as prey and staging
or perch sites that Barn Owls use while hunting (Askham
Covariateb Coefficient SE 95% CI LLc 95% CI ULd
1990, Taylor 1994). Conversely, although vineyard habitat
Urban 7.47e 1.59 4.71 10.58 was not selected as strongly as other habitat types for
Vineyard 7.65 1.29 5.11 10.18 hunting, most of the birds’ home ranges were dominated
Grassland 7.50 1.30 4.96 10.05 by vineyard (50% of random points, overall), so a substan-
Oak savanna 9.22 1.29 6.68 11.75
Mixed forest 7.78 1.35 5.13 10.44 tial portion of the owls’ hunting occurred within vineyards
Riparian 7.64 1.34 5.00 10.27 (32% of hunting locations, overall). Preferred habitat for
Water/wetland 8.68 1.94 4.88 12.48 Barn Owls is often considered to be open, grassy areas
DNestf 7.72 0.79 6.17 9.27 (Evans and Emlen 1947, Hindmarch et al. 2017, Roulin
DSavg 1.14 0.75 –0.33 2.62
2020), likely because of high rodent abundance and acces-
a
mnlv ~ Habitat + DNest + DSav + (1|owl_id); see Table 3 for more sibility (Taylor 1994, Arlettaz et al. 2010). In Napa Valley,
details and abbreviations. these habitats are associated with increased nest box occu-
b
Nine covariates that were included in the top model. pancy by Barn Owls (Wendt and Johnson 2017), and our
c
LL, lower limit. telemetry results also indicate these habitats are selected
d
UL, upper limit.
e
Coefficients for habitat categories should be evaluated with re- for hunting. While urban habitats were rarely used, their
spect to the mean among all 7 categories (7.99) to infer relative use is important to note because of possible increased
effect. exposure risk to second-generation anticoagulant roden-
f
Distance to nest. ticides (Hindmarch et al. 2017), which are prohibited by
g
Distance to savanna habitat. the State of California in crop areas but permitted around
houses and structures.
(β = –0.22 ± 0.03). The proportion of riparian had a posi- As expected for a central place forager, distance from the
tive coefficient (β = 8.20 ± 1.04), suggesting that vineyard nest had a significant negative effect on Barn Owl habitat
use increased with increasing riparian habitat, and this CI selection, with almost three-fourths of the hunting loca-
did not overlap zero. tions recorded within 1 km of an owl’s nest box. The top
model included this effect for all habitats (Figure 3). It
DISCUSSION should be noted, however, that we only tracked females,
who could have a stronger association with the nest box
Our results indicated that riparian, oak savanna, mixed than do males, whose hunting habitat selection has not
forest, and grassland habitats were strongly selected yet been examined. Distance from oak savanna habitat
Ornithological Applications 123:1–15, © 2021 American Ornithological Society10 Barn Owl habitat selection in vineyard ecosystem X. A. Castañeda, A. E. Huysman, and M. D. Johnson
had a weak negative relationship in predicting used loca- In the southern portion of the valley, uncultivated habi-
tions, suggesting Barn Owls selected hunting areas close tats are dominated by expansive grassland (~30% of total
to oak savanna habitat. Whether this is because of favor- area) and oak savanna (~7% of total area) with relatively
able roosting opportunities, prey abundance, or other fac- few riparian habitats. Farther north, uncultivated habitat
tors associated with oak savanna is unknown. Future work becomes scrub-dominated, transitioning to oak savanna
should evaluate rodent abundance in different habitats, (~11% of total area) and mixed forest (~15% of total area)
as well as the favored roosting sites for male and female at the most northern extent of the valley. The coverage of
Downloaded from https://academic.oup.com/condor/advance-article/doi/10.1093/ornithapp/duaa058/6119084 by guest on 26 January 2021
Barn Owls once they forgo roosting with the chicks in the vineyard also varies, increasing by more than 20% in the
nesting box. The role of predators may also be important, northern part of valley.
as Great Horned Owls (Bubo virginianus) are known pred- This gradient in habitat composition and landscape
ators and can be found in more forested habitat, which complexity from south to north in Napa Valley could af-
could reduce Barn Owls’ use of forested areas (Millsap and fect pest control services by Barn Owls, and resolving
Millsap 1987). this pattern could advance our understanding of the role
Conversely, the intensity of use (as measured with a of landscape heterogeneity in the delivery of ecosystem
metric for duration of patch use the t-LoCoH analysis) services by mobile predators (Bianchi et al. 2006, Lindell
was positively associated with distance to nest, indicating et al. 2018). For example, some of the results suggest that
that areas far from nests were used for longer hunting pest removal could be strongest in the southern part of the
bouts. This finding may appear at first to be at odds with valley. Although there is an increase in relative landscape
the negative effect of distance to nest on selection prob- complexity to the north, the decline in grassland may not be
ability. However, both findings are consistent with optimal ideal to support occupancy (Wendt and Johnson 2017) or
foraging theory for a central place forager, as hunting time extensive hunting (this study) and, as a result, may substan-
in a patch should offset travel costs to a more distant lo- tially limit provisioning of ecosystem services (Tscharntke
cation (Pyke et al. 1977). Surprisingly, the intensity of use et al. 2016). In addition, a highly fragmented landscape
was also high for water/wetland habitats, suggesting that, can contribute to limited movement and constricted home
although this habitat was rarely used (see Figure 3 for se- ranges and decrease provisioning rates to young, as seen in
lection results), when barn owls did use patches of water/ other owls (Hinam and St. Clair 2008).
wetland, they tended to do so for longer durations than for Alternatively, theory suggests that owl hunting and
some other habitat categories. Barn Owls will occasionally pest removal may be strongest in the more heterogeneous
prey on amphibians (Roulin and Dubey 2013, St. George north. A major review by Bianchi et al. (2006) on the effects
2019), but additional research is needed to better under- of landscape complexity on natural pest control services
stand this result. The intensity of use was also high for oak suggested that complex landscapes support greater pest
savannah habitats, suggesting that owls had longer hunting regulation than simple landscapes, because they can pro-
bouts in this habitat. vide favorable conditions and meet all the requirements for
It is important to note that while our results reveal the establishment and maintenance of natural predators.
hunting habitat preferences in this vineyard landscape, As highly mobile predators, Barn Owls have the ability to
much remains unresolved about the foraging ecology evaluate conditions across large spatial extents to deter-
of Barn Owls in this system. That uncultivated habitats mine where hunting efforts may be the most cost effective
were most selected does not necessarily mean they are (Pyke et al. 1977). The northern portion of the valley has
the highest in quality for Barn Owls (Johnson 2007). Also, proportionately more vineyard, and preferred uncultivated
there may be different prey in different habitats, and Barn habitats are spaced at greater distances apart than they are
Owls may prefer certain prey items over others at certain in the south. With nest boxes placed within the vineyards
times of the nesting cycle (St. George 2019). Lastly, perches and Barn Owls showing strong central place foraging, the
can be important foraging structures for Barn Owls (Roulin owls in the north may have been constrained to use more
2020), and some habitats may be preferred for hunting be- vineyard habitat. Perhaps this explains why the 3 Barn Owls
cause of perches located close to potential prey. tracked in this study from the northern part of the valley
The results of this study suggest that the composition traveled less distance from the nest when hunting than
of vineyard and non-cultivated habitats in a landscape af- those in the south (mean distance traveled: north = 1,675
fects where and for how long Barn Owls hunt. Specifically, m, south = 3,137 m) and thus may be providing a greater
all non-cultivated habitats were selected (Table 2), and service to the farms around their nest boxes. Our analysis
owls lingered longer in oak savanna habitat than in other did not examine any effect of landscape configuration;
habitats (Table 4). This has important implications for the that is, the spatial arrangement of habitat categories, their
delivery of possible pest control services. In Napa Valley, sizes, or contagion. This may be a fruitful area for add-
habitats selected for hunting are unevenly distributed. itional research. In particular, the role of riparian habitats
Ornithological Applications 123:1–15, © 2021 American Ornithological SocietyX. A. Castañeda, A. E. Huysman, and M. D. Johnson Barn Owl habitat selection in vineyard ecosystem 11
in vineyard ecosystems as corridors has been previously of uncultivated habitats will likely diminish nest box occu-
recognized (Hilty and Merenlender 2004); these habitats pancy altogether (Wendt and Johnson 2017), resulting in
may facilitate owl movement across simpler agricultural fewer owls on the landscape. Thus, there may be a tradeoff
landscapes. in that preferred uncultivated habitats enhance occupancy
The effect of landscape heterogeneity and uncultivated but diminish proportional hunting in vineyards by Barn
habitat on habitat selection in this study may be related Owls. Spatial modeling will be required to more fully ex-
to prey availability. Voles and Botta’s pocket gophers, spe- plore the nuances of this possible tradeoff in habitat al-
Downloaded from https://academic.oup.com/condor/advance-article/doi/10.1093/ornithapp/duaa058/6119084 by guest on 26 January 2021
cifically, are commonly found in grassland (Huntly and location, bird numbers, and the delivery of an ecosystem
Inouye 1988, Fehmi and Bartolome 2002), which we ob- service (sensu Railsback and Johnson 2014). Likewise, the
served to be a preferred hunting habitat for Barn Owls. delivery of desired ecosystem services could be influenced
Additionally, literature shows that small mammal abun- by not only the amount but also the distribution of pre-
dance is higher as landscape heterogeneity increases ferred habitats (Railsback and Johnson 2014, Mitchell et al.
in agricultural areas (Fischer et al. 2011). Thus, land- 2015, Tscharntke et al. 2016). The use of Barn Owl nest
scape heterogeneity may influence rodent pests in farms boxes for possible rodent management is also practiced in
(Tscharntke et al. 2016), which would in turn affect the the Central Valley of California, where farm sizes are larger
number of Barn Owls using nest boxes and hunting in and there is less uncultivated habitat. In Israel, where nest
vineyards. Additionally, because rodent populations are boxes are also used in agricultural landscapes with large
high in grasslands surrounding vineyards, this introduces fields (e.g., alfalfa), Barn Owls also travel farther from the
the possibility that Barn Owls hunting away from vine- nest for hunting (Motti Charter, personal communication).
yards may still be providing a pest control service by re- Future work examining hunting habitat selection in popu-
ducing rodent populations in surrounding uncultivated lations in landscapes with varying levels of heterogeneity
land. Additional research is necessary to better under- and patch sizes could help inform the role of landscape
stand the effect of landscape composition on the delivery composition on delivery of rodent pest management by
of pest removal services, either by examining prey de- highly mobile avian predators.
livery rates to nests located in different landscapes (i.e.
via remote videography) or by rodent sampling along a
habitat/landscape gradient. Available evidence indicates ACKNOWLEDGMENTS
that over 90% of Barn Owl diets are comprised of rodent
pests in California agricultural habitats (Kross et al. 2016, We thank Jeff Black and Tim Bean for their support and review
St. George 2019), and modeling suggests they could be of the development and execution of this project. A special
helpful in non-outbreak years (Kross and Baldwin 2016), thanks to Carrie Wendt, Dane St. George, and Katrina Smith
but a true test of the capacity for Barn Owls to reduce ro- for providing invaluable feedback throughout the process. Dr.
James Graham and Lucy Curro assisted with preparing high-
dent pests in vineyard awaits experimentation (Johnson
quality updated GIS layers. Thank you to Mark Sampson,
et al. 2018). Breanne Allison, and many other field assistants for all their
Our results showed that the overall composition of the hard work collecting data. Most importantly, we thank vine-
landscape can affect how much hunting occurs in farm- yard owners and managers of Napa Valley, California, for be-
land; in this case, owls hunted less on vineyards where lieving in our work.
nearby riparian and oak savanna habitats were available Funding statement: Funding for this project was provided by
(Table 5). This result underscores the importance of un- the California State University Agriculture Research Initiative
cultivated habitats to the delivery of pest control in agricul- (ARI, S3158) and the Humboldt Area Foundation (Wright
ture (Tscharntke et al. 2016, Lindell et al. 2018). Although Refuge 2016–2017 and Wright Refuge 2017–2018), with the
grassland, riparian, mixed forest, and oak savanna were support of vineyard owners and managers of Napa Valley,
the most selected habitats, oak savanna and riparian were California. Funders had no input into the content of the man-
uscript and did not require approval for the submission of this
among those most intensively used, and the final analysis
manuscript.
showed that as these habitats increased across the land- Ethics statement: This research was conducted in compli-
scape, hunting in vineyard habitat diminished. Studies ance with the Institutional Animal Care and Use Committee
of land-use change clearly indicate that the expansion of of Humboldt State University. IACUC No.15/16.W.43-A.
winegrape vineyards is coming at the cost of these im- Author contributions: X.A.C and M.D.J formulated the ques-
portant habitats, especially oak savanna and grassland. As tions; X.A.C collected data and supervised research; X.A.C,
a result, owls nesting in boxes located on vineyards may A.E.H., and M.D.J analyzed the data; and X.A.C, A.E.H., and
need to travel farther to reach their preferred unculti- M.D.J wrote the paper.
vated habitats. To some degree, this could concentrate Data availability: Analyses reported in this article can be re-
hunting by owls in vineyards, but at some point, the loss produced using the data provided by Castañeda et al. (2020).
Ornithological Applications 123:1–15, © 2021 American Ornithological Society12 Barn Owl habitat selection in vineyard ecosystem X. A. Castañeda, A. E. Huysman, and M. D. Johnson
LITERATURE CITED CDFA (California Department of Food and Agriculture) (2019).
California Agricultural Exports 2018–2019. http://www.cdfa.
Anderson, A., K. Kirkpatrick, and S. A. Shwiff (2012). The net ca.gov/statistics/
benefits of controlling bird and rodent pests in wine grape Coeurdassier, M., R. Riols, A. Decors, A. Mionnet, F. David,
and avocado production. Proceedings of the Vertebrate Pest T. Quintaine, D. Truchetet, R. Scheifler, and P. Giraudoux (2014).
Conference 25:353–356. Unintentional wildlife poisoning and proposals for sustainable
Arlettaz, R., M. Krahenbuhl, B. Almasi, A. Roulin, and M. Schaub management of rodents. Conservation Biology 28:315–321.
(2010). Wildfower areas within revitalized agricultural matrices Colvin, B. A. (1985). Common Barn Owl population decline in Ohio
Downloaded from https://academic.oup.com/condor/advance-article/doi/10.1093/ornithapp/duaa058/6119084 by guest on 26 January 2021
boost small mammal populations but not breeding Barn Owls. and the relationship to agricultural trends. Journal of Field
Journal of Ornithology 151:553–564. Ornithology 56:224–235.
Askham, L. R. (1990). Effect of artificial perches and nests in at- Comfort, E. J., D. A. Clark, R. G. Anthony, J. Bailey, and M. G. Betts
tracting raptors to orchards. Proceedings of the Vertebrate (2016). Quantifying edges as gradients at multiple scales im-
Pest Conference 14:144–148. proves habitat selection models for Northern Spotted Owl.
Baldwin, R. A., T. P. Salmon, R. H. Schmidt, and R. M. Timm. Landscape Ecology 31:1227–1240.
(2014). Perceived damage and areas of needed research for Cushman, S. A. (2010). Animal movement data: GPS telem-
wildlife pests of California agriculture. Integrative Zoology etry, autocorrelation and the need for path-level analysis. In
9:265–279. Spatial Complexity, Informatics, and Wildlife Conservation
Balmford, A., R. Green, and B. Phalan (2012). What conservation- (S. A. Cushman and F. Huettmann, Editors). Springer, Tokyo,
ists need to know about farming? Proceedings of the Royal Japan. p. 131–149.
Society of London, Series B 279:2714–2724. Cushman S. A., M. Chase, and C. Griffin (2005). Elephants in space
Barn Owl Trust (2015). Owlet identification and ageing. and time. Oikos 109:331–341.
h t t p s : / / w w w. b a r n o w l t r u s t . o r g. u k / b a r n - o w l - f a c t s / Duckett, J. E. (1976). Owls as major predators of rats in oil palm
owlet-identification-age/ estates with particular reference to the Barn Owl (Tyto alba).
Bates, B., M. Maechler, B. Bolker, and S. Walker (2015). Fitting Planter, Malaysia 52:4–15.
linear mixed-effects models using lme4. Journal of Statistical Evans, F. C., and J. T. Emlen, Jr. (1947). Ecological notes on the prey
Software 67:1–48. selected by a Barn Owl. The Condor 49:3–9.
Bianchi, F. J., C. J. Booij, and T. Tscharntke. (2006). Sustainable Eyes, S. A., S. L. Roberts, and M. D. Johnson (2017). California
pest regulation in agricultural landscapes: A review on land- Spotted Owl (Strix occidentalis occidentalis) habitat use pat-
scape composition, biodiversity and natural pest control. terns in a burned landscape. The Condor: Ornithological
Proceedings. Biological Sciences 273:1715–1727. Applications 119:375–388.
Bjørnstad, O. N. (2005). ncf: Spatial nonparametric covariance Fair J., E. Paul, and J. Jones (Editors) (2010). Guidelines to the Use
functions. R package. http://cran.rproject.org/web/packages/ of Wild Birds in Research. Ornithological Council, Washington,
ncf/index.html D.C., USA.
Bond, G., N. G. Burnside, D. J. Metcalfe, D. M. Scott, and J. Blamire Fast, S. J., and H. W. Ambrose (1976). Prey preference and hunting
(2005). The effects of land-use and landscape structure on habitat selection in the Barn Owl. American Midland Naturalist
Barn Owl (Tyto alba) breeding success in southern England, 96:503–507.
U.K. Landscape Ecology 20:555–566. Fehmi, J. S., and J. W. Bartolome (2002). Species richness and
Bottrell, D. R. (1979). Integrated Pest Management. United States California voles in an annual and a perennial grassland.
Government Printing Office, Washington, D.C., USA. Western North American Naturalist 62:73–81.
Boyce, M. S., P. R. Vernier, S. E. Nielsen, and F. K. A. Schmiegelow Fischer, C., C. Thies, and T. Tscharntke (2011). Small mammals
(2002). Evaluating resources selection functions. Ecological in agricultural landscapes: Opposing responses to farming
Modelling 157:281–300. practices and landscape complexity. Biological Conservation
Browning, M., J. Cleckler, K. Knott, and M. Johnson (2016). Prey 144:1130–1136.
consumption by a large aggregation of barn owls in and agri- Franklin, A. B., D. R. Anderson, R. J. Gutierrez, and K. P. Burnham
cultural setting. Proceedings of the Vertebrate Pest Conference (2000). Climate, habitat quality, and fitness in Northern Spotted
27:337–344. Owl populations in northwestern California. Ecological
Burnham, K. P., D. R. Anderson, and K. P. Huyvaert (2011). AIC Monographs 70:539–507.
model selection and multimodel inference in behavioral Gervais, J. A., D. K. Rosenberg, and R. G. Anthony (2003). Space
ecology: Some background, observations, and comparisons. use and pesticide exposure risk of male burrowing owls in an
Behavioral Ecology and Sociobiology 65:23–35. agricultural landscape. The Journal of Wildlife Management
Byron, J. (2008). Research News: Nest boxes can attract wild- 67:155–164.
life to vineyards. California Agriculture Online. http:// Getz, W. M., S. Fortmann-Roe, P. C. Cross, A. J. Lyons, S. J. Ryan, and
californiaagriculture.ucanr.org/landingpage.cfm.articleid=ca. C. C. Wilmers. (2007). LoCoH: Nonparameteric kernel methods
v062n04p131&fulltext=yes for constructing home ranges and utilization distributions.
Carey, A. B., and K. C. Peeler (1995). Spotted Owls: Resource and PLoS One 2:e207.
space use in mosaic landscapes. Journal of Raptor Research Green, R. E., S. J. Cornell, J. P. Scharlemann, and A. Balmford. (2005).
29:223–239. Farming and the fate of wild nature. Science (New York, N.Y.)
Castañeda, X. A., A. E. Huysman, and M. D. Johnson (2020). Data 307:550–555.
from: Barn Owls select uncultivated habitats for hunting in Grismer, M., and C. Asato (2012). Converting oak woodland or sa-
a winegrape growing region of California. Ornithological vanna to vineyards may stress groundwater supply in summer.
Applications 123:1–15. doi:10.5061/dryad.mpg4f4qx0 California Agriculture 66:144–152.
Ornithological Applications 123:1–15, © 2021 American Ornithological SocietyYou can also read