The environmental and ecological determinants of elevated Ross River Virus exposure in koalas residing in urban coastal landscapes - Nature
←
→
Page content transcription
If your browser does not render page correctly, please read the page content below
www.nature.com/scientificreports
OPEN The environmental and ecological
determinants of elevated Ross
River Virus exposure in koalas
residing in urban coastal
landscapes
Brian J. Johnson1,4*, Amy Robbins2,4, Narayan Gyawali1, Oselyne Ong1, Joanne Loader2,
Amanda K. Murphy1,3, Jon Hanger2 & Gregor J. Devine1
Koala populations in many areas of Australia have declined sharply in response to habitat loss, disease
and the effects of climate change. Koalas may face further morbidity from endemic mosquito-borne
viruses, but the impact of such viruses is currently unknown. Few seroprevalence studies in the wild
exist and little is known of the determinants of exposure. Here, we exploited a large, spatially and
temporally explicit koala survey to define the intensity of Ross River Virus (RRV) exposure in koalas
residing in urban coastal environments in southeast Queensland, Australia. We demonstrate that RRV
exposure in koalas is much higher (> 80%) than reported in other sero-surveys and that exposure is
uniform across the urban coastal landscape. Uniformity in exposure is related to the presence of the
major RRV mosquito vector, Culex annulirostris, and similarities in animal movement, tree use, and
age-dependent increases in exposure risk. Elevated exposure ultimately appears to result from the
confinement of remaining coastal koala habitat to the edges of permanent wetlands unsuitable for
urban development and which produce large numbers of competent mosquito vectors. The results
further illustrate that koalas and other RRV-susceptible vertebrates may serve as useful sentinels of
human urban exposure in endemic areas.
The koala (Phascolarctos cinereus) is an important emblem of Australia’s biodiversity and a globally-recognised
Australian icon, yet many populations continue to decline1. This decline is largely attributable to wide-scale
habitat loss, much of it unregulated. During the period from 2000 to 2017, over 7.7 million ha of Australia’s
wildlife habitat was cleared with less than 10% being subject to scrutiny under the Environment Protection and
Biodiversity Conservation A ct2. Of the land lost, ca. 1 million ha was known or potential koala habitat. Such
significant habitat losses and associated population declines have resulted in the koala being listed as vulnerable
or extinct in much of its historic r ange3. There are pockets where the koala is thriving, but these areas represent
a fraction of its native range4,5. In the state of Queensland, the koala is currently listed as vulnerable in response
to ongoing habitat loss and the threats of climate c hange1,6,7. The historical clearing of primary eucalypt forest
habitat and accelerated coastal development in the southeast of the state has been associated with particularly
sharp population d eclines8–10.
Habitat loss and climate change are not the only threats to the survival of the koala. Infectious disease has
also contributed to its decline. The bacterium Chlamydia pecorum causes debilitating ocular and urogenital
tract disease while the koala retrovirus (KoRV) has been implicated in host immunosuppression and exacerba-
tion of chlamydial pathogenesis11–14. Koalas are also known to be infected by endemic mosquito-borne viruses
such Barmah Forest virus (BFV) and Ross River virus (RRV)15,16, yet the threat of these viruses to koala health
remains poorly studied. RRV is Australia’s most medically important mosquito-borne virus that causes debili-
tating polyarthritis in humans, among other symptoms17. The pathology of RRV in marsupial hosts is currently
unknown although myositis and arthritis are reported in m ice18 and domestic h orses19. Primary vertebrate hosts
1
Mosquito Control Laboratory, QIMR Berghofer Medical Research Institute, Brisbane, QLD 4006,
Australia. 2Endeavour Veterinary Ecology Pty Ltd, 1695 Pumicestone Rd, Toorbul, QLD 4510, Australia. 3School of
Public Health and Social Work, Queensland University of Technology, Kelvin Grove, QLD 4059, Australia. 4These
authors contributed equally: Brian J. Johnson and Amy Robbins. *email: brian.johnson@qimrberghofer.edu.au
Scientific Reports | (2021) 11:4419 | https://doi.org/10.1038/s41598-021-83919-1 1
Vol.:(0123456789)www.nature.com/scientificreports/
Major water class Minor water class Other water classes
Tidally influenced estuarine: characterised by man- Freshwater palustrine: coastal/ sub-coastal: floodplain Freshwater lacustrine: artificial/ highly modified wet-
Estuarine
groves and related tree communities tree swamps (melaleuca and eucalypt) lands (dams, ring tanks, irrigation channel)
Freshwater lacustrine: artificial/ highly modified Tidally influenced estuarine: characterised by man- Freshwater palustrine: coastal/ sub-coastal: floodplain
Lacustrine
wetlands (dams, ring tanks, irrigation channel) groves and related tree communities tree swamps (melaleuca and eucalypt)
Table 1. Summary of major and minor water body classes present in each surveyed environment.
Location Sample RRV positivea RRV negative % positive Odds-ratios 2.5% CI 97.5% CI z-value p-value
Overall 73 16 82.02 0.82 0.39 1.82 0.49 0.62
Estuarine Female 41 9 82.00 0.99 0.36 2.98 0.01 0.99
Male 32 7 82.05 1.01 0.34 2.76 0.01 0.99
Overall 83 15 84.69 1.21 0.55 2.57 0.49 0.62
Lacustrine Female 54 9 85.71 1.24 0.38 3.88 0.38 0.71
Male 29 6 82.86 0.81 0.26 2.61 0.38 0.71
Table 2. Seroprevalence of Ross River virus (RRV) in koalas residing in urban coastal lacustrine and estuarine
environments. Comparison of seroprevalence rates between environments was performed using data only for
animals for which their location could be confirmed (n = 187) after accounting for relocated individuals and
animals with too few position locations (n < 5) to confirm their assignment to a particular environment. a An
animal sampled multiple times was considered seropositive if the animal returned a positive test result during
any individual sampling event.
are often assumed to be native macropods (e.g. wallabies and kangaroos), but there is considerable debate as to
which animals are the primary hosts in urban landscapes where macropods are uncommon but where spillover
ronounced20,21. Although koalas can be locally abundant in the urban landscape as long as
to humans is often p
suitable green space exists, their relative scarcity and irregular distribution in that environment makes them an
unlikely amplifying host for RRV. Remnant urban green spaces are also often resource-poor and therefore may
compromise the immunological fitness of koalas living in such s paces22,23. Consequently, where RRV exposure
is common in urban landscapes, koalas may incur substantial morbidity. Although surveys of captive koalas in
New South Wales, Australia, did not find RRV antibodies (n = 12)24, surveys performed in southern Victoria,
Australia, detected RRV antibodies in 16% of wild koalas (n = 93)15,16. This latter observation suggests RRV
exposure in koalas may present a health risk, but the literature is sparse and exposure among wild koala popula-
tions remains largely unknown.
Here, we performed a large, spatially and temporally explicit RRV seroprevalence survey of koalas residing
in the urban coastal landscape using sera collected as part of a broader population health survey performed in
response to regional infrastructure development. Our purpose was to examine patterns of RRV exposure in
coastal koala populations and identify potential correlates of risk related to koala movement and habitat use.
Surveys were focused in urban coastal estuarine and lacustrine environments proximate to human develop-
ments. These environments are thought to be important sources of RRV spill over to humans25,26. Characterising
the prevalence of RRV exposure in koalas in these environments might inform a better understanding of RRV
transmission from both a public health and a wildlife conservation perspective (Table 1).
Results
RRV seroprevalence. More than 80% of koalas tested in the lacustrine and estuarine habitats surveyed
had anti-RRV antibodies. Out of 218 koalas tested, 172 koalas were seropositive, 35 were seronegative, and 11
seroconverted from negative to positive over the course of the study (2015 to 2017). The low number of serocon-
versions during the study reflects the high prevalence of RRV exposure in each population prior to the beginning
of the survey. Seroprevalence rates in female and male koalas were similar (84%, n = 95 vs. 82%, n = 61; χ2 = 0.07,
p = 0.80) and not influenced by environment (Table 2). This latter analysis contained data from 187 koalas after
accounting for relocated individuals and animals with too few position locations (n < 5) to confirm their assign-
ment to a particular environment. Overall seroprevalence in the estuarine and lacustrine populations surveyed
was 82% (n = 73) and 85% (n = 83), respectively. Multivariate logistic regression analyses further revealed that
seroprevalence increased with increasing koala age (Table 3), and that these increases were independent of koala
sex (male vs female, OR = 1.1, 95% CI 0.5–2.7, p = 0.83) and the environment in which they resided (lacustrine
vs estuarine, OR = 1.0, 95% CI 0.43–2.4, p = 0.98). Koalas aged between 2–4 years, 4–6 years, and > 6 years of age
were 6.9 (95% CI 2.5–22.2, p < 0.001), 8.2 (95% 2.6–37.2, p = 0.001), and 23.7 (4.5–439.9, p = 0.003) times more
likely to test RRV positive, respectively, relative to the baseline age group (< 2 years of age) (Fig. 1).
Koala tracking and home range comparisons. Home ranges were calculated for a total of 155 koalas
across the lacustrine (54 females and 37 males) and estuarine (36 females and 28 males) environments after
accounting for translocated koalas, those with inadequate sampling duration and those whose home ranges
Scientific Reports | (2021) 11:4419 | https://doi.org/10.1038/s41598-021-83919-1 2
Vol:.(1234567890)www.nature.com/scientificreports/
Variable Seropositive (%) Seronegative (%) Seroconverted (%) Odds ratio (OR) OR 95% CI P-value
Age
6 33 (91.7%) 1 (2.6%) 2 (5.3%) 23.7 4.5–439.9 0.003
Table 3. Summary of seroprevalence results by koala age group and logistic regression outputs for the analysis
of the association of koala age with RRV seroprevalence in koalas residing in coastal lacustrine and estuarine
environments. Percentages are calculated for the number of individuals in each row. The data shown is only for
animals for which their location could be confirmed (n = 187) after accounting for relocated individuals and
animals with too few position locations (n < 5) to confirm their assignment to a particular environment.
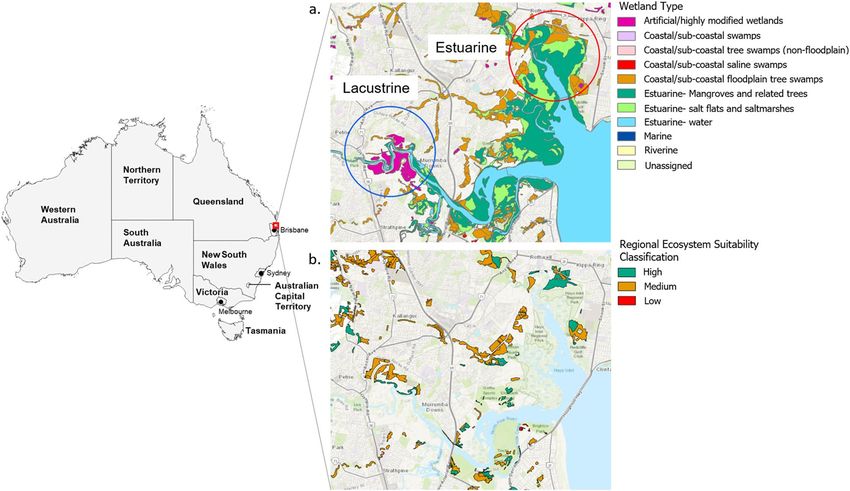
Figure 1. (a) Location of the study area in southeast Queensland, Australia, and summary of primary water
bodies present in each surveyed environment. (b) Location and ecosystem suitability classification of koala
habitat in the study area as of the most recent state-wide classification (January 2020)7. Wetland70 and koala
habitat71 GIS shapefiles were obtained through the QSpatial Catalogue (http://qldspatial.information.qld.gov.
au/). Base layer of the region area sourced from Esri World Imagery72. This figure was created using the ArcGIS
Pro software suite (version 2.4.2, https://www.esri.com/en-us/arcgis/products/arcgis-pro).
failed to satisfy the Minimum Convex Polygon (MCP) 60% cutoff during visual assessment of home range
asymptotes. Home ranges did not differ by environment but did differ by sex (Fig. 2a; F1, 151 = 24.79, p < 0.001)
with males (mean = 6.1 ha, 95% CI 4.9–7.3 ha) having greater home ranges than females (mean = 3.0 ha, 95%
CI 2.6–3.6 ha). However, no significant differences in home ranges was observed within a sex when consider-
ing serostatus (Fig. 2b; F1,151 = 1.57, p = 0.21). When home ranges were compared between age groups, males
and females exhibited a similar trend of increasing home range size with increasing age (Fig. 2c). Significant
differences (F1,147 = 6.28, p = 0.01) between males and females were only observed within the oldest age group,
wherein male home ranges (mean = 10.8 ha, 95% CI 9.3–12.4 ha) were 26% larger than those of similarly aged
females (mean = 8.0 ha, 95% CI 7.0–9.0 ha). Differences between the sexes within the older age group may be
attributable to the greater movement of older, dominant males during the mating season27. The home ranges of
individuals that seroconverted during the study were similar (mean = 6.9 ha, 95% CI 3.4–10.4 ha) to those that
were seropositive prior to the study or those that remained seronegative, but too few seroconverted to confi-
dently compare the three groups.
Scientific Reports | (2021) 11:4419 | https://doi.org/10.1038/s41598-021-83919-1 3
Vol.:(0123456789)www.nature.com/scientificreports/
Figure 2. (a) Comparison of annual male and female home ranges (mean ± SE), (b) comparison of annual
home ranges (mean ± SE) of seropositive and seronegative koalas, (c) comparison of male and female home
ranges by age group (mean ± SE), and (d) comparison of koala height (mean ± SE) in trees for seropositive and
seronegative koalas. Bars within a graph that do not share similar letters denote statistical significance.
Koala tree use by environment. Koalas were found to utilize 38 and 56 individual tree species in the
estuarine and lacustrine environments, respectively. Although the overall tree communities were unique in rela-
tion to the environment, the dominant species used by koalas in each environment were similar (Table 4). Koalas
favoured Eucalyptus tereticornis (blue gum) and E. siderophloia (grey ironbark) in the estuarine environment
and E. racemosa (scribbly gum) and E. tereticornis in the lacustrine environment. Other species commonly
used by koalas included Corymbia intermedia (pink bloodwood) and Melaleuca quinquenervia (broad-leaved
paperbark) in the estuarine environment and Cinnamomum camphora (camphor laurel) and C. intermedia in
the lacustrine environment. Tree selection between seropositive and seronegative koalas was similar with nine
of the top ten most used tree species being shared between them (Table 5). Both male and female koalas pre-
ferred mature trees with greater diameter at breast height (DBH; male 95% CI 40.94–42.96 cm; female 95% CI
42.18–44.62 cm) and occupied similar heights in trees (Fig. 2d; male 95% CI 14.82–15.55 m; female 95% CI
14.09–15.31 m). No significant (F1, 305 = 0.24, p = 0.62) differences for either variable were observed between
environments or by serostatus.
Mosquito community composition. As expected, the estuarine environment contained more of the salt-
marsh associated species Aedes vigilax, Culex sitiens and Aedes alternans relative to the lacustrine environment
that harbored a greater diversity and abundance of freshwater associated species such as Culex annulirostris and
Aedes procax (Table 6). Cx. annulirostris dominated both habitats, accounting for 86% and 41% of all collections
from the lacustrine and estuarine environments, respectively. While the abundance of mosquitoes in both envi-
ronments was substantial, the estuarine environment had the greatest number of mosquitoes per surveillance
event (11,199 ± 2,688 vs. 5,576 ± 2,696).
Discussion
The risk of arbovirus transmission to both humans and wildlife is influenced by the environment and is therefore
spatially heterogeneous. Distinct patterns of increased human RRV risk in southeast Queensland (SEQ) appear
to be driven by environmental changes in vector-vertebrate communities21,28, but little is known of the factors
driving environmental and spatial risks of RRV transmission to endemic wildlife. In the present study, we dem-
onstrate that RRV seropositivity in koalas can be far greater than that reported for other marsupial species17,29
and other circulating arboviruses such as BFV15,30. Uniformity in exposure is related to the presence of the major
RRV mosquito vector, Culex annulirostris, and similarities in koala movement, tree use, and age-dependent
increases in exposure risk. The findings suggest that elevated RRV exposure in coastal koala populations is related
to the confinement of remaining koala habitat to the edges of permanent wetlands that are unsuitable for further
development and which produce large numbers of mosquito vectors. The discovery of high RRV prevalence in
Scientific Reports | (2021) 11:4419 | https://doi.org/10.1038/s41598-021-83919-1 4
Vol:.(1234567890)www.nature.com/scientificreports/
Estuarine Lacustrine
Tree species Count DBH (cm) Tree height (m) Koala height (m) Tree species Count DBH (cm) Tree height (m) Koala height (m)
Eucalyptus tereticornis Eucalyptus racemosa
6446 53.62 21.07 16.61 2268 66.79 22.08 18.38
(blue gum) (scribbly gum)
Eucalyptus siderophloia Eucalyptus tereticornis
3937 40.30 19.27 16.10 2157 62.02 21.39 16.36
(grey ironbark) (blue gum)
Melaleuca quinquenervia Cinnamomum camphora
882 25.73 13.79 12.01 1145 45.39 15.12 12.89
(paperbark) (camphor laurel)
Corymbia intermedia Eucalyptus grandis
835 39.65 18.45 15.33 953 46.02 26.25 21.71
(pink bloodwood) (flooded gum)
Casuarina glauca (she- Corymbia intermedia
738 25.71 13.87 11.67 885 36.72 18.39 14.58
oak) (pink bloodwood)
Corymbia tessellaris Lophostemon confertus
226 40.99 19.59 15.26 586 40.16 19.22 16.89
(Moreton Bay ash) (brushbox)
Lophostemon confertus Eucalyptus siderophloia
101 39.03 19.39 16.74 398 38.74 19.33 15.61
(brushbox) (grey ironbark)
Melaleuca quinquenervia
Mangrove 93 15.72 7.36 6.25 373 34.77 14.07 12.11
(paperbark)
Eucalyptus grandis Casuarina glauca (she-
90 80.70 21.74 16.29 276 27.02 13.00 10.56
(flooded gum) oak)
Lophostemon suaveolens Eucalyptus pilularis
70 25.06 11.71 9.91 228 77.66 29.53 24.44
(swampbox) (blackbutt)
Lophostemon suaveolens
Acacia sp. 50 18.04 9.58 7.65 181 23.75 13.57 11.10
(swampbox)
Eucalyptus sp. 45 52.29 17.64 14.07 Pinus elliottii (slash pine) 174 31.88 18.93 15.90
Corymbia citriodora
33 58.79 22.00 18.88 Ficus sp. 170 60.20 14.49 11.94
(spotted gum)
Eucalyptus propinqua Eucalyptus propinqua
29 37.21 14.38 11.92 143 49.21 17.61 14.98
(grey gum) (grey gum)
Dead tree 12 23.08 10.92 9.42 Acacia sp. 134 25.82 11.55 8.45
Eucalyptus fibrosa Corymbia tessellaris
12 40.42 20.00 17.00 126 36.10 18.87 16.97
(broad-leaved ironbark) (Moreton Bay ash)
Eucalyptus robusta Eucalyptus microcorys
12 41.83 14.67 12.50 126 51.94 20.17 15.53
(swamp mahogany) (tallowwood)
Eucalyptus microcorys
11 44.27 17.27 12.38 Pinus sp. 63 34.57 18.14 15.75
(tallowwood)
Ficus sp. 9 44.89 10.11 7.33 Mangrove 59 27.81 11.58 11.25
Table 4. Dominant tree species and characteristics of trees in which koalas were located during the study.
Count represents the total number of observations (animal relocations) during which a koala was observed on
an individual tree species. The data presented for tree diameter at breast height (DBH), tree height, and koala
height in trees represents the mean data for all koalas surveyed in each environment. The tree species shown
represents > 95% of animal relocations in each environment.
Seropositive Koalas Seronegative Koalas
Tree species % of animal relocations # of relocations Tree species % of animal relocations # of relocations
Eucalyptus tereticornis (blue gum) 27.51 6799 Eucalyptus tereticornis (blue gum) 38.61 2218
Eucalyptus siderophloia (grey ironbark) 13.27 3279 Eucalyptus siderophloia (grey ironbark) 23.32 1340
Eucalyptus racemosa (scribbly gum) 8.66 2141 Corymbia intermedia (pink bloodwood) 7.42 426
Corymbia intermedia (pink bloodwood) 5.73 1417 Melaleuca quinquenervia (paperbark) 6.18 355
Cinnamomum camphora (camphor laurel) 4.56 1127 Casuarina glauca (she-oak) 4.09 235
Eucalyptus grandis (flooded gum) 4.16 1028 Eucalyptus moluccana (gum-topped box) 2.68 154
Melaleuca quinquenervia (paperbark) 4.05 1002 Eucalyptus racemosa (scribbly gum) 2.30 132
Eucalyptus moluccana (gum-topped box) 3.69 911 Corymbia citriodora (spotted gum) 2.11 121
Casuarina glauca (she-oak) 3.38 835 Lophostemon confertus (brushbox) 2.00 115
Lophostemon confertus (brushbox) 2.64 652 Lophostemon suaveolens (swampbox) 1.38 79
Table 5. Common tree species used by Ross River virus seropositive and seronegative koalas across both
study areas. Tree use is represented by the percentage (mean) of animal relocations during which a koala was
observed on an individual tree species.
Scientific Reports | (2021) 11:4419 | https://doi.org/10.1038/s41598-021-83919-1 5
Vol.:(0123456789)www.nature.com/scientificreports/
Total collected Mean Std. error of mean % of total collected (mean) SE of % of total
Lacustrine
Aedes alternans 0 0 0 0 0
Aedes aculeatus 33 11 8.62 0.77 0.59
Aedes notoscriptus 202 67.33 37.95 1.79 0.68
Aedes procax 139 139 0 0.62 0.62
Aedes vigilax 302 100.7 51.36 2.07 0.35
Aedes vittiger 0 0 0 0 0
Anopheles annulipes 512 170.7 167.7 2.64 1.63
Culex annulirostris 13,993 4664 2219 86.25 6.34
Culex hilli 0 0 0 0 0
Culex sitiens 1518 506 506 5.61 5.61
Uranotaenia sp. 29 9.667 9.17 0.25 0.13
Estuarine
Aedes alternans 1252 417.3 201.5 3.7 1.19
Aedes aculeatus 0 0 0 0 0
Aedes notoscriptus 0 0 0 0 0
Aedes procax 0 0 0 0 0
Aedes vigilax 6755 2252 1068 27.78 17.88
Aedes vittiger 50 0 0 0.13 0.13
Anopheles annulipes 0 0 0 0 0
Culex annulirostris 16,846 8423 80 40.6 20.35
Culex hilli 306 153 52 0.73 0.41
Culex sitiens 8389 2796 762.9 27.07 6.51
Uranotaenia sp. 0 0 0 0 0
Table 6. Summary of mosquito species collected in each surveyed environment. Two C
O2-baited light traps
were set at each sampling site across four (n = 4) surveillance events.
these populations supports the need for future investigations into the population health consequences of RRV
and other endemic arboviruses in koalas.
Habitat loss and fragmentation disrupts many important ecological processes including population dynam-
ics and resource u se31–33. It is further linked to increases in human disease risk for a variety of zoonotic diseases
within urban environments through processes related to population isolation, reductions in host species richness,
and increases in the abundance of urban adapted, highly competent host and vector species34–37. The current
study reveals, for the first time, high RRV seroprevalence in koala populations residing in degraded urban coastal
habitats. Resource related reductions in immunological fitness22,23, combined with often elevated animal densities
in remnant coastal habitat p atches7, may contribute to elevated RRV and other infectious disease prevalence in
the surveyed populations (35% C. pecorum, 100% KoRV-A and 24% KoRV-B)38. The influence of habitat distur-
bance on RRV risk to koalas is further supported by lower seroprevalence rates (13%; n = 93) in koalas residing
in the coastal Gippsland Lakes region of Victoria, A ustralia15,16, a region containing ca. 20,000 ha of protected
natural habitat. However, we cannot attribute these differences to quality of habitat alone, as climate variability
between regions will have differing impacts on RRV transmission intensity. Of note, although tree use by koalas
in this study was similar to that reported e lsewhere39–41, recent infrastructure developments in the study area
have resulted in the loss of ca. 53 ha of koala habitat and the removal of at least 17,000 maturing t rees42,43. This
has clearly degraded the quality of this habitat overall and may influence future patterns of koala tree use and
resource-related associations with arbovirus exposure in the areas surveyed.
The risk of disease exposure in wildlife often increases with animal age. Age-related increases in seropositivity
has been demonstrated in koalas for KoRV44, as older animals are more likely to become infected due to having
more contact with other koalas. The likelihood of vector-host contact also increases with age and reports on
humans17 and other marsupial species24,29 demonstrate that antibody prevalence often increases with increasing
age. Our data reflects the same pattern and is supported by the majority of seronegative koalas being < 2 years
of age and the relatively young age of individuals that positively seroconverted during the study. It is difficult
to give much weight to the latter finding, however, considering the low number of seroconversions observed.
Our results further suggest that exposure is related to age-dependent patterns of movement, as both exposure
and movement increased proportionally with increasing koala age. The home ranges observed in this study
(males = 6.1 ha, females = 3.3 ha) are similar to those of koalas residing in another urban coastal habitat in
Victoria, Australia (males = 9.1 ha, females = 4.3 ha)45, and general patterns of movement observed may reflect
a combination of age and resource-limited27,45,46 effects. Exposure ultimately appears to be dependent upon
multiple demographic and habitat related factors, and the interactions between them. Thus, additional studies
performed across varied habitats are needed to better understand how such factors influence exposure risk in
koalas to RRV and other arboviruses.
Scientific Reports | (2021) 11:4419 | https://doi.org/10.1038/s41598-021-83919-1 6
Vol:.(1234567890)www.nature.com/scientificreports/
Although several mosquito species captured in each environment are known to transmit RRV, including Cx.
annulirostris, Ae. vigilax and Cx. sitiens, historical evidence suggests Cx. annulirostris is the most likely vector
for koalas. This mosquito has a tendency to seek hosts above ground level47,48, and commonly blood-feeds on
marsupials, including tree-dwelling species like the brushtail possum49,50. The presence of Cx. annulirostris may
expose koalas to other circulating arboviruses, as it is also a principal vector of BFV, Murray Valley encephalitis
and West Nile Kunjin viruses49,51. Of these, BFV is the second most medically important endemic mosquito-
borne disease in SEQ and serological investigations implicate marsupials as the largest and most diverse group
of reservoirs52. Although previous reports suggest exposure to BFV in koalas is low (9% seroprevalence)15, the
limited number of studies justifies additional investigations.
Lastly, infection in vertebrate hosts at the wildlife-human interface may be used to forecast the risk of spillo-
ver to the human population53,54. Although the spatial distribution of human RRV cases is extensive, there are
elevated risks associated with suburban areas harbouring a greater proportion of wetlands and bushland and an
increased presence of Cx. annulirostris and other freshwater m osquitoes25,28,55. These observations are corrobo-
rated by reports of RRV outbreaks being preceded by above-average rainfall e vents56,57 that provide temporary
freshwater larval habitats for Cx. annulirostris populations for extended periods of time. Increased monitoring
of disease exposure in non-human vertebrate populations, such as koalas, may enhance our understanding of
the environmental and ecological determinants of human exposure.
Conclusion
This survey represents one of the largest single-species marsupial seroprevalence surveys performed to date.
The scale and scope of the survey provided key insights into the environmental and ecological determinants
of RRV exposure in koalas residing in the urban coastal landscape. Substantial risks of exposure are associated
with confinement of remnant coastal koala habitat to the edges of permanent wetland features that produce
large numbers of competent mosquito vectors. Particular importance is attributed to the presence of freshwater
habitat suitable to Cx. annulirostris mosquitoes. These results demonstrate that the careful study and sampling
of wildlife populations can yield insights relevant to animal conservation and public health in rapidly changing
urban landscapes.
Methods
Study area. Koalas were surveyed in coastal estuarine and lacustrine environments (Fig. 1a, Table 1) located
in the Moreton Bay Region (MBR) of SEQ (27.2337° S, 153.0683° E and 27.2685° S, 152.9896° E, respectively),
Australia. Koala habitat loss and fragmentation due to urban development in the two study areas has been severe
over the last decade and remaining koala habitat is largely confined to the edges of swampy and/or flood-prone
areas unsuitable for further development (Fig. 1b)43. Much of the remaining habitat in the more developed lacus-
trine study area is heavily fragmented and classified as medium quality, or suitability, for koalas7, whereas the less
developed estuarine environment contains a greater proportion of high quality habitat. Both surveyed environ-
ments harbor mosquito faunas typical of the region’s saltwater (Ae. vigilax) and freshwater (Cx. annulirostris)
habitats because of their proximity to permanent water features. These species are significant vectors of RRV and
readily blood-feed on humans and a variety of non-human vertebrates including marsupials50,58,59.
Endemic human circulation of RRV occurs in the region, with an average of 259 human cases/year notified
between January 2012 and December 2016 (Data provided by the Queensland Department of Health, Com-
municable Diseases Branch, QIMRB Human Research Ethics Committee Approval no. P2238; Fig. S1). Human
disease cases are reported in the region (and in broader SEQ) year-round, commonly peaking between February
and May each year. This coincides with the late austral summer and autumn seasons, when seasonal increases
in mosquito abundance occur.
Koala sampling, collaring and aging. We surveyed 223 koalas as part of a regional koala management
program undertaken in response to a large, multi-year transport infrastructure development (Moreton Bay Rail
Project; see Hanger et al.43) that spanned both study areas. Koalas were captured using traps or the flag and pole
technique and transported to the Endeavour Veterinary Ecology facilities in Toorbul, SEQ. Here, experienced
veterinarians conducted a comprehensive clinical examination under anaesthesia to assess koala health which
included the collection of a blood sample from the cephalic vein. During this examination, an estimated year
of birth was determined for each koala based on the wear of the upper premolar and molar teeth60. For joeys,
a date of birth was determined based on the developmental characteristics and size of the joey relative to a
reference chart of known-age joeys. Initial age estimation enabled us to determine the approximate age of each
koala during subsequent serum collection events. Following examination, healthy koalas were fitted with iden-
tification and telemetry devices to facilitate monitoring in the field. After recovery from anaesthesia, they were
transported back to the study area for release at their point of capture (or as close as practicable based on safety
or welfare concerns). Collaring and tracking of koalas began in March 2013 and ceased in January 2017.
Koala tracking. Koala tracking and monitoring followed the methods of Robbins et al.61 Briefly, koalas
weighing more than 3 kg were monitored using near-real-time biotelemetry devices (K-Tracker telemetry sys-
tem, LX Group, Sydney, New South Wales) that reported global positioning system (GPS) locations and activity
levels from each tagged koala via 12-hourly data uploads to an internet-based server. Koala position and activity
levels were monitored remotely via the internet every 24 h but koalas were also field-tracked using very high
frequency (VHF) radiotelemetry at least once per fortnight. Koalas weighing between 1 and 3 kg were not large
enough to be fitted with the K-Tracker collars, so were field-tracked using VHF radiotelemetry several times
a week. Koalas were monitored more frequently if there were health or welfare concerns, or if activity data
Scientific Reports | (2021) 11:4419 | https://doi.org/10.1038/s41598-021-83919-1 7
Vol.:(0123456789)www.nature.com/scientificreports/
reported by K-Tracker collars indicated low or zero activity. At each field monitoring event, koalas were exam-
ined with binoculars and various data recorded, including GPS location, tree DBH, tree species, tree height, the
koala’s height in the tree, external signs of health and the presence or absence of joeys. DBH was measured using
a DBH tape and the maximum DBH measurement was recorded for each tree. Tree height and koala height was
estimated by experienced field technicians. Koalas included in this study were monitored for a period ranging
from 1 to 46 months (mean = 7.98; 95% CI = 7.54 to 8.54 months), which enabled determination of movement
patterns and resource preferences.
Home range determination. The geo-referenced position data were used to calculate the home range sizes
for each individual koala using the adehabitatHR package in R 62. Prior to analysis, each position was mapped
with QGIS s oftware63 to provide a visual indication of home ranges and ensure quality of data. Home range sizes
were determined by minimum convex polygon (MCP 95%) estimation for each year the animal was monitored.
Mean home range sizes were determined by averaging home range estimates across all surveyed years for each
individual. In select cases, annual home ranges were estimated with lower confidence (cutoff MCP ≥ 60%) based
on visual inspections of home range asymptote plots.
Serum collection and determination of seroprevalence. Koala sera were collected opportunistically
between 2015 and 2017. A total of 529 blood samples were taken from 218 koalas. Some koalas were bled more
than once (range = 1–6 serum samples/koala; mean = 2.3), creating the opportunity to investigate seroconversion
in koalas. The presence of neutralising antibodies against RRV in each serum sample was tested in duplicate by
preparing a monolayer of mammalian cell lines (Vero) in a 12-well tissue culture plate. Dilutions (1:10) of koala
sera in RPMI-1640 (Sigma-Aldrich, USA) and the virus isolate RRV T4864 were introduced to each well, suf-
ficient to produce 50 to 60 plaques in the absence of antibody. Plates were incubated for two hours after which
the virus-serum mixture was supplemented with 0.75% carboxymethylcellulose (CMC, Sigma-Aldrich, USA)
overlay medium in ds-RPMI. Plates were incubated at 37 °C and 5% C O2 for a further 2 days, fixed with crystal
violet and examined for cytopathic effects (CPE), which can be determined by counting the number of plaques.
Neutralising antibodies bind to the virus, preventing CPE and the formation of plaques. Koala sera that neu-
tralised ≥ 50% of plaques in these assays were considered anti-RRV s eropositive65. This methodology has been
deployed in a number of s tudies66,67, and has been tested at dilution rates of > 160 fold confirming strong and
specific binding by the antibody67. We considered an animal sampled multiple times as seropositive if the animal
returned a positive test result during any individual sampling event.
Mosquito community composition. The mosquito community in each location was characterized from
February to March 2020; months associated with high mosquito and RRV activity in the region68. Mosquitoes
were collected using CDC light traps (Pacific Biologics, Brisbane, Australia) baited with C O2 from dry ice on
4 dates. Two traps were set within each environment either weekly or fortnightly depending on weather. Traps
were operated from 18:00 to 06:00 during each surveillance event. Captured mosquitoes were transported back
to the laboratory where they were stored at − 20 °C until identified to species using standard taxonomic keys.
Statistical analysis. Fisher’s exact test was used to compare differences in the number of positive sera
results obtained in each surveyed environment. Two-way ANOVA was used to compare differences in home
range sizes and the mean height of koalas in trees between seropositive and seronegative individuals. We used
a generalized linear logistic model with the logit link function to determine the association between sero status
and koala age. For this analysis, we grouped koalas into four age groups. Age groups included koalas < 2 years of
age, those between 2 and 4 years of age, those between 4 and 6 years of age, and those > 6 years of age. Koala sex
and location were included as co-variables in the model.
Regulatory approvals. The koala management program was conducted under approvals issued by
the Queensland Department of Agriculture and Fisheries (approvals CA 2012/03/597, CA 2013/09/719, CA
2014/06/777, CA 2015/03/852, and CA 2016/03/950). Animal ethics and research work was authorized by scien-
tific purposes permits issued by the Queensland Department of Environment and Heritage Protection (approv-
als WISP 11525212, WISP 16125415, WISP 13661313, WITK 14173714 and WISP 17273716). All experiments
were performed in accordance with the relevant guidelines and regulations. All studies involving animals are
reported in accordance with the ARRIVE guidelines for reporting experiments involving a nimals69.
Received: 28 August 2020; Accepted: 9 February 2021
References
1. Gonzalez-Astudillo, V., Allavena, R., McKinnon, A., Larkin, R. & Henning, J. Decline causes of Koalas in South East Queensland,
Australia: a 17-year retrospective study of mortality and morbidity. Sci. Rep. 7, 42587 (2017).
2. Ward, M. S. et al. Lots of loss with little scrutiny: The attrition of habitat critical for threatened species in Australia. Conserv. Sci.
Pract. 1, e117 (2019).
3. Martin, R. & Handasyde, K. The Koala: Natural History, Conservation and Management (University of New South Wales Press Ltd
(Hong Kong, Australian Natural History Series, 1999).
Scientific Reports | (2021) 11:4419 | https://doi.org/10.1038/s41598-021-83919-1 8
Vol:.(1234567890)www.nature.com/scientificreports/
4. McAlpine, C. et al. Conserving koalas: A review of the contrasting regional trends, outlooks and policy challenges. Biol. Conserv.
192, 226–236 (2015).
5. Shumway, N., Lunney, D., Seabrook, L. & McAlpine, C. Saving our national icon: An ecological analysis of the 2011 Australian
Senate inquiry into status of the koala. Environ. Sci. Policy 54, 297–303 (2015).
6. Adams-Hosking, C., Grantham, H. S., Rhodes, J. R., McAlpine, C. & Moss, P. T. Modelling climate-change-induced shifts in the
distribution of the koala. Wildlife Res. 38, 122–130 (2011).
7. Rhodes, J. R., Beyer, H., Preece, H. & McAlpine, C. South East Queensland koala population modelling study. UniQuest (2015).
8. Dique, D. S., Preece, H. J., Thompson, J. & de Villiers, D. L. Determining the distribution and abundance of a regional koala
population in south-east Queensland for conservation management. Wildlife Res. 31, 109–117 (2004).
9. Thompson, J. The comparative ecology and population dynamics of koalas in the Koala Coast region of south-east Queensland.
PhD Thesis, School of Integrative Biology, University of Queensland (2006).
10. Rhodes, J. R. et al. Using integrated population modelling to quantify the implications of multiple threatening processes for a
rapidly declining population. Biol. Conserv. 144, 1081–1088 (2011).
11. Denner, J. & Young, P. R. Koala retroviruses: Characterization and impact on the life of koalas. Retrovirology 10, 108 (2013).
12. Nyari, S. et al. Epidemiology of chlamydial infection and disease in a free-ranging koala (Phascolarctos cinereus) population. PloS
One 12 (2017).
13. Waugh, C. A. et al. Infection with koala retrovirus subgroup B (KoRV-B), but not KoRV-A, is associated with chlamydial disease
in free-ranging koalas (Phascolarctos cinereus). Sci. Rep. 7, 1–11 (2017).
14. McCallum, H., Kerlin, D. H., Ellis, W. & Carrick, F. Assessing the significance of endemic disease in conservation—koalas, chla-
mydia, and koala retrovirus as a case study. Conserv. Lett. 11, e12425 (2018).
15. Aldred, J., Campbell, J., Mitchell, G., Davis, G. & Elliott, J. Involvement of wildlife in the natural cycle of Ross River and Barmah
Forest viruses (Wildlife Disease Association Meeting, Melbourne, Australia, 1991).
16. Russell, R. C. Arboviruses and their vectors in Australia: An update on the ecology and epidemiology of some mosquito-borne
arboviruses. Rev. Med. Vet. Entomol. 83, 141–158 (1995).
17. Harley, D., Sleigh, A. & Ritchie, S. Ross River virus transmission, infection, and disease: A cross-disciplinary review. Clin. Microbiol.
Rev. 14, 909–932 (2001).
18. Seay, A. R. & Wolinsky, J. S. Ross river virus-induced demyelination: I Pathogenesis and histopathology. Ann. Neurol. 12, 380–389
(1982).
19. Azuolas, J., Wishart, E., Bibby, S. & Ainsworth, C. Isolation of Ross River virus from mosquitoes and from horses with signs of
musculoskeletal disease. Aust. Vet. J. 81, 344–347 (2003).
20. Stephenson, E. B., Peel, A. J., Reid, S. A., Jansen, C. C. & McCallum, H. The non-human reservoirs of Ross River virus: A systematic
review of the evidence. Parasite. Vector. 11, 188 (2018).
21. Skinner, E. B. et al. Associations between Ross River Virus infection in humans and vector-vertebrate community ecology in
Brisbane Australia. Vector-borne Zoonot. https://doi.org/10.1089/vbz.2019.2585 (2020).
22. Martin, L. B., Weil, Z. M. & Nelson, R. J. Seasonal changes in vertebrate immune activity: Mediation by physiological trade-offs.
Philos. T. R. Soc. B. 363, 321–339 (2008).
23. Nelson, R. J. & Demas, G. E. Seasonal changes in immune function. Quart. Rev. Biol. 71, 511–548 (1996).
24. Old, J. M. & Deane, E. M. Antibodies to the Ross River virus in captive marsupials in urban areas of eastern New South Wales
Australia. J. Wildlife Dis. 41, 611–614 (2005).
25. Muhar, A., Dale, P. E., Thalib, L. & Arito, E. The spatial distribution of Ross River virus infections in Brisbane: Significance of
residential location and relationships with vegetation types. Environ. Health Prev. 4, 184–189 (2000).
26. Ryan, P., Alsemgeest, D., Gatton, M. & Kay, B. Ross River virus disease clusters and spatial relationship with mosquito biting
exposure in Redland Shire, southern Queensland Australia. J. Med. Entomol. 43, 1042–1059 (2006).
27. Davies, N. et al. Movement patterns of an arboreal marsupial at the edge of its range: A case study of the koala. Movement Ecol. 1,
8 (2013).
28. Murphy, A. K. et al. Spatial and temporal patterns of Ross River virus in South East Queensland, Australia: Identification of hot
spots at the rural-urban interface. Preprint available at Research Square. https://doi.org/10.21203/rs.3.rs-16140/v1 (2020).
29. Potter, A., Johansen, C. A., Fenwick, S., Reid, S. A. & Lindsay, M. D. The seroprevalence and factors associated with Ross River
virus infection in western grey kangaroos (Macropus fuliginosus) in Western Australia. Vector-borne Zoonot. 14, 740–745 (2014).
30. Kay, B. H., Boyd, A. M., Ryan, P. A. & Hall, R. A. Mosquito feeding patterns and natural infection of vertebrates with Ross River
and Barmah Forest viruses in Brisbane Australia. Am. J. Trop. Med. Hyg. 76, 417–423 (2007).
31. Doak, D. F., Marino, P. C. & Kareiva, P. M. Spatial scale mediates the influence of habitat fragmentation on dispersal success:
Implications for conservation. Theor. Popul. Biol. 41, 315–336 (1992).
32. Fahrig, L. Effects of habitat fragmentation on biodiversity. Annu. Rev. Ecol. Evol. S. 34, 487–515 (2003).
33. Di Giulio, M., Holderegger, R. & Tobias, S. Effects of habitat and landscape fragmentation on humans and biodiversity in densely
populated landscapes. J. Environ. Manag. 90, 2959–2968 (2009).
34. Saunders, D. A., Hobbs, R. J. & Margules, C. R. Biological consequences of ecosystem fragmentation: A review. Conserv. Biol. 5,
18–32 (1991).
35. Allan, B. F., Keesing, F. & Ostfeld, R. S. Effect of forest fragmentation on Lyme disease risk. Conserv. Biol. 17, 267–272 (2003).
36. Ostfeld, R. S. Biodiversity loss and the rise of zoonotic pathogens. Clin. Microbiol. Infect. 15, 40–43 (2009).
37. Johnson, B. J. et al. The roles of mosquito and bird communities on the prevalence of West Nile virus in urban wetland and resi-
dential habitats. Urban Ecosyst. 15, 513–531 (2012).
38. Quigley, B. L., Ong, V. A., Hanger, J. & Timms, P. Molecular dynamics and mode of transmission of koala retrovirus as it invades
and spreads through a wild Queensland koala population. J. Virology 92 (2018).
39. Woodward, W. et al. Koalas on North Stradbroke Island: diet, tree use and reconstructed landscapes. Wildlife Res. 35, 606–611
(2008).
40. De Oliveira, S., Murray, P., De Villiers, D. & Baxter, G. Ecology and movement of urban koalas adjacent to linear infrastructure in
coastal south-east Queensland. Aust. Mammal. 36, 45–54 (2014).
41. Callaghan, J. et al. Ranking and mapping koala habitat quality for conservation planning on the basis of indirect evidence of tree-
species use: A case study of Noosa Shire, south-eastern Queensland. Wildlife Res. 38, 89–102 (2011).
42. MBRC. Koala Management Plan: The Mill at Moreton Bay Redevelopment, Moreton Bay Regional Council. www.moretonbay.qld.
gov.au/files/assets/public/services/projects/the-mill/the-mill-koala-management-plan.pdf (2016).
43. Hanger, J. et al. Final Technical Report: Moreton Bay Rail Koala Management Program (Department of Transport and Main Roads,
Queensland, 2017).
44. Fabijan, J. et al. Prevalence and clinical significance of koala retrovirus in two South Australian koala (Phascolarctos cinereus)
populations. J. Med. Microbiol. 68, 1072–1080 (2019).
45. Whisson, D. A., Zylinski, S., Ferrari, A., Yokochi, K. & Ashman, K. R. Patchy resources and multiple threats: How do koalas navigate
an urban landscape?. Landsc. Urban Plan. 201, 103854 (2020).
46. Mitchell, P. in Biology of the Koala (eds AK Lee, KA Handasyde, & GD Sanson) 171–187 (1990).
47. Jansen, C. C., Zborowski, P., Ritchie, S. A. & Van Den Hurk, A. F. Efficacy of bird-baited traps placed at different heights for col-
lecting ornithophilic mosquitoes in eastern Queensland Australia. Aust. J. Med. Entomol. 48, 53–59 (2009).
Scientific Reports | (2021) 11:4419 | https://doi.org/10.1038/s41598-021-83919-1 9
Vol.:(0123456789)www.nature.com/scientificreports/
48. Johnston, E. et al. Mosquito communities with trap height and urban-rural gradient in Adelaide, South Australia: Implications
for disease vector surveillance. J. Vect. Ecol. 39, 48–55 (2014).
49. Kay, B., Boreham, P. & Fanning, I. Host-feeding patterns of Culex annulirostris and other mosquitoes (Diptera: Culicidae) at
Charleville, southwestern Queensland Australia. J. Med. Entomol. 22, 529–535 (1985).
50. Johansen, C., Power, S. & Broom, A. Determination of mosquito (Diptera: Culicidae) bloodmeal sources in Western Australia:
Implications for arbovirus transmission. J. Med. Entomol. 46, 1167–1175 (2009).
51. Kay, B., Fanning, I. & Carley, J. The vector competence of Australian Culex annulirostris with Murray Valley encephalitis and Kunjin
viruses. A J. Exp. Biol. Med. 62, 641–650 (1984).
52. Jacups, S. P., Whelan, P. I. & Currie, B. J. Ross River virus and Barmah Forest virus infections: A review of history, ecology, and
predictive models, with implications for tropical northern Australia. Vector-Borne Zoonot. 8, 283–298 (2008).
53. Hassell, J. M., Begon, M., Ward, M. J. & Fèvre, E. M. Urbanization and disease emergence: dynamics at the wildlife–livestock–human
interface. Trends Ecol. Evol. 32, 55–67 (2017).
54. Kelly, T. R. et al. One Health proof of concept: Bringing a transdisciplinary approach to surveillance for zoonotic viruses at the
human-wild animal interface. Prev. Vet. Med. 137, 112–118 (2017).
55. Jansen, C. C. et al. Epidemiologic, entomologic, and virologic factors of the 2014–15 Ross River Virus outbreak, Queensland
Australia. Emerg. Infect. Dis. 25, 2243 (2019).
56. Woodruff, R. E. et al. Predicting Ross River virus epidemics from regional weather data. Epidemiology 1, 384–393 (2002).
57. Kelly-Hope, L. A., Purdie, D. M. & Kay, B. H. Ross River virus disease in Australia, 1886–1998, with analysis of risk factors associ-
ated with outbreaks. J. Med. Entomol. 41, 133–150 (2004).
58. Flies, E. J., Flies, A. S., Fricker, S. R., Weinstein, P. & Williams, C. R. Regional comparison of mosquito bloodmeals in South Aus-
tralia: Implications for Ross River virus ecology. J. Med. Entomol. 53, 902–910 (2016).
59. Stephenson, E. B., Murphy, A. K., Jansen, C. C., Peel, A. J. & McCallum, H. Interpreting mosquito feeding patterns in Australia
through an ecological lens: An analysis of blood meal studies. Parasite. Vector. 12, 156 (2019).
60. Gordon, G. Estimation of the age of the Koala, Phascolarctos cinereus (Marsupialia: Phascolarctidae), from tooth wear and growth.
Aust. Mammal. 14, 5–12 (1991).
61. Robbins, A., Loader, J., Timms, P. & Hanger, J. Optimising the short and long-term clinical outcomes for koalas (Phascolarc-
tos cinereus) during treatment for chlamydial infection and disease. PLoS ONE 13(12), e0209673. https://doi.org/10.1371/journ
al.pone.0209679 (2018).
62. Calenge, C. Home range estimation in R: the adehabitatHR package (Saint Benoist, Auffargis, France, Office national de la classe et
de la faune sauvage, 2011).
63. Quantum, G. QGIS geographic information system. Open source geospatial foundation project. https://qgis.osgeo.org (2015).
64. Doherty, R., Whitehead, R. & Gorman, B. The isolation of a third group A arbovirus in Australia, with preliminary observations
on its relationship to epidemic polyarthritis. Aust. J. Sci. 26, 183–184 (1963).
65. Gyawali, N., Taylor-Robinson, A. W., Bradbury, R. S., Potter, A. & Aaskov, J. G. Infection of Western Gray Kangaroos (Macropus
fuliginosus) with Australian arboviruses associated with human infection. Vector-Born Zoonotic Dis. 20, 33–39 (2020).
66. Togami, E. et al. First evidence of concurrent enzootic and endemic transmission of Ross River virus in the absence of marsupial
reservoirs in Fiji. Int. J. Infect. Dis. 96, 94–96 (2020).
67. Gyawali, N., Murphy, A. K., Hugo, L. E. & Devine, G. J. A micro-PRNT for the detection of Ross River virus antibodies in mos-
quito blood meals: A useful tool for inferring transmission pathways. PLoS ONE 15, e0229314. https://doi.org/10.1371/journ
al.pone.0229314 (2020).
68. Gatton, M. L., Kay, B. H. & Ryan, P. A. Environmental predictors of Ross River virus disease outbreaks in Queensland Australia.
Am. J. Trop. Med. Hyg. 72, 792–799 (2005).
69. McGrath, J. C., Drummond, G. B., McLachlan, E. M., Kilkenny, C. & Wainwright, C. L. Guidelines for reporting experiments
involving animals: the ARRIVE guidelines. Br. J. Pharmacol. 160(7), 1573–1576 (2010).
70. QDES. Queensland Department of Environment and Science, Wetland data - version 5 - Queensland series. https://www.des.qld.
gov.au (2015).
71. QDES. Queensland Department of Environment and Science, Matters of state environmental significance—wildlife habitat—koala
habitat areas—core. https://www.des.qld.gov.au (2020).
72. ESRI. Environmental Systems Research Institute. ArcGIS Desktop. Release 10.4 ed. Redlands, CA, USA. https://esri.com (2020).
Acknowledgements
This project was significantly supported by the Queensland Government (Department of Transport and Main
Roads), and specifically the Moreton Bay Rail project. We thank Moreton Bay Regional Council for initial liai-
son with the Moreton Bay Rail project and Endeavour Veterinary Ecology. We thank Dr Jonathan Darbro for
assisting with sample collection.
Author contributions
A.R., J.L., J.H. and G.J.D. devised the project. A.R., J.L. and J.H. coordinated field activities. N.G. and O.O.
analysed koala sera collections. B.J.J. collated and analysed the data, drafted the manuscript and designed the
figures. A.R., A.M., and G.J.D. contributed to the writing of the manuscript. All authors discussed the results
and commented on the manuscript.
Competing interests
AR and JH are employed by Endeavour Veterinary Ecology Pty Ltd. JH was involved in the development of
the K-Tracker biotelemetry system used during the koala management program. All other authors report no
competing interests.
Additional information
Supplementary Information The online version contains supplementary material available at https://doi.
org/10.1038/s41598-021-83919-1.
Correspondence and requests for materials should be addressed to B.J.J.
Reprints and permissions information is available at www.nature.com/reprints.
Publisher’s note Springer Nature remains neutral with regard to jurisdictional claims in published maps and
institutional affiliations.
Scientific Reports | (2021) 11:4419 | https://doi.org/10.1038/s41598-021-83919-1 10
Vol:.(1234567890)www.nature.com/scientificreports/
Open Access This article is licensed under a Creative Commons Attribution 4.0 International
License, which permits use, sharing, adaptation, distribution and reproduction in any medium or
format, as long as you give appropriate credit to the original author(s) and the source, provide a link to the
Creative Commons licence, and indicate if changes were made. The images or other third party material in this
article are included in the article’s Creative Commons licence, unless indicated otherwise in a credit line to the
material. If material is not included in the article’s Creative Commons licence and your intended use is not
permitted by statutory regulation or exceeds the permitted use, you will need to obtain permission directly from
the copyright holder. To view a copy of this licence, visit http://creativecommons.org/licenses/by/4.0/.
© The Author(s) 2021
Scientific Reports | (2021) 11:4419 | https://doi.org/10.1038/s41598-021-83919-1 11
Vol.:(0123456789)You can also read