The Impact of the COVID-19 Pandemic on Mobility Trends and the Associated Rise in Population-Level Physical Inactivity: Insights From ...
←
→
Page content transcription
If your browser does not render page correctly, please read the page content below
BRIEF RESEARCH REPORT
                                                                                                                                                  published: 14 March 2022
                                                                                                                                           doi: 10.3389/fspor.2022.773742

                                             The Impact of the COVID-19
                                             Pandemic on Mobility Trends and the
                                             Associated Rise in Population-Level
                                             Physical Inactivity: Insights From
                                             International Mobile Phone and
                                             National Survey Data
                         Edited by:          Laurence J. Dobbie 1,2† , Theresa J. Hydes 1,2 , Uazman Alam 1,2 , Abd Tahrani 3,4 and
                     John G. Morris,         Daniel J. Cuthbertson 1,2*
          Nottingham Trent University,       1
                                              Department of Cardiovascular and Metabolic Medicine, Institute of Life Course and Medical Sciences, University of
                    United Kingdom
                                             Liverpool, Liverpool, United Kingdom, 2 University Hospital Aintree, Liverpool University Hospitals National Health Service
                        Reviewed by:         (NHS) Foundation Trust, Liverpool, United Kingdom, 3 Institute of Metabolism and Systems, School of Clinical and
                           Karah Dring,      Experimental Medicine, University of Birmingham, Birmingham, United Kingdom, 4 Department of Diabetes and
          Nottingham Trent University,       Endocrinology, Birmingham Heartlands Hospital, Birmingham, United Kingdom
                       United Kingdom
           Alexandra Clarke-Cornwell,
University of Salford, United Kingdom        Introduction: The COVID-19 pandemic has reduced physical activity (PA) levels. This is
                  *Correspondence:           important as physical inactivity is linked to poor COVID-19 outcomes. This study aimed
                Daniel J. Cuthbertson
                                             to assess the impact of COVID-19 pandemic restrictions on greenspace and residence
      dan.cuthbertson@liverpool.ac.uk
                           † ORCID:
                                             mobility, walking levels and in turn how these translated to trends in (UK) PA levels.
                  Laurence J. Dobbie         Methods: Google Mobility Reports, the Oxford COVID-19 Government Response
     orcid.org/0000-0003-1908-848X
                                             Tracker and Apple Mobility geospatial datasets were interrogated for international
                    Specialty section:       data. Residence mobility represents home mobility, greenspace mobility includes parks,
         This article was submitted to       walking direction requests is proportion of walking directions; stringency index measures
Physical Activity in the Prevention and
                                             lockdown intensity. The Sports England Active Lives Survey dataset was assessed for
             Management of Disease,
                a section of the journal     complementary changes in English PA levels.
 Frontiers in Sports and Active Living
                                             Results: Using mobility data of 10 countries we observed that during lockdown there
      Received: 10 September 2021
       Accepted: 14 February 2022
                                             were reductions in greenspace mobility and walking directions alongside increased
         Published: 14 March 2022            residence mobility; more pronounced changes were seen in countries with higher
                                Citation:    stringency indices. From a UK perspective, complementary English PA survey data
        Dobbie LJ, Hydes TJ, Alam U,
                                             demonstrated the impact of these mobility changes on the proportion and demographic
 Tahrani A and Cuthbertson DJ (2022)
          The Impact of the COVID-19         characteristics of PA levels. The most vulnerable in society, the elderly (ages 75+)
 Pandemic on Mobility Trends and the         and Black and Asian minority ethnicity (BAME) individuals were more likely to become
  Associated Rise in Population-Level
      Physical Inactivity: Insights From
                                             physically inactive.
       International Mobile Phone and        Conclusions: The COVID-19 pandemic reduced greenspace mobility and walking
                 National Survey Data.
   Front. Sports Act. Living 4:773742.       direction requests globally. Complementary assessment of English PA levels
     doi: 10.3389/fspor.2022.773742          demonstrated a greater proportion of the population became inactive. Demographics

Frontiers in Sports and Active Living | www.frontiersin.org                          1                                             March 2022 | Volume 4 | Article 773742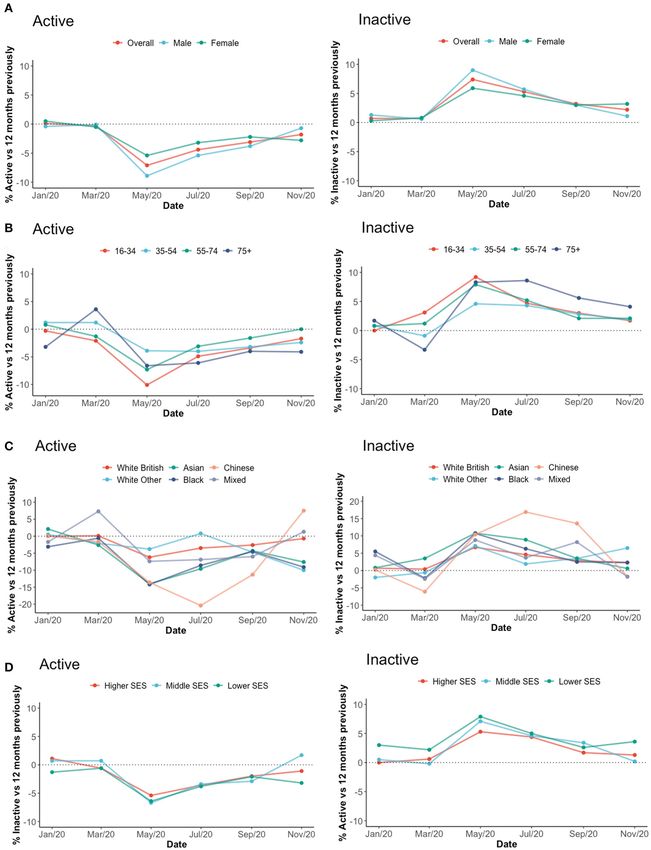
Dobbie et al.                                                                                                                Physical Activity and Mobility Trends

                                             (75+ and BAME) prone to worse COVID-19 outcomes became disproportionately
                                             inactive. UK Urban planning should prioritize greenspace development. This could
                                             improve city walkability and PA levels.

                                             Keywords: physical activity, COVID-19, mobility, exercise, green space, obesity, global health

INTRODUCTION                                                                            It is important to understand how PA levels changed during
                                                                                     this time, to help better inform future public health policies in
COVID-19 was declared a global pandemic on 11th of March                             general and in the event of a further pandemic. With this in
2020 (Ma and Holt, 2020). As of 8th of September 2021, more                          mind, we conducted a study that aimed to assess the impact
than 223 million COVID-19 cases have been confirmed along                            of the COVID-19 pandemic on global mobility using geospatial
with 4,605,021 COVID-19 related deaths (Caci et al., 2020; World                     mobile phone data and to determine within England (using
Health Organization., 2020). Aside from the association between                      complementary physical activity survey data), how shifting PA
physical inactivity and non-communicable diseases such as type                       patterns had influenced the proportions of the UK population
2 diabetes, cardiovascular disease and cancer, physical inactivity                   who fulfilled the recommended daily PA level (to be considered
is also an independent risk factor for COVID-19 severity. UK                         active vs. inactive) from March 2020 until March 2021. We
Biobank data (n = 3,87,109) has demonstrated physical inactivity                     hypothesized that mobility during the pandemic has changed
is associated with increased risk of COVID-19 hospitalization                        in proportion to lockdown stringency, a measure of lockdown
and that daytime physical activity (PA) is associated with a                         intensity, and that as PA levels have concomitantly reduced, the
reduced risk of severe COVID-19 illness (Hamer et al., 2020;                         proportion of the population who are inactive has increased. We
Rowlands et al., 2020). Thus, PA appears to confer a degree of                       were concerned about the demographic characteristics of those
protection against COVID-19. Lockdown restrictions, however,                         who have become most physically inactive (Tison Geoffrey, 2020;
have led to profound changes in mobility levels which may have                       Ong et al., 2021).
resulted in reduced PA (Almandoz et al., 2020; Ruiz-Roso et al.,
2020; Ong et al., 2021). For instance, working from home, stay
at home orders and closure of leisure facilities may have reduced
                                                                                     MATERIALS AND METHODS
exercise levels; this might have contributed to, and exacerbated                     Measure of Lockdown Restriction Intensity
adverse outcomes of the pandemic. PA level reductions may also                       Oxford COVID-19 Government Response Tracker
have been influenced by urban greenspace proximity (Mytton                           Oxford COVID-19 Government Response Tracker produced
et al., 2012).                                                                       a stringency index measuring lockdown restriction intensity
    Previous research has highlighted that the COVID-19                              over the pandemic (https://www.bsg.ox.ac.uk/research/research-
pandemic has negatively affected PA level (Gallè et al., 2020;                       projects/coronavirus-government-response-tracker,       accessed
Meyer et al., 2020). In a large questionnaire of Brazilian                           31/03/2021). This index ranges from 0 to 100 based on the
individuals (n = 2,140) PA level reduced significantly during                        government’s lockdown intensity (100 = most stringent
COVID restrictions when compared to pre-pandemic levels                              restrictions). The nine metrics used to determine the index are:
(Puccinelli et al., 2021). Similarly, two further Greek and                          stay-at-home requirement, school closure, workplace closure,
Australian questionnaire based studies highlighted that PA                           public event cancellation, public gathering restrictions, public
level significantly reduced during the Spring COVID-19                               transport closures, public information campaigns, internal
lockdown (Bourdas and Zacharakis, 2020; Gallo et al., 2020).                         movement restriction and international travel control. The
A Belgian study (n = 13,515) highlighted that the COVID-                             index for each day is the mean score of the nine metrics,
19 lockdown brought reductions in PA in those that were                              each metric is rated on a scale of 0 to 100. Analyses included
previously active, aged >55 years and of lower education                             countries (all members of the Organization for Economic
status (Constandt et al., 2020). Similarly, an Italian study                         Cooperation and Development) with high (India, UK, USA,
(n = 268) of patients with and without neuromuscular                                 Spain), medium (France, Germany) and low (Sweden, Australia,
disease showed that total weekly PA reduced during the                               Japan, Finland) stringency indexes. These countries were chosen
Spring COVID-19 lockdown (Di Stefano et al., 2021). A                                as they represent a broad spectrum of lockdown intensities (Hale
survey of 14 countries (n = 13,503) showed that compared                             et al., 2020).
to before the COVID-19 pandemic self-reported moderately
vigorous physical activity (MVPA) reduced by 41% and                                 Measurements of Mobility: Global Data
vigorous physical activity (VPA) reduced by ∼42%, with                               Geospatial mobile phone data was obtained between February
reductions greater for young and old rather than middle-                             2020 and March 2021.
aged individuals (Wilke et al., 2021). The effects of COVID-19
lockdowns on PA level is summarized by a systematic review                           Greenspace and Residential Mobility
highlighting across 64 studies that lockdowns reduced PA and                         Google Community Mobility Reports present mobility data
increased sedentary behavior in a diverse range of populations                       which accounts for visits to, and length of stay at different
(Stockwell et al., 2021).                                                            geographical areas and compares it to baseline (https://www.

Frontiers in Sports and Active Living | www.frontiersin.org                      2                                        March 2022 | Volume 4 | Article 773742
Dobbie et al. Physical Activity and Mobility Trends
google.com/covid19/mobility/, accessed 31/03/2021). This is measures in terms of demographics and location (Sport England,
anonymized data obtained from Google services like Google 2020).
maps. Individuals were included in internationally collected
data if they turned on location history settings, which by Statistics
default is selected to be on in Google services. We examined Data was analyzed using R version 4.1.1 (R Foundation for
two aspects of mobility: greenspace and residence mobility. Statistical Computing, Vienna, Austria). Data was tidied with
Greenspace mobility represents mobility to areas including parks the tidyr package. All graphs were created using the R package
and national parks but not including the general outdoors i.e. ggplot. Graphs were created for each measure separately, i.e:
rural areas. Residential mobility represents any proportion of greenspace mobility, residence mobility, stringency index and
mobility occurring within the home. Changes in these mobility walking direction requests. For measures of mobility, stringency
domains were examined across 10 countries of varying stringency index and walking direction requests this was calculated based
indexes. The baseline is a median value of the corresponding on a 7-day rolling average. A descriptive analysis was then
full day, i.e. 24 hour period, over a 5-week period (03/01/2020– performed of mobility data by stringency index using the graphs.
06/02/2020). Therefore the baseline value is 7 individual values Survey data was analyzed based on sequential 2 monthly data,
corresponding to that day’s average over 5 separate 24 hour with active and inactive data split into separate graphs.
periods (Google LLC, 2020).
Ethical Approval
Walking Requests All Google and Apple data used robust anonymisation techniques
Apple Mobility Trends provides Apple maps walking direction to ensure no individual could be identified. Therefore, no ethical
request data which represents the volume of direction requests approval was required.
compared to a baseline value on 13/01/2020 (https://covid19.
apple.com/mobility, accessed 31/03/2021). This was calculated
by counting the number of requests made to Apple maps for
RESULTS
directions in the selected countries. For data to be available, Measurements of Mobility: Global Data
a minimum number of requests had to be made to ensure Greenspace Mobility Trends and Relationship With
user anonymity. The data provides no demographic information Stringency Index
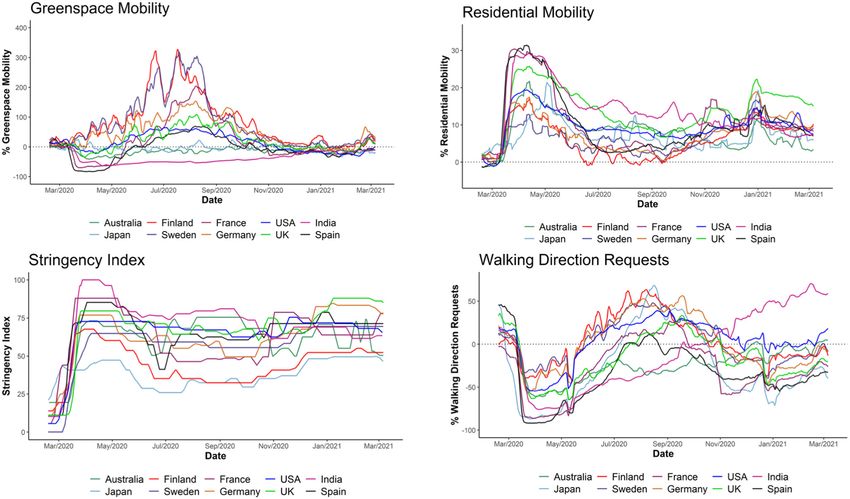
(COVID-19, 2020). Figure 1 presents global mobility data including walking
direction requests, greenspace mobility, residence mobility
Physical Activity: English Data and Stringency Index. Finland, Sweden, Australia and
The Sports England Active Lives Surveys presents English data Japan had a lower stringency index whereas UK, USA,
on active and inactive individuals (11/2019–11/2020) (https:// India and Spain had a higher stringency index (Figure 1;
www.sportengland.org/know-your-audience/data/active-lives/ Supplementary Tables S2–S5). Finland and Sweden trended to
active-lives-data-tables, accessed 01/07/2021). The survey is sent have the higher greenspace mobility across the pandemic. Most
to a randomly selected sample of households across England and European countries (France, Germany, Sweden, Finland) had
includes a minimum of 500 people from each local authority. greater maximal greenspace mobility than the UK. Spain had a
The survey is completed either electronically online or via a lesser maximal greenspace mobility than the UK, but also had a
postal paper version. The survey takes ∼15 min to complete. high stringency index. Outliers to greenspace trends were Japan
Each of the six surveys were over the previous 2 months (Range and Australia. Japan had low SI but profound reductions in
15,163–39,041, N = ∼29,372). The values presented represent % greenspace mobility. Australia had low SI, and large reductions
difference compared to 12 months previously. PA is defined as in greenspace mobility, but to a lesser degree than Japan.
≥10 min of moderately intense exercise. Active individuals were
those exercising >150 min/week; inactive individuals were those Residence Mobility Trends and Relationship With
exercisingDobbie et al. Physical Activity and Mobility Trends
FIGURE 1 | A comparison of mobility trends and stringency index for each country analyzed (Global Data). Google data (https://www.google.com/covid19/mobility/,
accessed 10/03/2021) is % mobility. Apple data (https://covid19.apple.com/mobility, accessed 10/03/2021) presents walking direction requests. Oxford data (https://
www.bsg.ox.ac.uk/research/research-projects/coronavirus-government-response-tracker, accessed 10/03/2021) describes the stringency index.
smaller reductions in walking directions. Outliers to this trend individuals (Figures 2A–D). No obvious differences were noted
were USA, France, Australia and Japan. Similar to residence between individuals with low and high SES.
mobility, USA had lesser reductions in walking directions and
France had greater reductions in walking directions. Despite the English Physical Activity Levels Over 1st Lockdown,
low SI, Japan and Australia had greater reductions in walking From English Survey Data
directions than other low SI countries. Japan had greater overall By comparing May 2020 to January 2020 the first UK lockdown
reductions in walking directions than Australia. brought a 7% reduction in active individuals with a 6.7% increase
in inactive individuals (Figure 2A; Supplementary Tables 6, 7).
UK Mobility Trends and Relationship With Stringency Males, those aged 16–34 years and BAME individuals had the
Index Obtained From Global Mobility Data greatest decrease in PA and increase in inactivity (Figures 2A–C:
The March 2020 lockdown brought increased residence mobility Males −8.5% Active +7.7% Inactive, Age 16–34 −9.8% Active
alongside reduced greenspace mobility and walking direction +9.2% Inactive, Asian −16.1% Active +10.0% Inactive, Black
requests (Figure 1; Supplementary Tables 2–5). These changes −11.1% Active +5.2% Inactive, Chinese −13.6% Active, +10.2%
persisted until May when the stringency index reduced. Inactive). Those aged 35–54 years, females and of Caucasian
Greenspace mobility and walking direction requests increased British ethnicity tended to maintain baseline PA and inactivity
beyond baseline levels following lockdown, but trended down levels (Figures 2A–C: Age 35–54: −5.1% Active +3.8% Inactive,
again during the second wave. Residence mobility consistently Females: −5.9% Active +5.6% Inactive, White British −6.2%
stayed above baseline. Active +6.0% Inactive).
Physical Activity: English Data English Physical Activity Levels Over 2nd Lockdown,
English Physical Activity Surveys From English Survey Data
Between November 2019 and November 2020 the By comparing November 2020 to January 2020 the 2nd
proportion of active individuals decreased and inactive covid wave brought a 1.7% reduction in active individuals
individuals increased (Figure 2A Left Active, Right Inactive, and a 1.5% increase in inactive individuals (Figure 2A;
Supplementary Tables 6, 7). Active individuals tended to Supplementary Tables 6, 7). Females, those aged 75+
be middle aged, female and Caucasian ethnicity; inactive and from BAME backgrounds had greatest decreases in
individuals tended to be at the extremes of age and BAME PA and increases in inactivity (Figures 2A–C: Female
Frontiers in Sports and Active Living | www.frontiersin.org 4 March 2022 | Volume 4 | Article 773742Dobbie et al. Physical Activity and Mobility Trends FIGURE 2 | Trend in physical activity by sex, age and socioeconomic status (English data). This figure presents the Sports England Survey data (https://www. sportengland.org/know-your-audience/data/active-lives/active-lives-data-tables, accessed 01/07/2021) on % active (left-hand side) and inactive (right-hand side) individuals, SES, socioeconomic-status. (A) Sex, (B) age, (C) Ethnicity, (D) SES. −3.3% Active +2.9% Inactive, Age 75+ −0.9% active individuals maintained baseline PA levels (Figures 2A–C: Male +2.4% inactive, Asian −9.7% active−0.2% inactive, Black −0.3% active −0.2% inactive, White British −0.7% active −6.0% active −3.2% inactive). Males and Caucasian British +1.6% inactive). Frontiers in Sports and Active Living | www.frontiersin.org 5 March 2022 | Volume 4 | Article 773742
Dobbie et al.                                                                                                  Physical Activity and Mobility Trends

DISCUSSION                                                               exercise spaces is vital. Wider access to greenspaces during
                                                                         future pandemic lockdowns would help our population to remain
Main Findings                                                            active whilst leisure facilities close. Overall, with the increasing
This data shows that the COVID-19 pandemic has profoundly                incidence of obesity and related diseases within the UK, more
changed global mobility patterns. Within the UK individuals              effective UK urban planning may help improve PA levels and
had a greater proportional reduction in greenspace mobility              consequently reduce obesity prevalence and health inequalities
with reduced walking direction requests, compared to other               (Mitchell et al., 2015; Google LLC, 2020; Hale et al., 2020; Sport
European nations (France, Germany, Sweden, Finland). The                 England, 2020; COVID-19, 2020; NHS Digital., 2021).
suggestion from this data that the UK has become more
physically inactive and been disproportionately affected by              Comparison to Existing Data
lockdown measures is borne out by complementary PA survey                Within the UK ∼2.7 million people live over a 10-minute walk
data from England. From the survey data, the proportion                  from a greenspace. By 2025 there will be ∼6.5% increase in
of individuals considered physical inactive (according to PA             people living over a 10 minute walk from greenspaces (Green
guideline recommendations) increased significantly, with the             Space Index, 2020). This is concerning given those living closer
impact disproportionately affecting those of an older age and            to greenspaces tend to achieve recommended PA levels and
BAME ethnicity. This is important considering their association          have lower levels of diabetes and obesity (Mytton et al., 2012;
with adverse COVID-19 outcomes (Williamson et al., 2020) but             Dalton et al., 2016; Zhang et al., 2018; de Keijzer et al., 2019).
also considering the known association of PA and even daily              These facts signify the importance of UK urban planning in
walking with long term outcomes (Saint-Maurice et al., 2022).            prioritizing greenspace development. This has potential to make
   There was a correlation between higher stringency indices and         the population more active (Mytton et al., 2012).
shifting patterns of PA. This is exemplified by European nations            Previous research has highlighted that the COVID-19
(France, Spain, UK) with stringent restrictions during lockdown          pandemic has negatively affected PA level (Gallè et al., 2020;
having the largest reductions in walking directions. Countries           Meyer et al., 2020). Specifically survey research in Brazil, Greece,
with the most stringent restrictions introduced penalties/fines          Australia, Belgium and Italy have all demonstrated PA level to
for leaving the home without due reason. Future UK pandemic              have reduced (Bourdas and Zacharakis, 2020; Constandt et al.,
planning, however, should prioritize keeping the population              2020; Gallo et al., 2020; Di Stefano et al., 2021; Puccinelli et al.,
active, which could involve greenspace development.                      2021). In addition, a multinational survey of 14 countries (n =
                                                                         13,503) reported that self-reported moderately vigorous physical
Implications for Policy Makers                                           activity (MVPA) reduced by 41% and vigorous physical activity
The study’s data has implications for UK policy makers. Public           (VPA) reduced by ∼42% when compared to before the COVID-
health messaging around maintenance of PA should focus upon              19 pandemic. These reductions were greater for the young and
older age and BAME ethnicities and tackle weight change.                 old rather than middle-aged individuals (Wilke et al., 2021). Our
Indeed, Public Health England reported that 32% of older people          data has added benefit given the fact we show potential change in
were inactive between March 2019 to May 2020, with average               PA level over two analytical techniques. Specifically, the Sports
muscle strength and balance decreasing (Health Economics,                England Active lives data shows in a large sample in England
2021). This is important as physical deconditioning can                  that PA levels reduced. In addition, global mobility data from
predispose to mechanical falls and fractures in this demographic.        10 countries including the UK indicates that higher lockdown
In addition, recent Diabetes Prevention Program (DPP) data,              intensities led to lower levels of greenspace mobility, which could
which recruits a significant proportion of older individuals,            act as a proxy for PA in greenspace. This offers a specific strategy
highlighted an average weight difference of 2kg in those currently       in that greenspace development must be prioritized to improve
enrolling for the DPP vs. before the pandemic, indicating                PA in future pandemic lockdowns.
alarming trends in weight gain of the UK population (Valabhji               Japan was a outlier to the data trends. Despite a low stringency
et al., 2021).                                                           index it had profound reductions in walking directions, little
    These data also have implications for future UK urban                change in greenspace mobility and higher levels of residence
planning which prioritizes greenspace development. Greenspaces           mobility relative to other low stringency index countries
provide exercise spaces which are free to all and naturally              (Finland, Sweden). This mirrors Japanese mobile phone Spatial
socially distanced and ventilated. Access to greenspaces has             Statistics data, reporting residence mobility increased in Japan
been shown to correlate positively with physical activity levels,        during the Spring 2020 lockdown (Nagata et al., 2021). In
and thus has the potential to improve outdoor exercise levels            addition, analyses using 2.00,000 anonymized Tokyo mobile
(Mytton et al., 2012; Gladwell et al., 2013; WHO., 2016; Wang            phone users reported a ∼50% reduction in mobility with
et al., 2019). In addition, a systematic review demonstrated             lockdown, with this data strongly related to non-compulsory
an inverse association between surrounding greenness and all-            COVID restrictions. The authors even report a significant
cause mortality, with the authors reporting the importance of            reduction in mobility before the spread of COVID-19 in Tokyo,
greenspace implementation as a public health measure (Rojas-             supporting the populations cooperation with lockdown measures
Rueda et al., 2019). Given the risk of future mutated COVID-             (Yabe et al., 2020). These data explain the trends observed,
19 strains and the independent association between physical              and could reflect cultural differences in Japan, whereby citizens
inactivity and disease severity, the development of outdoor              are more compliant with lockdown measures than the other

Frontiers in Sports and Active Living | www.frontiersin.org          6                                      March 2022 | Volume 4 | Article 773742
Dobbie et al. Physical Activity and Mobility Trends
countries included in analysis. This may in part be related nations. In addition the Survey data utilized self-reported PA.
to Asia’s previous experience with the severe acute respiratory This is known to overestimate PA and underestimate physical
syndrome (SARS) epidemic. Australia was another outlier, inactivity when compared to objective measures of PA so may
although to a lesser extent than Japan. This could be explained bias findings (Klesges et al., 1990; Jakicic et al., 1998; Tzetzis et al.,
by it being in the Southern hemisphere, and thus the baseline 2001).
data values which acted as comparison were in Australian
Summertime, reducing this data’s comparability when analyzed CONCLUSIONS
beside Northern hemisphere data.
The COVID-19 pandemic reduced global greenspace mobility
Strengths/Limitations and PA levels in England, with a greater proportion of the
A major strength of this study is that we assessed ten countries population not meeting the recommended PA guidelines and
using two large data sources and thus our findings are based thus being considered physically inactive. Reduced exercise in
on data from the mobility of millions of people from diverse greenspace could have contributed to the overall reduction
countries. Secondly, we interrogated a national survey of English of PA levels in England. Alarmingly, those with demographic
PA levels to support the impact of this geospatial data on our characteristics (age 75+ and BAME ethnicities) prone to worse
own population’s PA levels. This facilitated assessment of how COVID-19 outcomes became disproportionately physically
individuals’ PA levels and the proportion of active vs. inactive inactive. The work additionally highlights the role of greenspaces
individuals within the population have concomitantly changed and the relevance of future UK urban planning in promoting
reflecting the reduced mobility. physical activity and thus its importance in improving health-
This dataset has limitations. The Google analyses are related outcomes across multiple chronic and infectious diseases
interpreted from a baseline value calculated within a 5-week including COVID-19.
period from January-February. This means the data may not
be fully comparable to mobility data throughout the year. For
instance, mobility will naturally vary with seasonal weather
DATA AVAILABILITY STATEMENT
changes, i.e. individuals are generally indoors during winter. The original contributions presented in the study are included
Working from home will have significantly impacted residence in the article/Supplementary Material, further inquiries can be
mobility, which will have contributed to the increased residence directed to the corresponding author.
mobility reported. In addition, mobility data is a measure of
location, meaning mobility to greenspace and residence may
not directly correlate with activity and inactivity respectively. AUTHOR CONTRIBUTIONS
The apple dataset represents a subset of users who requested
apple maps walking directions. A specific demographic could LD, TH, UA, AT, and DC performed material preparation, data
potentially use apple maps for walking meaning the data may collection, and analysis. LD wrote the first draft of the manuscript
not reliably estimate population PA levels. In addition, even and serves as the data guarantor. All authors contributed to the
when a walking direction was requested walking may not have study conception and design, commented on subsequent versions
taken place meaning this parameter may not directly relate of the manuscript, and read and approved the final manuscript.
to physical activity. Finally, apple and Google mobility data
do not provide any demographic information and data about SUPPLEMENTARY MATERIAL
relative numbers of people it represents. This means we cannot
state how this directly translates to the overall population. The Supplementary Material for this article can be found
Survey data represents the views of individuals within England, online at: https://www.frontiersin.org/articles/10.3389/fspor.
meaning results may not be directly translatable to other UK 2022.773742/full#supplementary-material
REFERENCES COVID-19 on levels and patterns of exercise among adults in Belgium. Int. J.
Environ. Res. Public Health 17, 1–10. doi: 10.3390/ijerph17114144
Almandoz, J. P., Xie, L., Schellinger, J. N., Mathew, M. S., Gazda, C., and COVID-19. (2020). Mobility Trends Reports – Apple. Available online at: https://
Ofori, A. (2020). Impact of COVID−19 stay-at-home orders on weight covid19.apple.com/mobility (accessed November 8, 2020).
- related behaviours among patients with obesity. Clin. Obes. 10, 1–9. Dalton, A. M., Jones, A. P., Sharp, S. J., Cooper, A. J. M., Griffin, S., and Wareham,
doi: 10.1111/cob.12386 N. J. (2016). Residential neighbourhood greenspace is associated with reduced
Bourdas, D. I., and Zacharakis, E. D. (2020). Impact of COVID-19 lockdown risk of incident diabetes in older people: a prospective cohort study. BMC Public
on physical activity in a sample of Greek adults. Sports 8, 1–13. Health 16, 1–10. doi: 10.1186/s12889-016-3833-z
doi: 10.3390/sports8100139 de Keijzer, C., Basagaña, X., Tonne, C., Valentín, A., Alonso, J., Ant,ó J.
Caci, G., Albini, A., Malerba, M., Noonan, D. M., Pochetti, P., and Polosa, R. M., et al. (2019). Long-term exposure to greenspace and metabolic
(2020). COVID-19 and obesity: dangerous liaisons. J. Clin. Med. 9, 2511. syndrome: a Whitehall II study. Environ. Pollut. 255, 113231.
doi: 10.3390/jcm9082511 doi: 10.1016/j.envpol.2019.113231
Constandt, B., Thibaut, E., De Bosscher, V., Scheerder, J., Ricour, M., and Willem, Di Stefano, V., Battaglia, G., Giustino, V., Gagliardo, A., D’Aleo, M.,
A. (2020). Exercising in times of lockdown: an analysis of the impact of Giannini, O., et al. (2021). Significant reduction of physical activity
Frontiers in Sports and Active Living | www.frontiersin.org 7 March 2022 | Volume 4 | Article 773742Dobbie et al. Physical Activity and Mobility Trends
in patients with neuromuscular disease during COVID-19 pandemic: and rest/sleep with risk of COVID-19: a UK biobank study. Mayo Clin. Proc.
the long-term consequences of quarantine. J. Neurol. 268, 20–26. 96, 156–164. doi: 10.1016/j.mayocp.2020.10.032
doi: 10.1007/s00415-020-10064-6 Ruiz-Roso, M. B., Knott-Torcal, C., Matilla-Escalante, D. C., Garcimartín, A.,
Gallè, F., Sabella, E. A., Ferracuti, S., De Giglio, O., Caggiano, G., Protano, C., Sampedro-Nuñez, M. A., and Dávalos, A. (2020). Covid-19 lockdown and
et al. (2020). Sedentary behaviors and physical activity of Italian undergraduate changes of the dietary pattern and physical activity habits in a cohort of patients
students...: iSearch. Int. J. Environ. Res. Public Health Artic. 17, 1–11. with type 2 diabetes mellitus. Nutrients 12, 1–16. doi: 10.3390/nu12082327
doi: 10.3390/ijerph17176171 Saint-Maurice, P. F., Graubard, B. I., Troiano, R. P., Berrigan, D., Galuska, D.
Gallo, L. A., Gallo, T. F., Young, S. L., Moritz, K. M., and Akison, L. K. (2020). A., and Fulton, J. E. (2022). Estimated number of deaths prevented through
The impact of isolation measures due to covid-19 on energy intake and increased physical activity among US adults. JAMA Intern Med. E1–E4.
physical activity levels in australian university students. Nutrients 12, 1–14. doi: 10.1001/jamainternmed.2021.7755
doi: 10.3390/nu12061865 Sport England. (2020). Active Lives Data Tables. London: Sport England.
Gladwell, V. F., Brown, D. K., Wood, C., Sandercock, G. R., and Barton, J. L. (2013). Available online at: https://www.sportengland.org/know-your-audience/data/
The great outdoors: how a green exercise environment can benefit all. Extrem. active-lives/active-lives-data-tables (accessed November 8, 2020.).
Physiol. Med. 2, 1. doi: 10.1186/2046-7648-2-3 Stockwell, S., Trott, M., Tully, M., Shin, J., Barnett, Y., and Butler, L. (2021).
Google LLC (2020). COVID-19 Community Mobility Reports. Changes in physical activity and sedentary behaviours from before to during the
Green Space Index. (2020). Looking to the Future. Available online at: https:// COVID-19 pandemic lockdown: a systematic review. BMJ Open Sport Exerc.
storymaps.arcgis.com/stories/83b164ac89d14890a7004772da10ada4 (accessed Med. 7, 1–8. doi: 10.1136/bmjsem-2020-000960
November 29, 2020). Tison Geoffrey, H. (2020). Worldwide Effect of COVID-19 on Physical Activity.
Hale, T., Angrist, N., Goldszmidt, R., Kira, B., Petherick, A., Phillips, Ann. Intern. Med. Intern. 173, 1–3. doi: 10.7326/A19-0044
T., et al. (2020). Coronavirus Government Response Tracker. Blavatnik Tzetzis, G., Avgerinos, A., Vernadakis, N., and Kioumourtzoglou, E. (2001).
School of Government. Oxford COVID-19 Gov Response Tracker. Available Differences in self-reported perceived and objective measures of duration and
online at: https://www.bsg.ox.ac.uk/research/research-projects/coronavirus- intensity of physical activity for adults in skiing. Eur. J. Epidemiol. 17, 217–222.
government-response-tracker (accessed November, 1, 2020). doi: 10.1023/A:1017925731003
Hamer, M., Kivimäki, M., Gale, C. R., and Batty, G. D. (2020). Lifestyle risk factors, Valabhji, J., Barron, E., Bradley, D., Bakhai, C., Khunti, K., and Jebb, S. (2021).
inflammatory mechanisms, and COVID-19 hospitalization: a community- Effect of the COVID-19 pandemic on body weight in people at high risk of type
based cohort study of 387,109 adults in UK. Brain Behav. Immun. 87, 184–187. 2 diabetes referred to the English NHS Diabetes Prevention Programme. Lancet
doi: 10.1016/j.bbi.2020.05.059 Diabetes Endocrinol. 8587, 19–21. doi: 10.1016/S2213-8587(21)00218-7
Health Economics, Modelling Team, and Older Adults Team. (2021). Wider Wang, H., Dai, X., Wu, J., Wu, X., and Nie, X. (2019). Influence of urban green
impacts of COVID-19 on physical activity, deconditioning and falls in older open space on residents’ physical activity in China. BMC Public Health 19, 1–12.
adults. Public Health Engl. doi: 10.1186/s12889-019-7416-7
Jakicic, J. M., Polley, B. A., and Wing, R. R. (1998). Accuracy of self-reported WHO. (2016). Urban Green Space Interventions and Health: A Review of Impacts
exercise and the relationship with weight loss in overweight women. Med. Sci. and Effectiveness. Copenhagen: WHO Regional Office for Europe.
Sports Exerc. 30, 634–638. doi: 10.1097/00005768-199804000-00024 Wilke, J., Mohr, L., Tenforde, A. S., Edouard, P., Fossati, C., and González-
Klesges, R. C., Eck, L. H., Mellon, M. W., Fulliton, W., Somes, G. W., and Hanson, Gross, M. (2021). A pandemic within the pandemic? Physical activity levels
C. L. (1990). The accuracy of self-reports of physical activity. Med. Sci. Sports substantially decreased in countries affected by covid-19. Int. J. Environ. Res.
Exerc. 22, 690–697. doi: 10.1249/00005768-199010000-00022 Public Health 18, 1–12. doi: 10.3390/ijerph18052235
Ma, R. C. W., and Holt, R. I. G. (2020). COVID-19 and diabetes. Diabet. Med. 37, Williamson, E. J., Walker, A. J., Bhaskaran, K., Bacon, S., Bates, C.,
723–725. doi: 10.1111/dme.14300 and Morton, C. E. (2020). Factors associated with COVID-19-related
Meyer, J., McDowell, C., Lansing, J., Brower, C., Smith, L., Tully, M., et al. (2020). death using OpenSAFELY. Nature 584, 430–436. doi: 10.1038/s41586-020-
Changes in physical activity and sedentary behavior in response to covid-19 2521-4
and their associations with mental health in 3052 us adults. Int. J. Environ. Res. World Health Organization. (2020). Weekly Operational Update on COVID-19.
Public Health 17, 1–13. doi: 10.3390/ijerph17186469 Washington, DC: World Health Organization.
Mitchell, R. J., Richardson, E. A., Shortt, N. K., and Pearce, J. R. Yabe, T., Tsubouchi, K., Fujiwara, N., Wada, T., Sekimoto, Y., and Ukkusuri,
(2015). Neighborhood environments and socioeconomic inequalities S. V. (2020). Non-compulsory measures sufficiently reduced human
in mental well-being. Am. J. Prev. Med. 49, 80–84. doi: 10.1016/ mobility in Tokyo during the COVID-19 epidemic. Sci. Rep. 10, 1–9.
j.amepre.2015.01.017 doi: 10.1038/s41598-020-75033-5
Mytton, O. T., Townsend, N., Rutter, H., and Foster, C. (2012). Green Zhang, L., Kwan, M. P., Chen, F., Lin, R., and Zhou, S. (2018). Impacts of individual
space and physical activity: an observational study using health daily greenspace exposure on health based on individual activity space and
survey for England data. Health Place 18, 1034–1041. doi: 10.1016/ structural equation modeling. Int. J. Environ. Res. Public Health 15, 2323.
j.healthplace.2012.06.003 doi: 10.3390/ijerph15102323
Nagata, S., Nakaya, T., Adachi, Y., Inamori, T., Nakamura, K., and Arima, D.
(2021). Mobility change and covid-19 in Japan: mobile data analysis of locations Conflict of Interest: The authors declare that the research was conducted in the
of infection. J. Epidemiol. 31, 387–391. doi: 10.2188/jea.JE20200625 absence of any commercial or financial relationships that could be construed as a
NHS Digital. (2021). Statistics on Obesity, Physical Activity and Diet. National potential conflict of interest.
Statistics.
Ong, J. L., Lau, T. Y., Massar, S. A. A., Chong, Z. T., Ng, B. K. L., and Koek, D.
Publisher’s Note: All claims expressed in this article are solely those of the authors
(2021). COVID-19-related mobility reduction: heterogenous effects on sleep
and physical activity rhythms. Sleep 44, 1–13. doi: 10.1093/sleep/zsaa179 and do not necessarily represent those of their affiliated organizations, or those of
Puccinelli, P. J., da Costa, T. S., Seffrin, A., de Lira, C. A. B., Vancini, the publisher, the editors and the reviewers. Any product that may be evaluated in
R. L., Nikolaidis, P. T., et al. (2021). Correction to: reduced level of this article, or claim that may be made by its manufacturer, is not guaranteed or
physical activity during COVID-19 pandemic is associated with depression endorsed by the publisher.
and anxiety levels: an internet-based survey. BMC Public Health 21, 1–11.
doi: 10.1186/s12889-021-10684-1 Copyright © 2022 Dobbie, Hydes, Alam, Tahrani and Cuthbertson. This is an open-
Rojas-Rueda, D., Nieuwenhuijsen, M. J., Gascon, M., Perez-Leon, D., and access article distributed under the terms of the Creative Commons Attribution
Mudu, P. (2019). Green spaces and mortality: a systematic review and License (CC BY). The use, distribution or reproduction in other forums is permitted,
meta-analysis of cohort studies. Lancet Planet Health 3, e469–e477. provided the original author(s) and the copyright owner(s) are credited and that the
doi: 10.1016/S2542-5196(19)30215-3 original publication in this journal is cited, in accordance with accepted academic
Rowlands, A. V., Kloecker, D. E., Chudasama, Y., Davies, M. J., Dawkins, N. P., and practice. No use, distribution or reproduction is permitted which does not comply
Edwardson, C. L. (2020). Association of timing and balance of physical activity with these terms.
Frontiers in Sports and Active Living | www.frontiersin.org 8 March 2022 | Volume 4 | Article 773742You can also read