The NPXLab Suite 2018: a free features rich set of tools for the analysis of neuro-electric signals - WSEAS
←
→
Page content transcription
If your browser does not render page correctly, please read the page content below
WSEAS TRANSACTIONS on SYSTEMS and CONTROL                                                        Luigi Bianchi

The NPXLab Suite 2018: a free features rich set of tools for the analysis
                    of neuro-electric signals.
                                           LUIGI BIANCHI
                   Department of Civil Engineering and Computer Science Engineering
                                   University of Rome “Tor Vergata”
                                  Via del Politecnico 1, 00133, Rome
                                                 ITALY
                       luigi.bianchi@uniroma2.it http://www.brainterface.com

Abstract: - In this manuscript an overview of the features of the NPXLab Suite, is provided. Designed to
analyze electroencephalographic data (EEG), it has been successfully used in several scientific publications and
downloaded from all over the world. It allows to compute Event Related Potentials, to perform Spectral
Analysis, Statistical tests, to analyze Brain-Computer Interface signals as well as to manipulate files in an easy
to use environment. Available for free at www.brainterface.com, it supports several different file formats also
from commercial EEG/MEG system vendors.

Key-Words: - NPXLab, EEG, MEG, ERP, Spectral Analysis, ICA, File Conversion

1 Introduction                                                  procedures. In this scenario a platform which can be
In recent years, some free tools for analyzing                  used in a wide range of situations by people that has
neuroelectric signals have been released by various             not particular programming skills and which
research groups and labs. Some of them address                  provides advanced features with a friendly and easy
specific scientific issues such as LORETA [1] that,             to use graphical interface is missing.
according to the authors is “a particular 3D, discrete,
distributed, linear solution to the inverse EEG/MEG
problem”, Polyman [2], for the study of                         2 The NPXLab Suite
polysomnograms, and OpenVibe [3] which is a                     The NPXLab Suite [6] tries to fill this hole,
software platform dedicated to designing, testing               providing advanced methods for the investigation of
and using brain-computer interfaces. Other software             EEG/MEG signals such as ERP and spectral
platforms are more general like EEGLab [4], an                  analysis, Independent Component Analysis and
interactive Matlab toolbox for processing                       many others. Compared to the other general purpose
continuous and event-related EEG, MEG and other                 platforms it provides a very friendly graphical user
electrophysiological data, and Fieldtrip [5] another            interface, it does not depend on external tools such
MATLAB toolbox for MEG and EEG analysis.                        EEGLab and Fieldtrip [4, 5] (e.g. Matlab) even if,
There are several advantages in sharing tools and               like LORETA and Polyman, it just runs on
methods across different laboratories: no need to re-           Microsoft Windows platforms, whereas Matlab-
implement analysis tools, easier comparison of                  based programs run Windows, Linux and
results from different research groups, validation of           Macintosh, even if they require.
methods from a wide community of users just to                  The       NPXLab         Suite     (available      at
name few.                                                       http://www.brainterface.com), that exists since 2003
There are different approaches, however, on the                 [7], is formed by a collection of tools aimed at
modality these tools are implemented and shared,                analyzing signals in several different ways and has
depending mostly on the supposed end users, which               been successfully used in several scientific works
can be medical doctors, engineers, technicians,                 [8-12] and projects, such as [13]. It has been
psychologists, computer scientists and so on. There             downloaded from more than 100 countries at a rate
are then tools which are very versatile but require             of approximately 500 downloads per year.
some programming expertise and powerful                         The NPXLab Suite is a collection of tools and
computers such as EEGLab and Fieldtrip (Matlab)                 software modules - NPXLab is the first one to be
and others, like LORETA and Polyman which are                   released - developed to analyze EEG and MEG
distributed in classical binary form and immediately            signals, even if it can been used for EKG, EMG,
usable after having installed them thru typical setup           fNIRS and virtually any kind of sampled signal. It

    E-ISSN: 2224-2856                                     145                                     Volume 13, 2018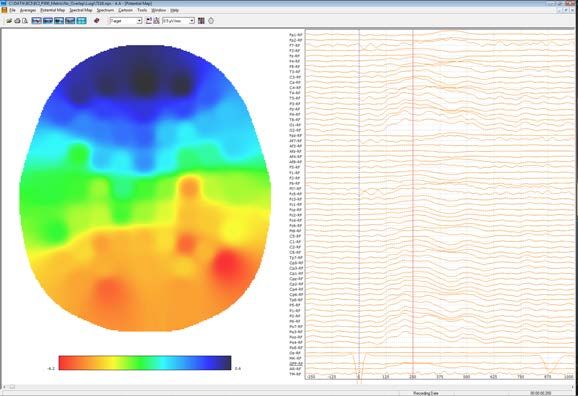
WSEAS TRANSACTIONS on SYSTEMS and CONTROL                                                         Luigi Bianchi

was implemented in C++ programming language for                2.2 The EEG Tool
efficiency reasons (more than 100K lines of code)              The EEG tool, initially created to analyze
and released for free for non-commercial use.                  Electroencephalographic signals, is able to process
More than 100 forms for setting processing and                 continuous signals of different nature in various
visualization options are available thus providing a           ways: time domain filters (including IIR, FIR,
very easy to use and intuitive graphical user                  recursive, zero-phase, etc..), spatial filters (such as
interface (GUI).                                               Laplacian, ICA, CSP, etc…) and spectral analysis
Its name originates from the NPX file format (Neuro            are easily accessible through an easy to use
Physiological signals in XML format) which was                 interface. It is not possible to describe all of them,
originally implemented for physiological data.                 so just few characteristics will be illustrated in the
The Suite, however, can properly handle also a                 following paragraphs.
dozen of widely used commercial file formats are               Actually it has been used to analyze also magneto-
supported but also EDF/EDF+ [14], CSV and                      encephalographic (MEG), electro-cardiographic
ASCII. The adoption of the XML file format (as                 (EKG), electro-myographic (EMG), accelerometric,
opposed to binary) as an infrastructure to the whole           kinematic and NISR (near infra-red spectroscopy)
suite is motivated by the fact that any sort of                signals.
information can be added to a file even manually
with a text editor without breaking the backward               2.2.1 Events
compatibility. This allows a painless growth of the            A very powerful feature is the ability to insert
suite: in the past, for example, weights from                  markers (instantaneous events such as triggers) and
Independent Component (ICA) and Common                         selections (events with a duration greater than zero,
Spatial Patterns (CSP) analysis tools were added to            such as the execution of a mental task or an epileptic
the NPX file format preserving the functionalities of          crisis) to identify portions of the data to be
all of the previously released tools. Binary files,            automatically processed.
instead, can suffer of backward compatibility issues           This can be done in three main ways:
if some additional information requires file format                 a) manually, by visual inspection and by
extension. As an example of this one can consider                      means of a couple of simple mouse point
the effort required to preserve compatibility between                  and click operations;
EDF and EDF+ files just to add the ability of storing               b) Automatically, for example by analyzing
events to EDFs.                                                        the signals in order to detect artifacts, or
In the next paragraphs, some aspects of the Suite                      when a certain threshold value is reached, or
will be described even if they do not cover all of its                 to find events similar to a template (e.g. a
functionalities.                                                       portion of a signal, such as an epileptic
                                                                       spike) across the whole recording. In this
                                                                       case the cross-correlation between the
2.1 The File Converter Tool                                            template and the whole signal is computed
To gain all the advantages of the NPXLab Suite one                     and events are inserted whenever a user
needs to process files in NPX format, otherwise                        settable correlation threshold value is
some processing cannot be stored in the original file                  reached;
(e.g. ICA or CSP spatial filters). For this reason, a               c) Automatically, by processing already
file conversion tool capable of transforming data                      existing events. In some cases, in fact, it can
files from different sources into NPX is provided.                     be useful to split, move or count them, or to
This program, then, allows reading signals stored in                   skip some of them. Moreover, it is possible
13 different file formats (EDF, EDF+, CSV, TXT,                        to apply boolean operations such as OR,
HDF5, Micromed, Brainamp, EBNeuro, Microsoft                           AND, NOT and XOR to identify, for
Waveform, GDF, BDF, etc…) and write them into 5                        example, when in a recording two events
different ones, including NPX, ASCII and the                           were active at the same time, or when a
popular EDF+. During the conversion, it is also                        trigger occurred while no artifacts were
possible to process files by means of either time                      occurring, and so on. The possibilities are
domain and or spatial domain filters, rename or                        virtually unlimited.
remove sensors (e.g. noisy channels), assign
coordinates and types to them in order to compute              None of the tools described in the introduction and
and visualize topographical maps.                              released by other laboratories or research centers
                                                               has the ability, flexibility, and easiness of NPXLab
                                                               in processing events. This is extremely important

    E-ISSN: 2224-2856                                    146                                      Volume 13, 2018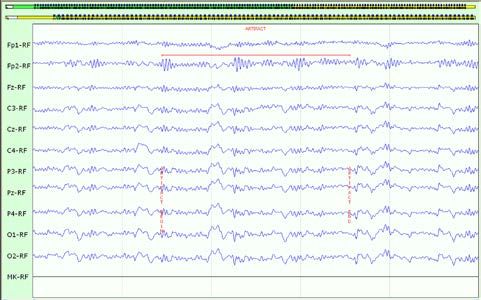
WSEAS TRANSACTIONS on SYSTEMS and CONTROL Luigi Bianchi
because this means that is very simple and fast to 2.3 ERP
select portions of the signals that have to be Event Related Potentials (ERPs) are a very common
processed, resulting in a great saving of time for the way to investigate brain function and represent the
operators. measured response to specific sensory, cognitive, or
motor stimuli. Because these responses (studies
2.2.1 Spectral analysis signals) are usually very low in voltage as compared
Spectral analysis benefits from advanced events to the EEG background activity (which in this case
managing because it oversimplify the selection of is considered noise), several stimuli are provided to
the epochs to be analyzed: one usually does not the patients/subjects and their responses are
want to process a whole recording, but just a portion averaged in order to increase the SNR.
of it. Then, the spectral analysis facility, was In NPXLab a relevant number of parameters can be
designed so that an operator can select which set to perform the averaging either automatically or
portion of the recordings should be included and manually. In the first case by selecting the
excluded from the analyses: it is sufficient to select segmentation criteria and artifact removal strategies
the events selections that include relevant epochs through a very complete set of options, whereas in
and those that for example define time intervals the last case by selecting one by one the stimuli
contaminated by artifacts. responses to be averaged. It is also possible to
As in any spectral analysis tool it is possible to combine the two methods, thus starting with an
select different windowing functions, resolution, automatic ERP computation and then reconsidering
overlap, etc… if a single trial has to be taken into account for the
An important feature is that it is possible to compute averaging or if it should be removed.
and keep in memory different computed spectra, Among the various ways to visualize the processed
that can be compared even statistically (t-test) to signals there are also topographic maps as shown in
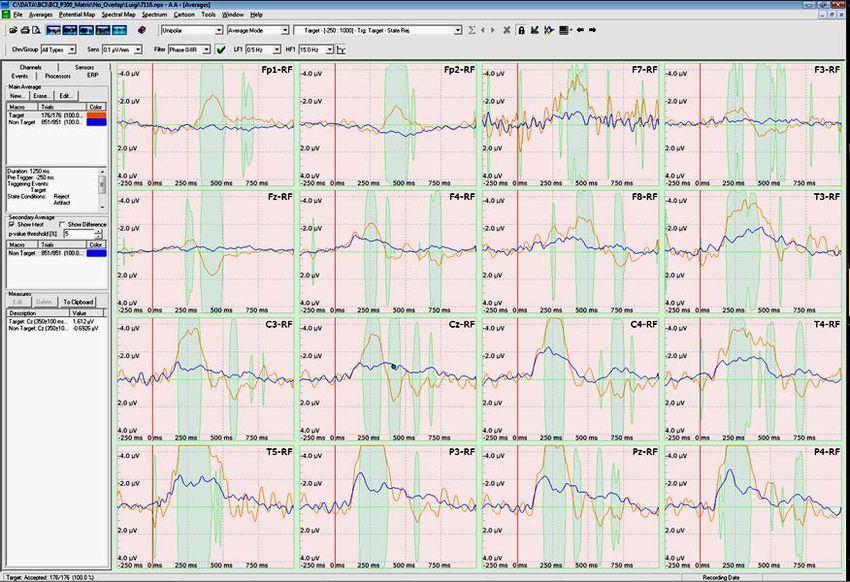
see, frequency by frequency, sensor by sensor, if Fig. 2].
they are statistically different, also after correction
for repeated measures (Bonferroni, etc..).
Fig. 2 – The Potential Map view of an ERP.
Fig. 1 - Spectra comparison relative to sensor C6 Similarly, to the EEG module it is also possible to
while performing two different mental tasks (green perform spectral analysis, to filter signals, to
and blue curves). The red line visible at around manage events, etc...
11.5Hz indicates that statistical difference is Some ERPs protocols are designed to compare
significant (p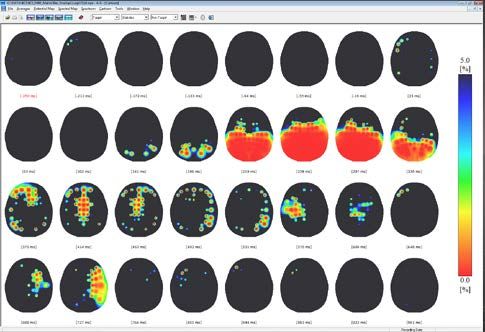
WSEAS TRANSACTIONS on SYSTEMS and CONTROL                                                          Luigi Bianchi

 Fig. 3 - Statistical comparison of two evoked responses to two classes of stimuli (blue and orange lines) in a
 P300 protocol. Each of the 16 plots represents a different electrode. The presence of green “bubbles”
 indicates that responses are statistically different (t-test, p < 0.05). The larger the bubbles, the lower the p-
 value.
In Fig. 3] time series relative to two different classes
of stimuli are shown and their statistical comparison
is represented by light green bubbles: if they are
present, the two responses are statistically different
(p
WSEAS TRANSACTIONS on SYSTEMS and CONTROL                                                        Luigi Bianchi

Fig. 5 - On the left and right panels, the same 5.5 seconds of the EEG recording before and after the removal of
the eye blink source are shown: it can be clearly seen that the component IC_1, the red one in the figure, is
strongly correlated with the eye blink artifacts. Then unselecting it (see the red ellipse in the right figure) will
result in an EEG trace with is free from that artifact. This operation produces instantaneous effect.

2.4 Independent Component Analysis                             components that are associated to noise, thus
Independent Component Analysis (ICA) is a                      improving the SNR ratio of the signals. An example
computational method for separating a multivariate             of this is shown in Errore. L'origine
signal into additive subcomponents. The basic idea             riferimento non è stata trovata. where a
behind it is that the signals that we record are               component (IC_1) attributed to eye blinks has been
generated from sources (the ICA components) that               removed from the EEG trace by simply clicking on
are mixed and summed up as defined by a mixing                 a checkbox.
matrix. ICA analysis allows to compute the mixing              ICA components, once computed, can be treated as
and - its inverse - the unmixing matrices. It is then          common channels, so that one can average them,
possible through these two matrices to compute the             compute their spectra, etc…
sources from the EEG signals or reconstruct the
EEG from the ICA sources. It is then possible to
compute the sources from the EEG, identify noise               2.5 Common Spatial Pattern
components and back-project the components in the              Common Spatial Pattern (CSP) is another method
EEG domain after having removed the noise: in this             for separating multivariate signal into additive
way it is possible to dramatically improve the signal          subcomponents which have maximum differences in
to noise ratio.                                                variance between two windows. It is another spatial
It is computed from a tool, derived from EEGLab,               filter that has been used in Brain-Computer
that, at the end of the processing, stores the weights         Interfaces, or to remove artifacts from EEG signals.
of the mixing into a NPX file.                                 In BCIs, it is used to compare signals acquired from
In this way, all of the other tools, including the EEG         a subject under different conditions, such as while
and ERP viewers, can use ICA either to select                  performing two different mental tasks. The CSP tool
physiological components or to remove those                    of the NPXLab Suite allows to compute and

    E-ISSN: 2224-2856                                    149                                     Volume 13, 2018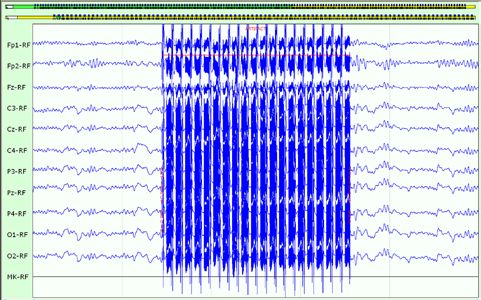
WSEAS TRANSACTIONS on SYSTEMS and CONTROL Luigi Bianchi
visualize CSP filters that can be used also in Brain- fundamental, but might not be an easy task to solve.
Computer Interfaces. Similarly to ICA weights, the For this reason, a method has been proposed [10]
weights from the computed matrices are stored into and implemented in one the NPXLab Suite tools to
an NPX File in order to be retrieved by all the tools automate this procedure. It is illustrated in Fig. 7].
of the NPXLab Suite.
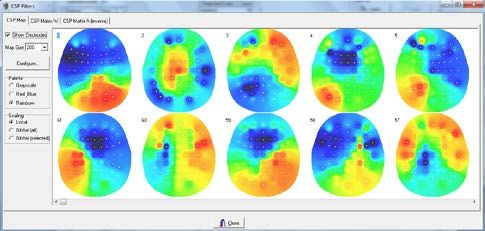
In Fig. 6] 10 out of 61 filters computed from a BCI
experiment (two different mental tasks) are
represented.
Fig. 6 – Ten filters computed from a BCI
experiment in which a subject had to perform two
different mental tasks.
2.5 Brain-Computer Interface
Machine learning methods as well as special
functions and tools are also provided to implement,
evaluate and optimize the performances of Brain-
Computer Interfaces (BCI). Seven different
classifiers (SWLDA, FLDA, BLDA, SVM, Fig. 7 – Effects of the method used to remove the
SRLDA, RLDA and Artificial Neural Networks), Pulse Sequence Artifact to an EEG file acquired into
can be used to either train or test ERP based BCIs a MRI scanner. On top 5 seconds of EEG signals
such, as P300 Spellers, mu-rhythms, Steady State acquired during a MRI scanning are shwn: it is
Evoked Potentials (SSxEP) and so on. These tools clearly visible the large artifact in the central part of
have been also used as standard platform in the the plot, lasting about 2.4 seconds, which
DECODER EU project, to support diagnoses in correspond on the time necessary to acquire a
non-responsive patients, in order to discriminate volume. On bottom the same data portion after the
between vegetative vs. minimally conscious patients application of the artifact removal method
[13]. Finally, statistical test to assess the confidence implemented in the NPXLab Suite.
of the results in also included in the NPXLab suite.
3 Discussion
2.6 EEG – fMRI artifact removal tool The NPXLab Suite is a set of free software tools
Another tool of the suite was designed to solve running on Microsoft Windows that have been
some typical problems that occur when implemented and released in more than one decade
simultaneously recording EEG and fMRI signals: in in and that will be supported and extended in the
this case, several sources of noise, the most famous future. It has been downloaded from more than 100
ones being, the Pulse Sequence Artifact (PSA) and countries worldwide at a rate of about 500
the Ballisto-Cardiographic Artifact (BCA) [10] are installations per year. Compared to other solution it
caused by the mutual interaction of the magnetic is the most complete among those that do not
and electric fields. The PSA can be up to three depend on external tools such as Matlab and that do
orders of magnitude larger than the EEG signals not need any particular programming skill. Being
whereas the BCA is generally larger than the EEG programmed in C++ its performances are also
electrical activity but does not exceeds one order of among the most efficient ones and it requires less
magnitude. Removing these sources of noise is computer resources in term of processing power and
E-ISSN: 2224-2856 150 Volume 13, 2018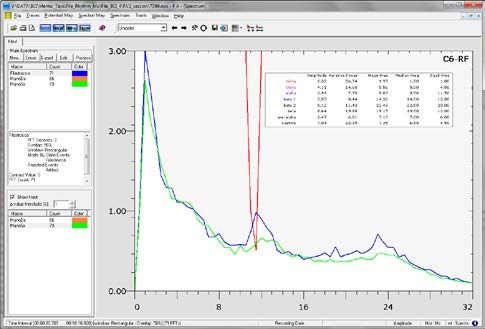
WSEAS TRANSACTIONS on SYSTEMS and CONTROL                                                        Luigi Bianchi

memory as compared to tools such as EEGLab                      21.          Software           available            at
which, however, is able to perform a wider set of               https://sccn.ucsd.edu/eeglab/index.php
analyses.
                                                                [5] Oostenveld, R., Fries, P., Maris, E., Schoffelen,
                                                                JM (2011) FieldTrip: Open Source Software for
4 Conclusion                                                    Advanced Analysis of MEG, EEG, and Invasive
The NPXLab represents a reliable and efficient                  Electrophysiological       Data.      Computational
solution for those who need to perform several                  Intelligence and Neuroscience Volume 2011 (2011),
analyses in the EEG/MEG research fields and that                Article ID 156869, doi:10.1155/2011/156869
do not want to depend or learn to use external tools.           Software                 available                 at
It has been successfully used in several scientific             http://www.fieldtriptoolbox.org/
publications [8-13] because of its versatility and
completeness. As it can read and write data from                [6] Bianchi L, Quitadamo LR, Abbafati M, Marciani
several different file formats it has also been used in         MG and Saggio G (2009). "Introducing NPXLab
some project which involved laboratories that                   2010: a tool for the analysis and optimization of
acquired signals with different devices, thus                   P300 based Brain-Computer Interfaces". In:
allowing a painless extension of the database.                  Proceeding of the 2nd International Symposium on
Several analyses, such as Spectral Analysis, Time               Applied      Sciences    in     Biomedical    and
and Spatial domain filtering, artifact removal, event           Communication Technologies. Bratislava, Slovak
related potentials, and many others can be                      Republic, November 24-27, 2009. Software
performed very easily with a very friendly user                 available at http://www.brainterface.com/
interface, thus representing a solid and free solution
for the analysis of data acquired in                            [7] Bianchi L, Babiloni F, Cincotti F, Arrivas M,
neurophysiological experiments, especially for those            Marciani MG. (2003). Developing wearable bio-
people that do not have programming skill or do not             feedback systems: a general-purpose platform. IEEE
need the rely on the power of external tools such as            Transactions on Neural Systems and Rehabilitation
Matlab or LabView.                                              Engineering. vol. 11, pp. 117-119 ISSN: 1534-4320.

                                                                [8] Quitadamo LR, Abbafati M, Cardarilli GC,
References:                                                     Mattia D, Cincotti F, Babiloni F, Bianchi L (2012).
                                                                Evaluation of the performances of different P300
[1] Pascual-Marqui, R. D., Michel, C. M. and                    based brain–computer interfaces by means of the
Lehmann,      D.      (1994)     Low     resolution             efficiency metric. Journal of Neuroscience Methods,
electromagnetic tomography: a new method for                    vol. 203, p. 361-368, ISSN: 0165-0270
localizing electrical activity in the brain. Int J
Psychophysiol,         18(1),       pp.      49-65              [9] Bianchi L., Sami S, Hillebrand A, Fawcett IP,
(http://www.uzh.ch/keyinst/loreta.htm).                         Quitadamo LR, Seri S (2010). "Which Physiological
                                                                Components are More Suitable for Visual ERP
[2]      Bob Kemp. “Polyman”. Software available                Based Brain-Computer Interface? A Preliminary
at https://physionet.org/pn4/sleep-edfx/Polyman.                MEG/EEG Study". Brain Topography, vol. 23; p.
                                                                180-185
[3] Y. Renard, F. Lotte, G. Gibert, M. Congedo, E.
Maby, V. Delannoy, O. Bertrand, A. Lécuyer,                     [10] Bianciardi M, Bianchi L., Garreffa G, Abbafati
“OpenViBE: An Open-Source Software Platform to                  M, Di Russo F, Marciani MG, Macaluso E. (2009).
Design, Test and Use Brain-Computer Interfaces in               Single-epoch analysis of interleaved evoked
Real and Virtual Environments”, Presence :                      potentials and fMRI responses during steady-state
teleoperators and virtual environments, vol. 19, no             visual stimulation. Clinical Neurophysiology. ISSN:
1,      2010.       Software       available      at            1388-2457.
http://openvibe.inria.fr/
                                                                [11] Bianchi L, Quitadamo LR, Marciani MG,
[4] A Delorme & S Makeig (2004) EEGLAB: an                      Maraviglia B, Abbafati M, Garreffa G. (2007). How
open source toolbox for analysis of single-trial EEG            the NPX data format handles EEG data acquired
dynamics. Journal of Neuroscience Methods 134:9-                simultaneously with fMRI. Magnetic Resonance
                                                                Imaging. vol. 25(6), pp. 1011-1014 ISSN: 0730-
                                                                725X.

    E-ISSN: 2224-2856                                     151                                     Volume 13, 2018
WSEAS TRANSACTIONS on SYSTEMS and CONTROL Luigi Bianchi
[12] Liguori C, Albanese M, Romigi A, Izzi F, Noirhomme Q.Cognitive Processing in Non-
Natoli S, Leonardis F, Leonardis C, Bianchi L, Communicative Patients: What Can Event-Related
Marciani MG, Placidi F (2013). Unexpected total Potentials Tell Us?. Front Hum Neurosci. 2016 Nov
recovery in a patient with post-anoxic complete 14;10:569.
alpha coma predicted by recording of cortical SEPs.
Clinical Neurophysiology, vol. 124, p. 2450-2453, [14] Bob Kemp, Alpo Värri, Agostinho C. Rosa,
ISSN: 1388-2457 Kim D. Nielsen and John Gade. "A simple format
for exchange of digitized polygraphic recordings".
[13] Lugo ZR, Quitadamo LR, Bianchi L, Pellas F, Electroencephalography and Clinical
Veser S, Lesenfants D, Real RG, Herbert C, Guger Neurophysiology, 82 (1992): 391-393.
C, Kotchoubey B, Mattia D, Kübler A, Laureys S,
E-ISSN: 2224-2856 152 Volume 13, 2018You can also read