The Open Sports Sciences Journal
←
→
Page content transcription
If your browser does not render page correctly, please read the page content below
Send Orders for Reprints to reprints@benthamscience.ae
                                      The Open Sports Sciences Journal, 2016, 9, (Suppl-1, M10) 81-93                                      81

                                  The Open Sports Sciences Journal

                                              Content list available at: www.benthamopen.com/TOSSJ/

                                                       DOI: 10.2174/1875399X01609010081

Are NBA Policies that Promote Long-Term Competitive Balance
Effective? What is the Price?
Julio del Corral1,*, Jorge García-Unanue2 and Fernando Herencia-Quintanar1
1
  University of Castilla-La Mancha, Facultad de Derecho y Ciencias Sociales, Ronda de Toledo s/n, 13071, Ciudad Re-
al (Ciudad Real), Spain
2
 University of Castilla-La Mancha, Grupo IGOID, Avda. Carlos III s/n, 45071, Toledo (Toledo), Spain

Received: March 19, 2015                                    Revised: June 1, 2015                               Accepted: September 07, 2015

Abstract: This paper examines competitive balance in the most prominent basketball league in the world: the NBA. Two types of
graphs are used. First, long-term competitive balance is studied based on actual positions achieved by the teams on the Regu-lar
Season. On the other hand, the competitive balance levels for each season are analyzed using sport betting odds data and through the
use of two alternative strategies. In the first approach, density functions for the number of victories for all teams within a season are
known, whereas in the second approach, a kernel density function of team winning probability is deter-mined for each season. Thus,
a prospective competitive balance analysis is conducted. The study period covers seasons 1993-94 and 2011-12. The results suggest
that long-term competitive balance levels are high, as many teams change their classifications. At season level, competitive balance
seems to improve along the period studied. However, there are still too many differences between the teams in the same season.

Keywords: Betting odds, competitive balance, graphical analysis, NBA, prospective competitive balance measures, sports league
policy.

INTRODUCTION
     Rottenberg [1], widely considered a seminal work of Sport Economics, examined the domain of Major Baseball
League clubs and introduced the “uncertainty of outcome hypothesis”. Later, Neale [2] observed that a world
heavyweight-boxing champion (Joe Louis) must challenge the strongest opponent as possible to maximize profits. In
this way the paradox Louis-Schemelling was established which arguments that in the professional sport industry, a
monopoly is an undesirable market structure, unlike in other markets, in which firms can increase profits when
competency is minimized. These studies thus introduced concepts of outcome uncertainty and competitive balance to
the Sport Economics field. In another groundbreaking Sports Economics article, Szymanski [3] distinguishes between
three types of uncertainty: uncertainty in a game, uncertainty in a season and uncertainty in a competition. Thus,
competitive balance is greater if the domain of large clubs is small, if the proximity of teams across seasons is high and
if the continuity of team performance is low.
    Competitive balance is a key issue of the financial sustainability in sports and it is influenced by the socio-economic
contexts of the regions or countries [4, 5]. In general, previous studies have shown that when all other factors remain
constant, a competition or league that exhibits a high degree of competitive balance will achieve greater interest from
fans [6 - 8]. In addition, Paul et al. [9] show that more significant differences in team winning records in National
Football League games decrease perceived fan satisfaction. In turn, major professional sport league organizations of
North America, including the National Hockey League (NHL), National Football League (NFL), Major League
Baseball (MLB), and the National Basketball Association (NBA), have implemented a series of regulations that are
intended to promote competitive balance [3].

* Address correspondence to this author at the University of Castilla-La Mancha, Facultad de Derecho y Ciencias Sociales, Ronda de Toledo s/n,
13071, Ciudad Real (Ciudad Real), Spain; Tel: +34 926295300; Ext: 3549; E-mail: Julio.corral@uclm.es

                                                      1875-399X/16       2016 Bentham Open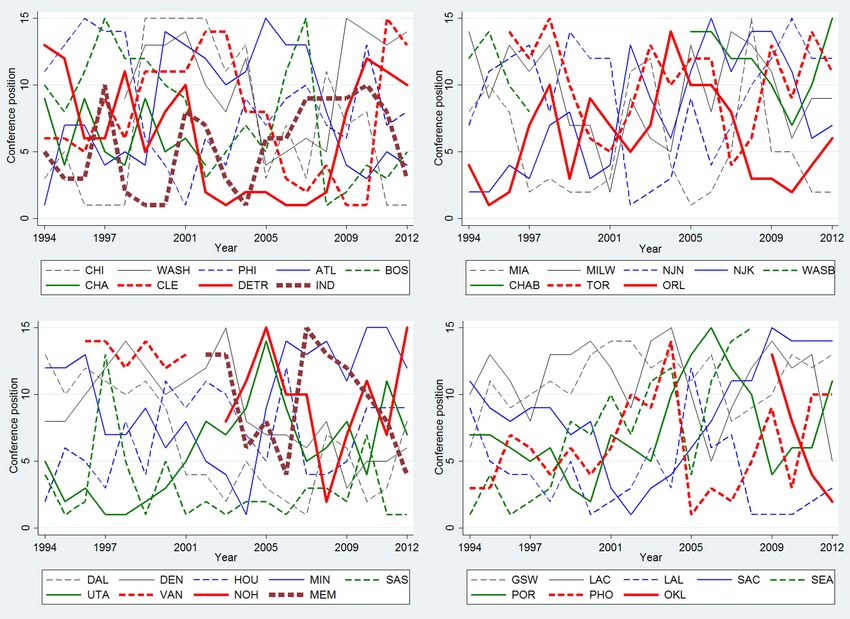
82 The Open Sports Sciences Journal, 2016, Volume 9                                                                                  del Corral et al.

Generally speaking, competitive balance levels are typically higher in these leagues than in other high impact league
such as European football leagues [10]. However, variations exist among major North American professional sport
leagues, and the NBA is often cited as the less competitive [11 - 14].
    Numerous studies have examined competitive balance levels in sports leagues. In this regard, standard
methodologies have employed measures of either dispersion or concentration (e.g., Hirschman-Herfindahl Index,
standard deviation of the winning percentage). These measures use final season result based on a retrospective
approach. By contrast, measures based on sports betting market data focus on fan expectations for each game and
season using a prospective approach [15 - 18].
    The NBA, like other North American sports leagues, employs rules such as draft, free agency or salary cap for to
improve competitive balance [19]. However, these rules mainly have long-term effects on competition by altering the
distribution of talent and by including new players between seasons. Therefore, in a single season, major differences
between teams may be evident, disabling changes in the short term. The aim of this paper is to analyze the extent to
which this is true in the NBA. In doing so, both long- and short-term competitive balance is studied in relation to
regular seasons of the 1993-1994 season to the 2011-2012 season. The long-term competitive analysis involves an
alternation of final team standings. Short-term competitive balance is examined using a prospective approach based on
sports betting market data, an emerging trend in the literature.
    The remainder of the paper is organized as follows. A theoretical framework on the structure of the NBA and its
relation to competitive balance is first presented. This is followed by a brief review of competitive balance
measurement methods. Methodologies and measures employed are then explained, and results and a discussion are
presented. The paper closes with study conclusions.

National Basketball Association (NBA)
    The NBA is the world’s most prominent basketball league, constituting one of the North American Major Leagues
together with the MLB, NFL and NHL. Formed in 1946, the league is structured based on a franchise system. It is thus
a closed league that differs from European leagues, which largely follow systems of promotion and relegation, and that
requires new teams to be approved by the Championship Commission. For this reason, the NBA has included and
excluded teams and has changed franchises (teams) between cities throughout its history. In the last season of the
present study period, the NBA was composed of 30 teams divided into two conferences (Eastern and Western) that were
each divided further into three divisions (Atlantic, Central and Southeast in the Eastern Conference; and Northwest,
Pacific and Southwest in the Western Conference). However, at the start of the study period, the league included only
27 teams. Teams play 82 games in a regular season: four games against teams of the same division, three or four games
(determined via lottery) against teams of other divisions in the same conference, and two games against teams of the
other conference. The eight teams that achieve the most victories in each conference participate in the playoffs and then
compete for the championship.
    The closed system, which is also employed by the other North American Major Leagues, facilitates the introduction
of rules to improve competitive balance under the assumption that ceteris paribus competitive balance increases league
attractiveness and thus profits. The NBA has introduced several rules that have been renegotiated over the years by
franchises, players and the Commission with the explicit aim to address issues of competitive balance [11]. The most
important of these rules are those of drafting, TV revenue sharing, salary capping and luxury taxing.
   On the one hand, the draft controls the introduction of new players to the NBA and distributes new players among
teams. This system allows the lowest-performing teams of the previous season to select better players. Teams that had
played in the playoffs choose the latter, and the rest of the teams enter into a lot to determine the order of picks, in
which the worst team has more chances to choose before the other teams. This system’s conduciveness to long-term
competitive balance has been demonstrated on several occasions1. For example, the San Antonio Spurs lost 64 games
during the 1996/1997 season, affording the team the first position in the next draft. After selecting Tim Duncan, the
team reached the playoffs in 1997/1998 and won the championship in 1998/1999. Similarly, the Cleveland Cavaliers,
achieving a winning percentage of 0.207 in 2002/2003, acquired LeBron James in the 2003 draft and achieved a
winning percentage of 0.427 in the same season. This percentage continued to improve to 0.805, granting the team

1
 Long-term competitive balance refers to an assumption that teams are likely to change their positioning in a league to prevent the league from being
dominated by a few teams.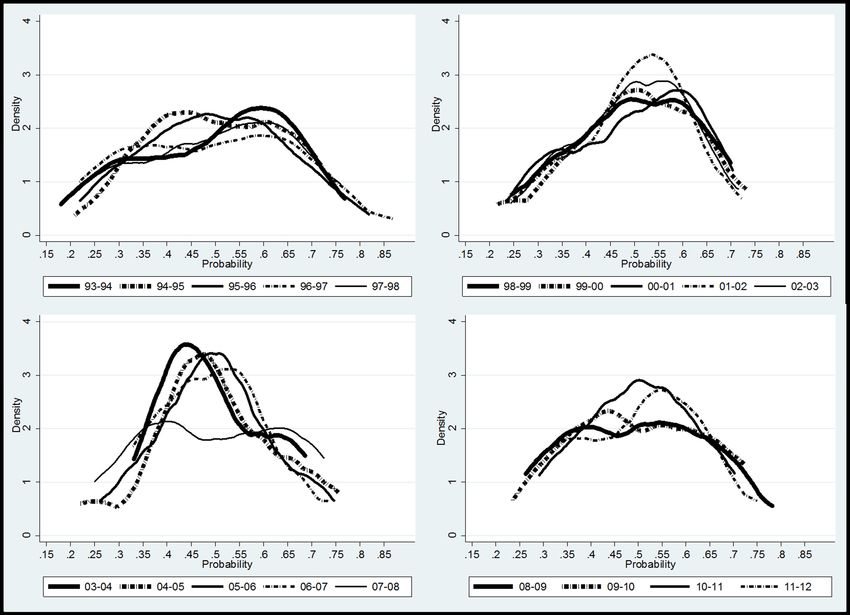
Competitive Balance in the NBA                                               The Open Sports Sciences Journal, 2016, Volume 9 83

access to the playoff final in 2008/2009. On the other hand, the NBA distributes TV income equally across all teams.
Under the contract signed in 2008, the NBA makes $ 930 million, granting each team $ 31 million.
    Finally, the NBA salary cap what the teams can spend to pay their players, which is updated each year. Under
luxury tax regulations, the NBA employs another threshold that is slightly higher than the salary cap. If one team
exceeds this threshold, it must pay a tax ($ 1 for each $ 1 that exceeds the threshold as of 2005). However, it is not yet
clear whether these two regulations significantly affect competitive balance levels in the NBA [20]. Nonetheless, the
NBA continues to update these rules to improve competitive balance [11]. These modifications often result in lockouts,
which are quite frequent in North American Major Leagues [11]. During negotiations the season lost some games.
During the present study period, for instance, teams played only 50 games during the 1998 lockout and 66 games during
the 2011 lockout.

Competitive Balance Measurement
    Competitive balance has been measured in numerous ways in the scientific literature. Such measures include the
standard deviation of the winning percentage adjusted to the standard deviation of perfect competitiveness [3, 10, 21,
22], the Herfindahl-Hirschman Index [23], the same index adjusted for perfect competitiveness regarding to the number
of teams [24 - 27], the Gini-coefficient [28] and the winning concentration ratio [29]. All of these methods use scores
obtained at the end of a season as a data source (i.e., retrospective data). Other methods utilize prospective data obtained
from the sports betting market. These measures are based on expectations and perceptions of what could happen during
each game or season. The first studies that employed sports betting data examined competitiveness levels in the English
Premier League matches [30, 31]. Following these studies, it is possible to find studies that employed sports betting
data to examine game result uncertainty and its relation to attendance [32 - 34]. Recent studies have subsequently
applied this kind of data at game level, using measures such as Theil Index [7]. This index is useful for testing the
outcome uncertainty of a single match, and it can be used to evaluate their influence on attendance [35, 36]. However,
to test the competitive balance at season level with sport betting odds data, it is necessary other kind of measures. In this
way, Paul et al. [15] presented the first research that use sports betting market data to examine league competitive
balance, plotted the average of favorite odds over several seasons to determine perceived competitive balance levels in
Major League Baseball. Bowman et al. [16, 17] also used sports betting market data to evaluate NFL, NBA and MLB
competitive balance levels and their evolution through several measures. Finally, del Corral [18] plotted the distribution
of the expected number of points from betting odds to examine competitive balance in major European soccer leagues.
    This approach assumes that betting odds serve as unbiased estimates of result probabilities. While some papers have
identified biases in betting odds [37, 38], this does not preclude their ability to calculate accurate probabilities because
while there is no consensus in the literature on whether betting odds are efficient, Forrest and Simmons [39] and Sauer
[40] state that at least weak efficiency appears to characterize this market. Hence, Buraimo et al. [41] recommend the
use of sports betting odds to study uncertainty outcomes over other measures. On the other hand, Bowman et al. [17]
explain that point spreads are the most unbiased predictors of individual game outcomes and that betting market
inefficiencies have been eliminated overtime as they were identified by the bettors. Therefore, Bowman et al. [17]
defend the utility of point spreads for examining the competitive balance of an entire league season.
    However, Kringstad and Gerrard [42] argue that the complexity of the leagues’ structures in team sports due to their
multiple prizes requires alternative competitive balance measures to conceptualize this problem. In this way. The
competitive balance measured by an individual indicator shows only a punctual information. Nevertheless, there are
other ways to work with betting odds data [18], favoring a more visual interpretation in which more information can be
drawn with a single analysis. These approaches could help the practitioners to analyze the competitive balance of each
season and the reasons that are behind. In addition, the description and use of new methods for measuring competitive
balance are important study areas for improving the research agenda.
    While the above listed approaches are used to study an individual game or season, competitive balance can be
evaluated over a long-term period as well. Long-term measures of competitive balance are less frequently applied and
are less varied. The most commonly used method involves measuring the number of teams that won the championship
in a determined period [10, 11]. It can also be found studies that use time series and structural breaks tests to analyze the
changes in the competitive balance in different sport leagues [4, 19, 43 - 46]. However, methods involving the HHI,
standard deviation of win percentages [10, 11, 26] and variation and evolution of positions for all teams in a regular
season for a determined period can be employed as well.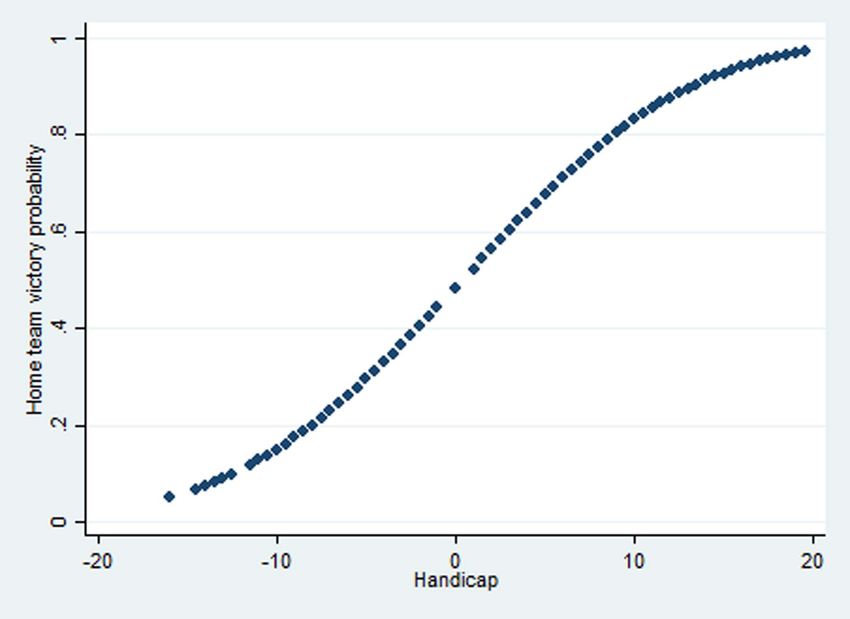
84 The Open Sports Sciences Journal, 2016, Volume 9                                                                                  del Corral et al.

NBA Competitive Balance
    The competitive balance of NBA has been studied in different range of dates and using different kind of
methodologies. Some papers are focused on match day level, with the aim to analyze the effect of competitive (im)
balance on attendance [47, 48]. On the other hand, some articles that analyze NBA competitive balance at season level
and in long-term argue that NBA is probably the North American Major Sport League with less competitive balance [11
- 14]. Berri et al. [49] explain that one of the major problems in the talent distribution in NBA is that the morphological
characteristics of the elite players are very rare. There are short supply of tall people in the population. For these reason,
some teams always have more talent, and the owners can do nothing to solve this constraint. Additionally, basketball
has a game system that fortifies this problem. The most players in NBA are not stars, and most of wins are produced by
a minority of NBA players, 20% of the players produced 70% of the wins [50]. This fact is an important feature,
because only one player could make more differences than in other sports.
    Moreover, there are some studies that demonstrate that factors such us salary caps or luxury taxes do not have
impact in competitive balance of NBA [19, 20, 27]. These findings could be related with other studies that find that the
European Basketball Leagues, which have much less strict rules, like ACB in Spain, have a competitive balance at
season level nearest to NBA [51, 52]. However, in general terms, the competitive balance of NBA can still be classified
as high [52]. Recent studies suggest that NBA improved their competitive balance in the past 20 years [17]. For these
reasons, it is important to add new research that show more information about the properties of NBA competitive
balance both short and long terms.

MATERIALS AND METHODS
    To determine competitive balance levels in the NBA, we examine seasonal and long-term competitive balance
trends. In both cases, competitive balance was evaluated from 1993/1994 to 2011/2012 (i.e., 19 seasons). The
competitive balance season by season was measured using a prospective approach and sports betting odds, based on a
visual interpretation. More specifically, point spreads of NBA games were used. In spread betting, the bookmaker
ascribes an advantage to the underdog (handicap) and a disadvantage to the favorite (supremacy), resulting in an
implied probability of 50% for both sides of the wager. As only two possible outcomes are possible in the NBA (home
and away victory), game betting odds of 1.90 are applied to both teams to ensure an over round of bookmakers. For
example, Oklahoma City Thunder’s supremacy over the Sacramento Kings after the last game of the 2011-2012 regular
season held in Oklahoma was valued at 10. This implies that for this game, Oklahoma City Thunder was the clear
favorite.
   The database comes from the webpage www.covers.com and it was facilitated as a datasheet by a professional
bookie, Leigh Herdman. It includes game results, dates, local teams, away teams and supremacy data from
approximately 25,000 observations. The data that this webpage provide are the closing consensus line obtained from the
most common line offered across a selection of bookmakers2. With point spread data, embedded winning probabilities
cannot be obtained directly as using money lines3 but they can be estimated by using probit models. Particularly, one
probit model was estimated for each season in which the dependent variable valued at 1 if the local team wins and with
supremacy serving as the independent variable.
   Probit model results are shown in (Table 1). As predicted, supremacy achieves positive and significant coefficient,
implying that supremacy increases home victory probability. Once these probits are estimated, models can predict the
probability of a home team win. Fig. (1) shows the relation between supremacy and the predicted probability of a home
team win.
   Using home and away victory probabilities for all games, two prospective measures of competitive balance were
employed. The method developed in del Corral [18], which focused on European soccer, was applied first. Del Corral
[18] calculated the probability of three possible soccer match outcomes (i.e., home victory, tie, away victory) through
money lines, with the objective to evaluate their competitive balance with a prospective approach. In a soccer game, the
winner obtains three points and the loser wins no points, and if a game finishes in tie, both teams obtain one point.
Assuming that match results are independent of one another so that the joint probability of two events is equal to the

2
    It is important to note that some recent studies that analyze NBA competitive balance, use data from this source [17, 47, 48].

3
    In [16] is explained a method to convert money which lies in embed-ded probabilities.
Competitive Balance in the NBA The Open Sports Sciences Journal, 2016, Volume 9 85
product of the two probabilities, the probability of each team obtaining a certain number of points in the final standings
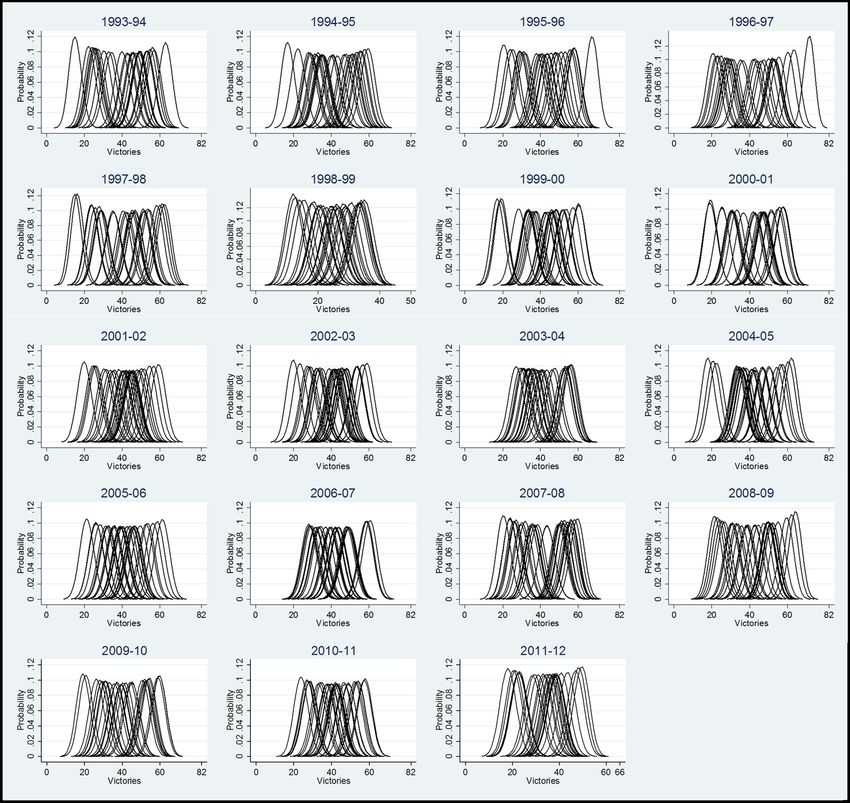
was calculated. Hence, it was in turn possible to formulate a single chart with all team score probabilities, thus revealing
the competitive balance level of each season. Higher concentrations of lines in the chart correlate with higher levels of
competitive balance in a season. Using this method, a chart listing probabilities of achieving different numbers of
victories for all teams at the end of a regular season was created to determine competitive balance levels in the NBA
from 1993/1994 to 2011/2012. Secondly, a kernel chart with probabilities of victory averages for each season was also
created. With this chart, it can be compared results of the previous measure with the distribution of average team victory
probability. This approach overcomes shortcomings of the density function approach in that closeness between teams is
not affected by the number of matches played. These figures present a straightforward result: higher kernel dispersion
correlates with lower competitive balance. It is important to note that, to our knowledge, this approach has never been
employed in the literature.
Table 1. Probit estimates of home victory 1993-2012.
Season 93-94 94-95 95-96 96-97 97-98 98-99 99-00 00-01 01-02 02-03
Constant -0.08 -0.07 -0.04 -0.13 -0.04 0.05 -0.03 -0.08 -0.05 0.03
Supremacy 0.10 0.09 0.10 0.11 0.10 0.09 0.10 0.10 0.09 0.09
Pseudo R2 0.17 0.13 0.16 0.21 0.19 0.12 0.14 0.13 0.10 0.11
Number of observations 1,184 1,180 1,257 1,261 1,260 791 1,264 1,260 1,260 1,277
Season 03-04 04-05 05-06 06-07 07-08 08-09 09-10 10-11 11-12
Constant 0.00 -0.06 -0.03 -0.06 0.00 -0.06 -0.06 0.09 -0.06
Supremacy 0.09 0.10 0.10 0.09 0.10 0.11 0.10 0.08 0.10
Pseudo R2 0.10 0.14 0.11 0.09 0.16 0.16 0.14 0.11 0.13
Number of observations 1,271 1,314 1,319 1,331 1,316 1,315 1,312 1,311 1,074
Note: all coefficients are significant at the 99% level.
Fig. (1). Relation between supremacy and the probability of a home team win for the 1995-1996 season.
However, strong seasonal competitive balance can occur in the presence of poor long-term competitive balance.
Alternatively, poor seasonal competitive can occur in the present of strong long-term competitive balance if positions86 The Open Sports Sciences Journal, 2016, Volume 9 del Corral et al.
achieved by teams vary considerably across seasons. In illustrating long-term competitive balance in the NBA, final
rankings for each team in a regular season were plotted along a temporal line based on a moving average for three
seasons.
Finally, we have also calculated additional measures to complement the previous ones, with the aim of improving
the consistency of the interpretations. On the one hand, the Herfindahl-Hirschman Index (HHI) and the standard
deviation of winning percentage were implemented [5], but using the expected number of victories [12]. On the other
hand, we calculated the average position change with respect to the next season in the NBA and BBVA League. In
addition, we also included the average position change for the top 4 with respect to 3 seasons apart.
RESULTS AND DISCUSSION
The results on long-term competitive balance are shown in Fig. (2), wherein charts show the evolution of final
standings for the teams in a regular season based on three-year moving averages. More pronounced fluctuations in team
rankings throughout a season are associated with better long-term competitive balance.
Fig. (2). Long-term competitive balance graphs.
Note: CHI- Chicago Bulls, WASH- Washington Wizzards, PHI-Philadelphia 76ers, ATL- Atlanta Hawks, BOS- Boston Celtics,
CHA- Charlotte Hornets, CLE- Cleveland Cavaliers, DETR- Detroit Pistons, IND- Indiana Pacers, MIA- Miami Heat, MILW-
Milwaukee Bucks, NJN- New Jersey Nets, NJK- New York Kincks, CHAB- Charlotte Bobcats, TOR- Toronto Raptors, ORL-
Orlando Magic, DAL- Dallas Mavericks, DEN- Denver Nuggets, HOU-Houston Rockets, MIN- Minnesota Timberwolves, SAS- San
Antonio Spurs, UTA- Utah Jazz, VAN- Vancouover Grizzlies, NOH- New Orleans Hornets, MEM- Memphis Grizzlies, GSW-
Golden State Warriors, LAC- Los Ángeles Clippers, LAL- Los Ángeles Lakers, SAC- Sacramento Kings, SEA- Seattle Supersonics,
POR- Portland Trail Blazers, PHO- Phoenix Suns, OKL- Oklahoma City Thunder.
The charts show lines that are mixed together with very random evolutions. This difficulty in clearly identifying the
lines is a result itself. In this way, it is evident that, in both conferences, teams fluctuate in rank frequently. For instance,
all teams occupied the non-playoff and playoff zones (eighth place). There are clearly example cases for the studyCompetitive Balance in the NBA The Open Sports Sciences Journal, 2016, Volume 9 87
period. Boston Celtics finished the regular season as the worst team of its conference in 2006/2007 season. The next
season finished as the team with more victories in the conference and won the championship. On the other hand,
Chicago Bulls finished on the first position in its conference and won the championship three consecutive seasons
(1995/1996 season to 1997/1998 season). However, the next four season finished the last one in its conference. In
2004/2005 season, the team returned to qualify for playoffs. Moreover, no team has always finished in one of the top
five positions in a respective conference. This is not the case for Spanish football and basketball leagues, as Real
Madrid and FC Barcelona have occupied in the highest rankings. Long-term competitive balance is thus quite high, as
teams are likely to fluctuate in rank. Rather, there are no good or bad teams, but teams that exhibit good or bad
performance. Hence, some policies implemented in the NBA have been effective in terms of maintaining long-term
competitive balance.
Table 2 allows us to confirm this assumption. We can see that the average position change varies similarly in NBA
Conference and in BBVA League (we must take into account that BBVA conference has 20 possible positions and
NBA Conferences only has 15). However, if we check the average position change 3 seasons apart of the top 4, NBA
varies more than BBVA League.
Table 2. Average position change in NBA and BBVA League.
Season NBA NBA top4 (3 Seasons apart) NBA Conference BBVA BBVA top4 (3 Seasons apart)
1993-1994 5.04 3.00 2.44 2.47 4.50
1994-1995 4.26 5.75 2.26 5.21 4.50
1995-1996 4.90 12.00 2.55 4.26 4.75
1996-1997 5.45 12.50 2.55 3.82 5.50
1997-1998 6.83 11.50 3.38 3.59 6.00
1998-1999 4.90 7.00 2.55 4.19 4.75
1999-2000 4.14 5.50 2.21 3.88 2.67
2000-2001 6.32 6.25 3.14 3.53 3.50
2001-2002 4.21 6.50 2.14 4.00 4.25
2002-2003 5.59 7.50 2.90 4.00 7.00
2003-2004 8.34 12.50 4.34 3.71 4.00
2004-2005 5.62 10.00 3.07 4.00 3.25
2005-2006 5.80 8.50 3.07 3.53 3.25
2006-2007 5.76 8.00 2.97 4.18 0.50
2007-2008 5.66 7.50 3.14 2.65 1.75
2008-2009 4.87 11.25 3.00 3.29 2.25
2009-2010 6.07 9.00 3.13 4.18 0.75
2010-2011 4.47 3.25 2.50 4.59 4.00
Average 5.46 8.19 2.85 3.84 3.73
The theory of competitive balance determines that talent (players) must be shared among different teams. This
principle is more difficult to follow in basketball, as only ten players (5 vs. 5) play at a given time, and the addition of
one outstanding player can significantly change the sport productivity of a team [50]. However, it has been shown that
long-term competitive balance appears quite high, as regulations maintain the distribution of talent as much as possible,
facilitating the addition of prominent players to the lowest performing teams. However, it is also interesting to
determine whether these policies are also effective in the short term. This would imply that teams exhibit similar
strengths in a given season, which may be more important to fans.
In order to analyze the short-term competitive balance levels, the following graph presents competitive balance
results generated through density functions obtained from point spread data converted to probabilities Fig. (3). In turn,
seasonal competitive balance levels can be interpreted. High dispersion among the curves denotes low competitive
balance. This would mean a league with predefined positions where the surprise is very difficult to occur in the final
standing of the Regular Season. In cases of high competitive balance, teams differ only marginally, rendering it difficult
predict final competition classifications for a regular season. Moreover, as a team’s likelihood of reaching first place is
not reflective of the full spectrum of team goals, probabilities of reaching the playoffs must also be examined [42]. For
this reason, although this method is not interpreted directly quantitatively, as happens with other methods, it allows not
only to extract more information but also to explain more in depth the characteristics that differentiated each season.
The charts provide another point of view throughout a visual interpretation that could improve and complement the88 The Open Sports Sciences Journal, 2016, Volume 9 del Corral et al.
traditional methods in future researches. In addition, these methods could provide more information to practitioners and
managers. They are interested, not only in a punctual competitive balance data, but also in information about the dispute
of playoffs, identification of clearly favorites and underdog teams, or teams that have been underestimated or
overestimate. But, still, several measures of competitive balance can be calculated the expected number of victories
instead the actual number of victories [16, 17]. Bowman et al. [17] argue that the expected wins not only have the
advantage of capturing fan perception but are the best measure of the real underlying quality differences between teams
without the noise of how the season is actually unfolding.
Fig. (3). Short-term competitive balance graphs: Number of victory densities.
The following charts allow one to examine competitive balance attending to these properties.
It is evident that the league is characterized by several seasons of low competitive balance. For instance, for the
1993/1994 season, one team is set apart in both sections of the chart. The 1994/1995 season reveals two distanced teams
as well, but only along the left hand section of the chart. In addition to this, in both seasons there was a high dispersion
of the functions, with a lot of teams being given no opportunity to rank in the first positions. This result is consistent for
the entire study period, which represents a problem in the outcome of the application of rules such as salary caps, which
would have a positive effect in the competitive balance at season level. In this way, previous studies have not providedCompetitive Balance in the NBA The Open Sports Sciences Journal, 2016, Volume 9 89
evidence of the influence of salary caps on NBA competitive balance [20, 27].
Similar trends are observable for other major leagues that do not employ regulations as stringent as those of the
North American Major Leagues, such as European soccer leagues. As with NBA teams, some teams cannot reach the
highest positions and other teams differ considerably in rank from the majority in the BBVA League (Spain), Premier
League (England) and Bundesliga (Germany), as demonstrated by del Corral [18], who used a similar methodology as
that employed in this study based on betting odds.
Coming back to the season by season analysis results show a favorite team for the 1995/1996 and 1996/1997
seasons, with considerable difference in probabilities of achieving first place. The 1998/1999 season coincides with the
first lockout period. This season exhibits good competitive balance in relation to other seasons. However, we cannot
make objective comparisons between this season and the other seasons, as other factors must be considered and teams
played 16 fewer games [11].
The 1999/2000 to 2002/2003 season period exhibits slightly better competitive balance than the earliest seasons
analyzed. Fort and Lee [19] determined that in relation to other periods of North American professional sport league
labor dispute, competitive balance increased following the 1998 NBA lockout. However, our results suggest that several
teams were afforded no apparent opportunity to enter playoff positions, reflecting poor competitive balance.
Nonetheless, the 2003/2004 season exhibits the highest degree of competitive balance for the analyzed period.
A decline in competitive balance has occurred since the 2004/2005 season respect with the previous one. Density
functions show more distanced teams along both sides of the chart, revealing the presence of favorite and underdog
teams. This season corresponds with one of the most important changes realized in the NBA competition system, which
may have contributed to the dispersion of the teams in the next seasons. The NBA divided each conference for two
divisions into three divisions, and teams of the same division began to play four times in each division. Therefore,
divisions with strong teams can have a negative effect on competitive balance via the introduction of new teams, as in
the case of the introduction of the Charlotte Hornets. Hence, changing the structure, and the incorporation of new teams,
alters patterns of competitive balance. Fort and Lee [19], who also studied the breakpoints in the competitive balance of
North American Sport Leagues, confirmed greater correspondence due to expansions and team relocations than with the
rule changes.
However, the end of the period shows grater competitive balance than in the start. Bowman et al. [17], who analyze
competitive balance of NBA with six measured developed from betting odds, show an improvement in the same period.
This comparison indicates that the results obtained by density functions allow to extract similar interpretations than the
obtained ones with other indicators. However, they also allow to extract other kind of information at the same time. In
addition, Table 3 contains the results of the HHI and standard deviation of winning percentage, and the same conclusion
can be recovered. The competitive balance is better at the end of the analyzed period. Nonetheless, big differences
between teams can be still distinguished.
Table 3. Competitive balance measures using expected victories.
Season HHI SD
1993-1994 0.040 12.8
1994-1995 0.040 11.4
1995-1996 0.037 12.3
1996-1997 0.038 14.1
1997-1998 0.038 13.5
1998-1999 0.037 6.6
1999-2000 0.037 11.4
2000-2001 0.037 11.2
2001-2002 0.036 9.7
2002-2003 0.036 10.0
2003-2004 0.036 8.8
2004-2005 0.036 10.9
2005-2006 0.035 9.7
2006-2007 0.035 9.1
2007-2008 0.036 12.0
2008-2009 0.036 12.290 The Open Sports Sciences Journal, 2016, Volume 9 del Corral et al.
(Table ) contd.....
Season HHI SD
2009-2010 0.036 11.6
2010-2011 0.035 9.7
2011-2012 0.036 8.9
In further illustrating short-term competitive balance analysis results, Fig. (4) presents kernel densities of average
victory probabilities for all teams and for each season. The results reinforce previous findings. The 2003/2004 season
shows the highest degree of short-term competitive balance, with a kernel function mode close to 0.5 and with limited
dispersion. On the other hand, the 1996/1997, 2007/2008 and 2008/2009 seasons exhibit the lowest levels of
competitive balance.
Fig. (4). Short-term competitive balance graphs: Winning probability kernels.
CONCLUSION
This paper has studied long- and short-term competitive balance in the NBA. Graphs produced on long-term
competitive balance showed a high level of competitive balance in the Regular Season. This result is reinforced by the
fact that 17 different teams have reached the NBA finals over the 19 seasons analyzed. It can thus be concluded that
long-term competitive balance in the NBA is high and that policies designed to achieve this objective have been
effective. However, the results reveal poor competitive balance in the short-term (i.e., season to season). That is, NBA
fans are afforded long-term competitive balance at the expense of short-term competitive balance. This raises questions
regarding whether NBA fans prefer long- or short-term competitive balance. This research question merits further
exploration, because if fans value short-term competitive balance, the NBA Commissioner must adapt NBA policies in
order to get not only long term competitive balance but also short term competitive balance.
From a methodological point of view, this paper presents a promising approach to competitive balance measurement
that utilizes betting odds data. We are confident that future studies will be quick to adopt this novel approach.Competitive Balance in the NBA The Open Sports Sciences Journal, 2016, Volume 9 91
CONFLICT OF INTEREST
The authors confirm that this article content has no conflict of interest.
ACKNOWLEDGEMENTS
This paper is a revised version of the undergraduate thesis of Fernando Herencia-Quintanar. The authors would like
to express their gratitude to Verónica Baos León for her language revision. The authors also acknowledge the
Consejería de Educación, Cultura y Deportes de la Junta de Comunidades de Castilla-La Mancha and Fondo Europeo
de Desarrollo Regional (Project PPII-2014-004-A) for the financial support of the article.
REFERENCES
[1] Rottenberg S. The baseball players’ labor market. J Polit Econ 1956; 64(3): 242-58.
[http://dx.doi.org/10.1086/257790]
[2] Neale W. The peculiar economics of professional sports: A contribution to the theory of the firm in sporting competition and in market
competition. Quaterly J Econ 1964; 78(1): 1-14.
[http://dx.doi.org/10.2307/1880543]
[3] Szymanski S. The economic design of sporting contest. J Econ Lit 2003; 41(4): 1137-87.
[http://dx.doi.org/10.1257/jel.41.4.1137]
[4] Mourão PR, Cima C. Studying the Golden Generations’ effects and the changes in the competitive balance of the Portuguese Soccer League.
Int J Sport Finance 2015; 10: 42-61.
[5] Mourão PR, Teixeira JS. Gini playing soccer. Appl Econ 2015; 47(49): 5229-46.
[http://dx.doi.org/10.1080/00036846.2015.1044650]
[6] Nalbantis G, Pawlowski T, Coates D. The fans’ perception of competitive balance and its impact on willingness-to-pay for a single game. J
Sports Econ 2015;
[http://dx.doi.org/10.1177/1527002515588137]
[7] Pawlowski T. Testing the uncertainty of outcome hypothesis in European professional football: A stated preference approach. J Sports Econ
2013; 14(4): 341-67.
[http://dx.doi.org/10.1177/1527002513496011]
[8] Pawlowski T, Nalbantis G. Competition format, championship uncertainty and stadium attendance in European football – a small league
perspective. Appl Econ 2015; 47(38): 4128-39.
[http://dx.doi.org/10.1080/00036846.2015.1023949]
[9] Paul RJ, Wachsman Y, Weinbach AP. The role of uncertainty of outcome and scoring in the determination of fan satisfaction in the NFL. J
Sports Econ 2011; 12: 213-21.
[http://dx.doi.org/10.1177/1527002510376789]
[10] Zimbalist A. Competitive balance in sports leagues-an introduction. J Sports Econ 2002; 3(2): 111-21.
[http://dx.doi.org/10.1177/152700250200300201]
[11] Berri DJ. Did the players give money to make the NBA better? Exploring the 2011 Collective Bargaining Agreement in the National
Basketball Association. Int J Sport Finance 2012; 7: 158-75.
[12] Berri DJ, Schmidt MB, Brook SL. Stars at the gate: The impact of star power on NBA gate revenues. J Sports Econ 2004; 5(1): 33-50.
[http://dx.doi.org/10.1177/1527002503254051]
[13] Leeds M, Von Allmen P. The Economics of Sports. 5th ed. New Jersey: Prentice Hall 2014.
[14] Rockerbie DW. Exploring inter-league parity in North America: The NBA anomaly. J Sports Econ 2014; 514529795
[http://dx.doi.org/10.1177/1527002514529795]
[15] Paul R, Weinbach A, Borghesi R, Wilson M. Using betting market odds to measure the uncertainty of outcome in Major League Baseball. Int
J Sport Finance 2009; 4(4): 255-63.
[16] Bowman RA, Ashman T, Lambrinos J. Prospective measures of competitive balance: Application to money lines in major league baseball.
Appl Econ 2013; 45(29): 4071-81.
[http://dx.doi.org/10.1080/00036846.2012.750421]
[17] Bowman R, Lambrinos L, Ashman T. Competitive balance in the eyes of the sports fan: Prospective measures using point spreads in the NFL
and NBA. J Sports Econ 2013; 14(5): 498-520.
[http://dx.doi.org/10.1177/1527002511430230]
[18] del Corral J. A picture is worth a thousand words: Analysing competitive balance in European football leagues from 2007-2013. 4th Gijón
Conference on Sport Economics Neale Golden Anniversary. Gijón (Spain). 2014.
[19] Fort R, Lee YH. Structural change, competitive balance, and the rest of the major leagues. Econ Inq 2007; 45(3): 519-32.
[http://dx.doi.org/10.1111/j.1465-7295.2007.00026.x]92 The Open Sports Sciences Journal, 2016, Volume 9 del Corral et al.
[20] Schmidt MB, Berri DJ. On the evolution of competitive balace in professional sports. Econ Inq 2003; 41(4): 692-704.
[http://dx.doi.org/10.1093/ei/cbg037]
[21] Humphreys B. Alternative measures of competitive balance in sports leagues. J Sports Econ 2002; 3(2): 133-48.
[http://dx.doi.org/10.1177/152700250200300203]
[22] Vrooman J. The baseball players’ labor market reconsidered. South Econ J 1996; 63(2): 339-60.
[http://dx.doi.org/10.2307/1061172]
[23] Addesa F. Competitive balance in the Italian Basketball Championship. Riv di Dirit ed Econ dello Sport 2011; 7(1): 25-107.
[24] Depken C. Free-agency and the competitiveness of Major League Baseball. Rev Ind Organ 1999; 14(3): 205-17.
[http://dx.doi.org/10.1023/A:1007788303098]
[25] Larsen A, Fenn AJ, Spenner EL. The impact of free agency and the salary cap on competitive balance in the National Football League. J
Sports Econ 2006; 7: 374-90.
[http://dx.doi.org/10.1177/1527002505279345]
[26] Owen PD, Ryan M, Weatherston CR. Measuring competitive balance in professional team sports using the Herfindahl-Hirschman Index. Rev
Ind Organ 2007; 31: 289-302.
[http://dx.doi.org/10.1007/s11151-008-9157-0]
[27] Totty ES, Owens MF. Salary caps and competitive balance in professional sports leagues. J Econ Educ 2011; 11(2): 46-56.
[28] Schmidt MB. Competition in Major League Baseball: The impact of expansion. Appl Econ 2001; 8: 21-6.
[http://dx.doi.org/10.1080/135048501750041231]
[29] Naghshbandi S, Yousefi B, Etemad Z, Moradi M. The comparison of competitive balance in Football Premier Leagues of England, Germany,
Spain, France, Italy and Iran: A case study from 2009-2010 Season. J Human Sport Exerc 2011; 6(4): 673-81.
[http://dx.doi.org/10.4100/jhse.2011.64.10]
[30] Peel D, Thomas D. Outcome uncertainty and the demand for football: An analysis of match attendance in the English football league. Scott J
Polit Econ 1988; 35: 242-9.
[http://dx.doi.org/10.1111/j.1467-9485.1988.tb01049.x]
[31] Peel DA, Thomas DA. The demand for football: Some evidence on outcome uncertainty. Empir Econ 1992; 17: 323-31.
[http://dx.doi.org/10.1007/BF01206291]
[32] Forrest D, Simmons R. Outcome uncertainty and attendance demand in sport: The case of English soccer. Statistician 2002; 51(2): 229-41.
[http://dx.doi.org/10.1111/1467-9884.00314]
[33] Forrest D, Beaumont J, Goddard J, Simmons R. Home advantage and the debate about competitive balance in professional sports leagues. J
Sport Sci 2005; 23(4): 45-439.
[http://dx.doi.org/10.1080/02640410400021641]
[34] Knowles G, Sherony K, Haupert M. The demand of major league baseball: A test of the uncertainty of outcome hypothesis. Am Econ 1992;
36: 72-80.
[35] Buraimo B, Simmons R. Do sports fans really value uncertainty of outcome? Evidence from the English Premier League. Int J Sport Finance
2008; 3: 146-55.
[36] Pawlowski T, Anders C. Stadium attendance in German professional football–The (un) importance of uncertainty of outcome reconsidered.
Appl Econ Lett 2012; 19(16): 1553-6.
[http://dx.doi.org/10.1080/13504851.2011.639725]
[37] Flepp R, Nuesch S, Franck E. Does bettor sentiment affect bookmaker pricing? J Sports Econ 2014; 521427
[http://dx.doi.org/10.1177/1527002514521427]
[38] Levitt S. Why are gambling markets organised so differently from financial markets? Econ J 2004; 114: 223-46.
[http://dx.doi.org/10.1111/j.1468-0297.2004.00207.x]
[39] Forrest D, Simmons R. Sentiment in the betting market on Spanish football. Appl Econ 2008; 40(1): 119-26.
[http://dx.doi.org/10.1080/00036840701522895]
[40] Sauer R. The economics of wagering markets. J Econ Lit 1998; 36: 2021-64.
[41] Buraimo B, Forrest D, Simmons R. Outcome uncertainty measures: How closely do they predict a close game? In: Albert J, Koning R, Eds.
Statistical thinking in sports. Boca Raton, FL: Champman and Hall 2006; pp. 167-78.
[42] Kringstad M, Gerrard B. Beyond competitive balance. In: Parent MM, Slack T, Eds. International Perspectives on the Management of Sport.
Burlington, MA: Butterworth-Heinemann 2007; pp. 149-72.
[http://dx.doi.org/10.1016/B978-0-7506-8237-4.50014-5]
[43] Fort R, Lee YH. Stationarity and Major League Baseball attendance analysis. J Sports Econ 2006; 7(4): 408-15.
[http://dx.doi.org/10.1177/1527002505276717]
[44] Lee YH, Fort R. Structural Change in Baseball’s competitive balance: The great depression, team location, and racial integration. Econ Inq
2005; 43: 158-69.
[http://dx.doi.org/10.1093/ei/cbi011]Competitive Balance in the NBA The Open Sports Sciences Journal, 2016, Volume 9 93
[45] Lee YH, Fort R. Competitive balance: time series lessons from the English Premier League. Scott J Polit Econ 2012; 59(3): 266-82.
[http://dx.doi.org/10.1111/j.1467-9485.2012.00580.x]
[46] Mills B, Fort R. League-level attendance and outcome uncertainty in U.S. Pro Sports Leagues. Econ Inq 2014; 52(1): 205-18.
[http://dx.doi.org/10.1111/ecin.12037]
[47] Jane W-J. The effect of star quality on attendance demand: The case of the National Basketball Association. J Sports Econ 2014.
[http://dx.doi.org/10.1177/1527002514530405]
[48] Jane W-J. The relationship between outcome incertainties and match attendance: New evidence in the National Basketball Association. Rev
Ind Organ 2014; 45(2): 177-200.
[http://dx.doi.org/10.1007/s11151-014-9436-x]
[49] Berri DJ, Brook SL, Fenn AJ, Frick B, Vicente-Mayoral R. The short supply of tall people: Explaining competitive imbalance in the National
Basketball Association. J Econ Issues 2005; 39(4): 1029-41.
[http://dx.doi.org/10.1080/00213624.2005.11506865]
[50] Berri DJ, Schmidt MB. Stumbling on wins: Two economists explore the pitfalls on the road to victory in professional sports. Princeton, NJ:
Financial Time Press 2010.
[51] García-Unanue J, Godoy A, Villarrubia L, Sánchez-Sánchez J, Gallardo L. Balance competitivo en las ligas europeas de baloncesto y la NBA.
Cultura Ciencia y Deporte 2014; 9: 235-42.
[52] De Saá Guerra Y, Martín González JM, Sarmiento Montesdeoca S, Rodríguez Ruiz A, García Rodríguez JM, García-Manso JM. A model for
competitiveness level analysis in sports competitions: Application to basketball. Physica A 2012; 391: 2997-3004.
[http://dx.doi.org/10.1016/j.physa.2012.01.014]
© del Corral et al.; Licensee Bentham Open.
This is an open access article licensed under the terms of the Creative Commons Attribution-Non-Commercial 4.0 International Public License
(CC BY-NC 4.0) (https://creativecommons.org/licenses/by-nc/4.0/legalcode), which permits unrestricted, non-commercial use, distribution and
reproduction in any medium, provided the work is properly cited.You can also read