The Rent Guidelines Board Regarding Rent Increase Guidelines for 2022-2023
←
→
Page content transcription
If your browser does not render page correctly, please read the page content below

The Real Estate Board of New York to
The Rent Guidelines Board Regarding Rent
Increase Guidelines for 2022-2023
April 26, 2022

The Real Estate Board of New York (REBNY) is the City’s leading real estate trade association
representing commercial, residential, and institutional property owners, builders, managers,
investors, brokers, salespeople, and other organizations and individuals active in New York City real
estate. REBNY strongly supports policies that expand the local economy, grow, and improve the
City’s housing stock, and create greater opportunities for all New Yorkers. Thank you for the
opportunity to provide our perspective regarding rent adjustments for the city’s rent-regulated
apartments.

Each year, the Rent Guidelines Board (RGB) is responsible for evaluating the extent to which rents
should be increased for apartments under its jurisdiction. In order to make accurate decisions, it is
critical that the RGB have timely access to correct information about the cost pressures facing
owners and tenants alike, as well as the overall economy.

Unfortunately, the RGB continues to rely on a methodology that utilizes inconsistent data from
different time frames based on outdated assumptions. Most notable is the fact that the RGB utilizes
information for the income and expense reports based on a limited set of two-year old data that fails
to include buildings with fewer than 11 units. These challenges mean that the RGB is making
decisions without the benefit of full and complete information at a time when rapidly rising inflation
is placing immediate and significant economic pressure on owners.

In this context, it is particularly important to note that since the passage of the Housing Stability and
Tenant Protection Act (HSTPA) in 2019, the annual rent increases established by the RGB are the
only meaningful avenue by which owners can increase rents for a regulated unit. These rent
adjustments are needed so that owners can keep up with costs and keep their buildings in a state of
good repair. Indeed, since the passage of this law and following multiple years of rent freezes and
nominal increases far below owner expenses, the Furman Center has documented that the quality of
the building stock has already been adversely impacted, with a significant drop in alteration filings
and the associated improvements to units and buildings.

Given the importance of the board’s decision, and to help the RGB make such decision based on
more timely data, REBNY, RSA, CHIP and SPONY commissioned a study led by HR&A Advisors to
study more current revenue and expense data and change over the last three years. This study

Real Estate Board of New York   |   rebny.com                                                           1
utilized owner-provided TC201 tax forms from 2019, 2020 and 2021 to examine increases to owner
expenses on a longitude basis to best make a prospective call on whether costs are going up or not,
and whether income is going down or not. Conducted over three weeks, the study includes data for
2021 that was submitted to the City in March of 2021, and, while not definitive, points toward ways
in which the RGB approach could be updated in the future.

The findings of the HR&A study underscore the existence of a widening and worrisome divergence
between income from residential units and the expenses confronting rent stabilized property
owners. For example, income decreased 20% since 2019, while expenses on rent stabilized property
owners increased a total of 7%, with the highest individual increase coming from insurance, which
has risen 44% since 2019. Additional findings of note include a tax burden of 25% of revenue, with
an overall net increase from 2019-2021, and that smaller, fully stabilized buildings carry higher costs
per unit.

The core challenge to the board is that up till today, they have been presented with information
from different time periods, which impedes the ability to make a rational, prospective guideline
based on where costs will be going. It is our intention in this testimony to share meaningful
information on the current situation property owners are facing and identify a replicable path by
which the RGB can improve its methodology and make decisions based on pertinent, timely data
moving forward. Today, that decision can and must consider the regulatory changes from HSTPA,
inflation, and the continued upward trend, which this study confirms, of increased costs of operating
rent stabilized housing. It is our hope that the board will consider this information and issue a final
vote for guidelines that fall within the recommended commensurate rates of 4.5 to 9%. This is the
bare minimum to keep NOI constant at the current level, and this is the only path to avoid adversely
impacting the quality and financial stability of the rent stabilized housing stock.

HR&A Study

Members of SPONY, RSA, CHIP and REBNY collectively submitted 800 TC201 tax forms utilizing
data from 2019, 2020 and 2021 for 273 buildings of all sizes, including 14 properties with less than
11 units (but more than 6). In total, the forms cover 25,600 units. 179 buildings comprised of
10,000 units are from 1946 and earlier, and 94 buildings comprised of 15,600 units are from 1947
and later.

The RGB studies currently do not include any smaller properties of less than 11 units. This is
unfortunate because those buildings tend to be older and more likely to be fully stabilized.
Fortunately, replicating the owner study by the board will be easier next year as a wider universe of
TC201 data will be available from DOF beginning in July 2022. As a result, next year RGB could start
including this universe of smaller buildings in its data analysis. An important benefit of using this
data is that it ensures that the rent stabilized housing stock is more fully represented.

The data obtained by HR&A on behalf of the organizations generally reached the same conclusions
as RGB’s reported data on key metrics including income, rent, expenses and overall decreases in
NOI. This years’ Income and Expense Study found that from 2019-2020, NOI fell 7.8% in buildings

Real Estate Board of New York   |   rebny.com                                                        2
containing rent stabilized units, for the fourth time in the last 30 years. Decreases in NOI were found
in 70% of New York City neighborhoods, including those that did not lose significant population
during the pandemic. These decreases were born mostly by pre-war buildings, which saw a dramatic
decrease in NOI of 9.8%. According to HR&A’s study, NOI continued to go down in 2021, which
would represent a fifth decrease.

However, there were key exceptions between the datasets. First, the TC201 data shows buildings
pay a higher share of taxes with higher costs to smaller buildings overall when compared with the
RGB Income and Expense Study. Second, many of the categories showed significant increases from
2020 to 2021, with taxes, maintenance and fuel costs rising again in 2021 after a dip in 2020. This is
an important trend for the board’s considerations.

On taxes, the TC201s show taxes amount to 25% of income, versus 20% as reported by the RGB.
Additionally, what our sample shows is that in absolute terms, smaller buildings have higher per unit
costs in each category the RGB tracks. This is most pronounced for tax burden as well. The
discrepancy between what our sample of property owners reported in property tax payments and
what has been reported by the RGB is attributable to two distinctions in methodology. First, the
majority of property owners who file TC201 forms are filing them in order to dispute their property
tax bills, indicating that some may be paying amounts in excess of what is actually due.

The second reason points to a key difference in methodology between the HR&A and the RGB’s
reports. The RGB Income and Expense Study average tax payment data includes properties that
participate in the 421-a tax abatement program, and therefore do not pay full property taxes, while
HR&A’s sample of property owners does not include properties that do not pay property taxes. For
this reason, RGB’s average estimates are likely to skew much lower than what is paid by owners
outside of the 421a program. Another reason for this discrepancy could be that HR&A’s dataset
over-represents medium and large buildings in Manhattan and Queens, which would tend to have
higher labor costs given the requirements under the building code for staff requirements based on
building size, than smaller buildings in Brooklyn and Queens, which is most likely why labor and
miscellaneous expenses are higher in HR&A’s dataset.

Changes in building maintenance, labor and miscellaneous expenses are also erroneously minimized
due to the lag in the data previously presented to the board. While the 2022 Income and Expense
Study found that there was a 9.8% decline in owners maintenance expenditure from 2019-2020, by
utilizing TC201 data, the study shows there was actually a net increase in costs of 6% from 2019-
2021. Additionally, while staff presented an estimate of a 1.7% decrease in fuel costs for next year,
the TC201 data clearly shows a trend of increasing fuel costs of 16% since 2019. Given the
predictions of the UN Climate Report and NYC Climate panel, which clearly refute the idea of
“normal weather” and with the TC201 data trend, we implore the board to reconfigure their
assumptions when calculating these estimates to understand fuel costs will continue to increase, not
decrease.

The study clearly shows there is an undercounting of the tax burden for many owners. It also
demonstrates the higher expenditures overall of smaller, fully stabilized buildings, a key subset of the
stabilized stock. These findings are coupled with the abolishment of other income streams due to

Real Estate Board of New York   |   rebny.com                                                         3
the passage of HSTPA in 2019 and volatility with inflation. It is clear that rent increases at minimum
must remain within the recommended commensurate rates of 4.5 to 9%, and not below, and the
board should give itself the broadest flexibility between the preliminary vote and final, as new
inflation numbers will be issued during that timeframe. This is the bare minimum to keep NOI
constant at the current level, and this is the only path to avoid adversely impacting the quality and
financial stability of the rent stabilized housing stock.

Conclusion

There are current challenges with the information typically presented to the board. But these can be
addressed. First, the assumptions used to adjust pricing down and inflate NOI up should be
discarded. As the HR&A study was able to show, an overreliance on larger buildings and/or post war
buildings can skew costs in many ways, most problematically with the tax burden as 421a buildings
pay reduced taxes. There is a path forward to include smaller buildings which are older and tend to
be fully stabilized. We would therefore encourage the Rent Guidelines Board to include these
buildings and adjust their underlying assumptions regarding expenses. They should not be artificially
adjusted downward.

Directly related to diminishing NOI is the 2022 Income and Expense Study finding that the number
of financially distressed properties containing rent stabilized units has increased each year for the
past four years, now to 6.5% of all buildings containing rent stabilized units. It is also important to
note that NOI does not include the cost of debt nor does the board’s considerations include debt
service. Lenders look for a building to meet two principal metrics – debt yield, which is NOI divided
by the loan amount, to exceed 7.5%. This is tethered to interest rates and will be adversely impacted
in the coming years. Additionally, loans won’t be made if debt service coverage is not met, or if NOI
is not at minimum 1.25x the loan payment. For those buildings with existing loans, significant drops
in NOI means distress. For those buildings without loans, drops in NOI mean a decreasing ability to
access loans for capital improvements.

Therefore, the increases to the number of distressed properties is not slight. In fact, this pattern is
representative of a larger problem with the financial health of buildings containing rent stabilized
units, that if not addressed, will diminish the amount of housing available to New Yorkers during an
ongoing housing crisis. As part of the REBNY submission in 2019, an analysis on the potential
impacts from the HSTPA changes was shared, which showed that the HSTPA changes could
dramatically change the economic viability of the operations and maintenance for apartment
buildings across the city. This analysis estimated that within five years, approximately 272,000 units
could be financially distressed and unable to afford any investment beyond basic maintenance,
taxes, and utilities. As inflation, expenses and mortgage rates continue to rise while this Board
remains the only outlet for owners to increase rents to pay for these costs, more buildings will
experience distress if this board does not take action.

To keep buildings in good physical condition for the people who live in them, this Board must take
full responsibility for their role in keeping stabilized housing financially and physically viable,
especially given a now three-year old regulatory framework under HSTPA. Decreasing NOI and

Real Estate Board of New York   |   rebny.com                                                         4
increasing distressed buildings are clear trend lines the board must address. Inflation must be
addressed. These facts, independently, but especially compounded, clearly exhibit why property
owners must have the ability to increase rents.

We hope this additional information on the current situation property owners are facing will allow
the board to make a rational decision based on criteria from the same timeframes, that is current and
timely. Year after year, the RGB has asked our organizations to provide the data we have identified
as missing from staff reports, so we are pleased to present this study to you today. This study
generally shows inflation, regulatory changes from HSTPA, and the troubling trends of distressed
buildings and decreasing NOI continued to challenge the health of the stabilized stock into 2021.
Based on three years’ worth of data, we believe these challenges will continue into 2022 and 2023.

Again, it is our hope that the board will consider this information and issue a final vote for guidelines
that fall within the recommended commensurate rates of 4.5 to 9%. This is the bare minimum to
keep NOI constant at the current level, and this is the only path to avoid adversely impacting the
quality and financial stability of the rent stabilized housing stock.

Thank you for considering our testimony.

Real Estate Board of New York   |   rebny.com                                                           5
Presentation Title | HR&A Advisors
NYC Housing Operating Expenses Analysis
Initial Findings
April 2022

                                                1
NYC Housing Operating Expenses Analysis
METHODOLOGY
We collected and processed the most recent building income and
expense schedules from over 800 New York City Tax Commission
forms.
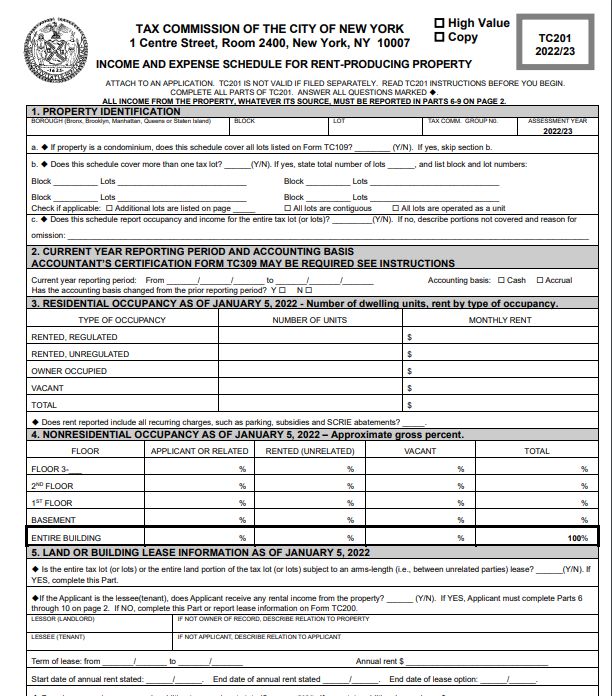
Owners of rental property are required to file a TC201 form, or “Income and Expense
TC201 Schedule for Rent Producing Properties” to the NYC Tax Commission when contesting
tentative assessed property values. Unlike the Real Property Income and Expense (RPIE)
Statements required by the Department of Finance which are largely self-reported,
Form TC201 requires certification and financial audit by an independent certified public
accountant. By collecting TC201 forms from a cross-section of NYC building typologies,
we are able to more faithfully portray metrics related to the income and expenses of
New York City’s rent regulated housing stock with the most recent data possible, looking
beyond the one-year lag in RPIE data available to the Rent Guidelines Board.
The TC201 form requires:
• The number of regulated and unregulated units and monthly rent collected from
each;
• Information on income from rental units, office, retail, and other revenue generating
operations; and
• Information on expenditures by expense category (e.g. fuel, labor, insurance, taxes,
NYC Tax Commission
etc.)
2NYC Housing Operating Expenses Analysis
METHODOLOGY
TC201 forms were processed, enriched with public data, and then analyzed and
compared to data from the Rent Guidelines Board.
DATA G AT H E R I N G DATA E N R I C H M E N T ANALYSIS COMPARISON
• 2019 – 2021 TC201 forms • Building information was • The enriched dataset was • Our dataset was then
were solicited from building enriched with data from the then queried to calculate the compared to the most
owners. city’s PLUTO dataset, adding average per-unit income and recent Income and Expense
additional information on expenses by category across study from the Rent
• Digital forms were scraped
building age and location. building size, geography, Guidelines Board in order to
to convert reported data
• Buildings were then and age. identify significant variances
into tabular format for
categorized into typologies and areas for further
processing; hand-written or • Due to the potential for
based on the number of research.
scanned forms were misattribution of
units, geography (aligned
manually processed and maintenance expenses as • Having three years of data
with Rent Guidelines Board
inserted into our database. labor expenses (and vise- also allows us to compare
categorizations), and versa) – Labor, Maintenance, the most recent reporting
• TC201 sample is self- building age. and Misc. expenses were year (2021) with pre-COVID
selecting, largely
grouped into one category. trends to understand
representing owners
changes.
appealing assessments.
Forms are generally not filed
for smaller buildings.
3NYC Housing Operating Expenses Analysis
DATA COLLECTION
Dataset over-represented in medium and large buildings in Manhattan and Queens; continued
under-representation amongst small buildings and those in the Bronx and Brooklyn. TC-201
dataset generally contains buildings with higher share of stabilized units.
Buildings in Sample
1946 and Earlier 1947 to Current Bronx Brooklyn Manhattan Queens
100 12 (2,120 Units) 39 (11,200 Units) Buildings Units) Units) Units) Units)
Total 179 (10,000 Units) 94 (15,600 Units)
Buildings by % of Stabilized Units
TC-201 Sample Actual
>95% 31% 34%
75%-95% 29% 20%REVENUE
5
Presentation Title | HR&A AdvisorsNYC Housing Operating Expenses Analysis
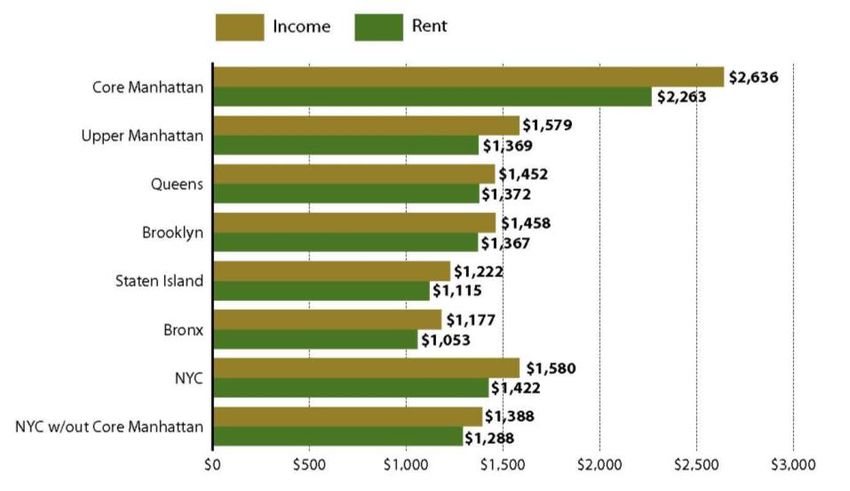
AVERAGE MONTHLY COLLECTED INCOME AND RENT PER UNIT BY BOROUGH (2020)
Dataset generally tracks RGB data; higher values in our dataset could be because of the over-
representation of medium and large buildings, esp. in Manhattan
Income Rent
$3,126
Core Manhattan $2,710
$1,876
Upper Manhattan $1,425
$1,615
Queens $1,516
$1,851
Brooklyn $1,702
$1,458
Bronx $1,408
$2,584
NYC $1,889
$1,700 From RGB report
NYC w/o Core MN $1,513
$0 $500 $1,000 $1,500 $2,000 $2,500 $3,000 $3,500
6NYC Housing Operating Expenses Analysis
CHANGE IN MONTHLY INCOME PER UNIT BY CATEGORY (2019-21)
Decrease in gross income driven by decrease in all income categories; rent in unregulated units fell
more steeply than in regulated units (22% vs 12% from 2020-21)
%Δ %Δ
2019 2020 2021
(‘19-20) (‘20-21)
$4,000 $3,734 Residential $2,059 $1,852 $1,655 -10% -11%
Other
$120 $95 $93 -21% -2%
$3,500 (combined)
Retail $285 $188 $180 -34% -4%
$2,836 $2,848 Gross $3,734 $2,836 $2,848 -24% 0%
$3,000 -24%
vs. 2019
BREAKDOWN OF RESIDENTIAL
$2,500 REGULATED AND UNREGULATED
$2,059
$2,000 $1,852 $2,746
$1,655 $3,000 $2,632
-20% $2,056
$1,500 vs. 2019 $1,879 $1,813
$2,000 $1,595
$1,000
-37% $1,000
$500 $285 $188 $180 vs. 2019
$120 -23% $0
$0 $95 $93 vs. 2019
2019 2020 2021
2019 2020 2021
Residential Other (combined) Retail Gross Residential regulated Residential unregulated
7NYC Housing Operating Expenses Analysis
BUILDINGS BY AGE AND NUMBER OF UNITS
In general, 1946 and earlier buildings have fewer units than 1947 to current.
100%
90%
80%
70%
60%
50%
40%
30%
20%
10%
0%
1946 and Earlier 1947 and Current
100
8NYC Housing Operating Expenses Analysis
CHANGE IN GROSS MONTHLY INCOME PER UNIT BY BUILDING AGE (2019-21)
Gross monthly income continued to decline in 2021 in buildings built in 1946 and older; small
increase in buildings built since 1947.
$4,500
$4,006
$4,000
$3,500 $3,345
$2,995
$3,000 $2,835 $2,881
$2,555
$2,500
$2,000
$1,500
$1,000
$500
$0
2019 2020 2021
1946 and Earlier 1947 to Current
9EXPENSES
Presentation Title | HR&A Advisors
10NYC Housing Operating Expenses Analysis
CHANGE IN MONTHLY EXPENSES PER UNIT (2019-21)
Taxes, maintenance, and fuel costs rose in 2021 after a dip in 2020. Insurance costs continued to
rise.
Compared to 2019
$1,800
7% overall
$1,600 44%
16%
$1,400
16%
$1,200
$1,000
6%
$800
$600
$400
9%
$200
$0
2019 2020 2021
Taxes Labor, Maint., Misc. Utilities Fuel Insur.
11NYC Housing Operating Expenses Analysis
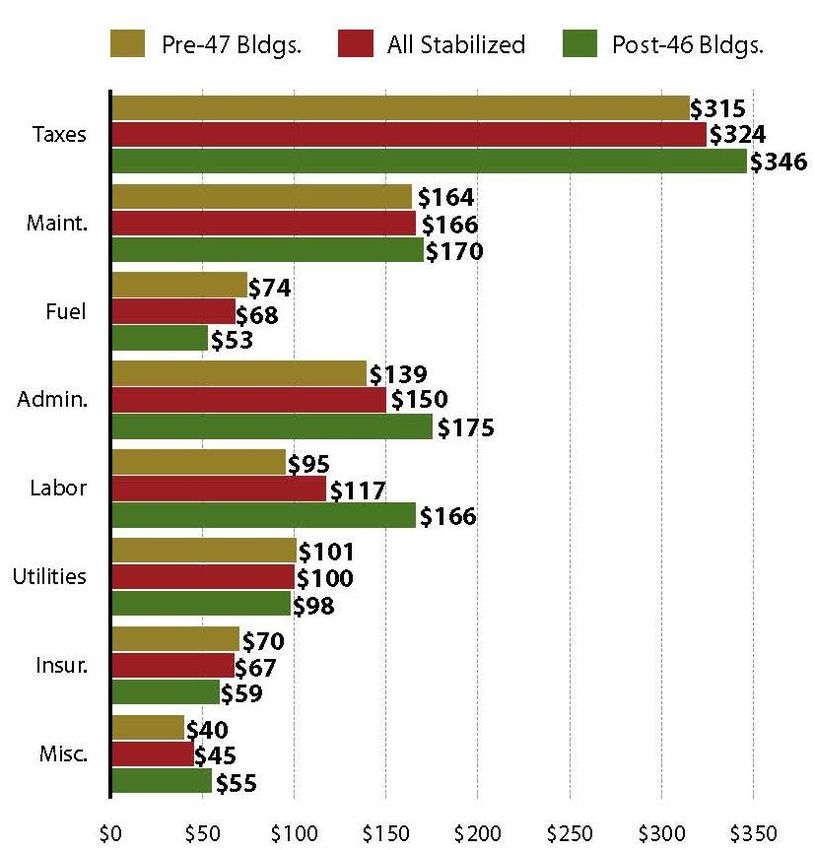
AVERAGE MONTHLY EXPENSE PER UNIT (2020)
Dataset generally tracks RGB data; Taxes are higher overall, particularly in 1946 and earlier
buildings.
1946 and Earlier All stabilized 1947 to Current
$610
Taxes $523
$369
$61
Fuel $54
$41
$70
Water/Sewer $66
$58
$25
Light & Power $25
$25
$172
Admin $164
$150
$67
Insurance $64
$59
$400
Labor, Misc, Maint $430
$483
$1,405 From RGB report
Total $1,325
$1,184
- $200 $400 $600 $800 $1,000 $1,200 $1,400 $1,600
12NYC Housing Operating Expenses Analysis
EXPENSES AS SHARE OF INCOME – CITYWIDE; ALL STABILIZED (2020)
When expressed as a share of income, expenses track more closely to RGB data; the largest
difference is in taxes which the TC-201’s show comprise 25% of income compared to 20% in the
RGB study.
70%
60%
50%
40%
30%
20%
10%
0%
Taxes Fuel Water/Sewer Light & Power Admin Insurance Labor, Misc, Total
Maint
TC-201 RGB I&E
13SMALL BUILDINGS
Presentation Title | HR&A Advisors
14NYC Housing Operating Expenses Analysis SMALL BUILDINGS (
NYC Housing Operating Expenses Analysis
SMALL BUILDINGS (
Presentation Title | HR&A Advisors
NYC Housing Operating Expenses Analysis
Initial findings
April 2022

                                                17
You can also read