THE STAKES OF NUCLEAR PLANNING OPTIMIZATION IN ELECTRIC SYSTEMS OPERATION WITH RENEWABLE ENERGY
←
→
Page content transcription
If your browser does not render page correctly, please read the page content below
THE STAKES OF NUCLEAR PLANNING OPTIMIZATION IN ELECTRIC
 SYSTEMS OPERATION WITH RENEWABLE ENERGY

 LYNCH Arthur, Institute for Techno-Economics of Energy Systems (I-tésé), French Alternative Energies and
 Atomic Energy Commission (CEA), Université Paris Saclay , +33 625715768, arthur.lynch@cea.fr
 PEREZ Yannick, Laboratoire de Génie Industriel CentraleSupélec, Université Paris-Saclay, +33 631618728,
 yannick.perez@centralesupelec.fr
 GABRIEL Sophie, Institute for Techno-Economics of Energy Systems (I-tésé), French Alternative Energies and
 Atomic Energy Commission (CEA), sophie.gabriel@cea.fr
MATHONNIERE Gilles, Institute for Techno-Economics of Energy Systems (I-tésé), French Alternative Energies
 and Atomic Energy Commission (CEA), gilles.mathonniere@cea.fr

 ABSTRACT :

 The recent development of variable renewable technologies in electric systems calls for
prospective work regarding, among others, the future optimal capacity mix as well as its related carbon
footprint, security of supply, and overall costs. In the context of diminishing and fickle residual electric
demand, each generating technology’s operational flexibility will partly determine whether they shall
participate in future decarbonized electric systems, and nuclear technology is no exception. Hence,
assessing the available nuclear flexibility is crucial to evaluating nuclear power’s economic and
technical interactions and the newly-built renewables capacities. This paper identifies the underlying
physical mechanisms that frame this technology’s flexibility and operations and focuses its analysis on
nuclear planning optimization, a structural characteristic of nuclear fleets. We develop a method to
simulate this optimization to reflect how plants managers maximize their plants’ availability during
peak-demand periods. We compare two simulation hypotheses, one where the fleet’s planning is
optimized and another where the fleet’s availability is considered constant, a standard practice in the
energy systems modeling literature. The paper conducts a sensitivity analysis highlighting the links
between the fleet’s planning optimization, the relative share of nuclear and renewables in the capacity
mix, and the simulation models’ results. We find that modeling the nuclear fleet’s optimization is of
greater importance as the relative share of nuclear in the capacity mix is high. The planning’s importance
holds as renewables’ installed capacities heighten, as the residual demand level decreases with higher
volatility. Ultimately, this paper aims to highlight the potential benefits of modeling the fleet’s planning
optimization in simplified low-carbon electric systems with a significant share of renewable energy.

Keywords:
Nuclear energy; Flexible operations; Nuclear planning; Renewable energy integration; Unit
commitment; Economic dispatch; Mixed integer linear programming

 1
1. Introduction:
 In the context of rising concerns surrounding climate change issues, most countries made
commitments to reduce their electricity-generating mix's carbon emissions gradually, notably through
massive development of variables renewables technologies like wind –onshore, offshore- and solar
photovoltaic, concentrating solar power. It is a significant change in the supply-side of electric systems.
Variable Renewable Energy (VRE) technologies are characterized by their high capital – negligible
variable costs and their primary position in the economic "merit order"1 dispatch to meet the electric
demand. Adding the fact that their generation is highly dependent on weather conditions makes it
optimal to prioritize them to meet the demand. Thus, the overall effect of developing high shares of
variable renewables in the generation mix is to replace technologies such as coal, lignite, and even
nuclear progressively as the primary means of generation of electric systems. Those technologies will
need to operate flexibly to adapt to the variable renewable sources' inherent variability to remain
valuable to the electricity system. In the context of deep decarbonization of the electric capacity mix,
nuclear seems to be the only “baseload” technology that may play a role in future systems, alongside
other systems components such as VRE, hydropower, storage facilities, demand-response, or low-
carbon hydrogen.
 Nuclear power plants typically operate in a "baseload" mode, meaning that they produce at their
nominal power level most of the time. As nuclear fixed costs are high and variable costs low, it is
economically optimal to use this operation mode. However, countries with a higher share of nuclear
capacities may be forced to maneuver their nuclear power plants' output to balance electricity demand
and supply. The case of the French electric system is blatant. As nuclear power plants represent 46.6%
of the country's installed capacities in 2019 and 70,6% of its electricity generation [1], they frequently
maneuver to participate in load-following or ancillary services. The nuclear fleet then provides a
significant part of the current French flexibility requirements. Broadly, part of the installed nuclear fleet
was initially designed to operate flexibly [2] or can be adapted to this regime through re-designing work
[3]. The literature regarding nuclear flexibility, its ability to follow load, and the additional costs
generated - wear of components, cost of retrofit and re-designing, fuel, and staff costs- is rich [3]–[12].
 Nonetheless, most of the electric power systems modeling literature (e.g. [13]) still represents
nuclear power as an inflexible technology, as noted by [11]. The studies that partially encompass nuclear
flexibility typically represent the nuclear generation with assumptions such as ramping constraints or
minimal stable power levels similar to other thermal technologies [12], [14]–[17]. Those modeling
practices do not accurately represent nuclear power plants' flexibility specificities, driven either by
neutron-transport constraints, primary circuit dynamics, or refueling strategies. Although reactors'
designs differ across the world with varying underlying technologies (Pressurized Water Reactors,
Boiling Water Reactors, CANada Deuterium Uranium, Fast-Neutron Reactor…), most of them are
capable of flexible maneuvers[3]. This paper focuses solely on Pressurized Water Reactors as it is the
current dominant nuclear design and is technically similar to the upcoming 3rd generation reactors.
 The present paper is in line with recent works ([10], [11]) that highlight the impact of physics-
induced plant flexibility modeling on the evaluation of future electric systems with renewable energy.
While resuming the main constraints framing nuclear flexibility, our objective is to focus on the fleet
planning optimization's impact on modeling results. The paper highlights the benefits of nuclear
planning optimization to integrate VRE production in simplified electric systems. The paper's main
contribution is the proposal of a novel Mixed-Integer Linear Programming model based on realistic
refueling constraints of PWRs to simulate fleet planning optimization. The other main contribution is
the case studies based on the French electric system's representative data, where we evaluate the benefits

1
 We refer here to the ranking of available generating units of an electric system, based on ascending order of
marginal costs, aiming to minimize the overall generation costs of the system. Low marginal cost technologies
then take priority over high marginal cost technologies in responding to the corresponding electricity demand.

 2
of using fleet planning optimization to integrate renewable energy in a nuclear-based capacity mix. We
find that using nuclear planning availability seasonality reduces the system's operational costs while
decreasing energy curtailment and the overall CO2 emissions of the system. However, the effect on
market prices and plants’ revenues is unsure.
 The paper has the following structure: Section 2 resumes the technical constraints of the flexible
operation of nuclear PWR. Section 3 presents a novel mathematical model to represent the nuclear fleet's
planning optimization as well as the unit commitment and economic dispatch model Antares-RTE used
in this paper. Section 4 resumes the different case studies and the model's results related to fleet planning
optimization. The last section concludes on the main findings and discusses future work.

 2. Flexibility limits of nuclear power plants:
 2.1 Pellet-cladding interaction and ramping constraints:
 Nuclear PWRs can modify their output level by changing the boric acid concentration, a neutron
absorber, in their primary circuit or by changing neutron-absorbing control rod insertion levels. The
underlying principle is the management of the fuel's chain reaction and the thermal energy level it
produces by modulating the fission reaction rate in the core. Typically, as the boron concentration in the
primary circuit increases or the insertion level of control rods in the fuel assemblies increases, the fission
reaction rate decreases, thus lowering the thermal power produced, the steam production rate, and the
electrical output of the power plant. [18] notes that, because control rods movement allows for faster
and more precise power management, plant's managers favor it over boric acid regulation to operate
flexibly. However, such power variations do not come without thermal and mechanical consequences.
 The control rods' movement in the core creates thermal variations that influence fuel pellets and
their surrounding claddings' volume. When inserting control rods, the temperature drops locally in the
core, and part of the fuel's pellets and claddings contract. Reversely, when withdrawing control rods,
the temperature rises locally, and part of the fuel's pellets and claddings dilate. Because the fuel pellets
have a higher thermal expansion coefficient than their claddings, their volume is more sensitive to
temperature variations. The power variations may bring the pellets and claddings in contact[19], creating
mechanical stress that endangers the claddings' integrity, corresponding to a breach of the first
containment barrier of PWRs. Although this Pellet-Cladding Interaction (PCI) phenomenon does not
incapacitate production, it is common practice not to carry out flexible maneuvers following breaches
in the cladding [6]. Other corrosion effects due to corrosive fission products may increase the occurrence
of such breaches.
 PCI's overall effect on the flexibility capabilities of PWRs is the limitation of their maximum power
ramping rate as not to create excessive mechanic stress and keep the number of breaches within the
design tolerance of fuel assemblies. This ramp level is highly dependent on the type of reactor, its
irradiation cycle advancement, its operating mode, and the amplitude of the power variation [11], [20],
[21]. Although most historical power variations do not exceed 0,5% of the plant's nominal power (Pnom)
per minute [2], the theoretical ramping rate limits of PWRs range from 2% Pnom per minute to 5%
Pnom per minute, and even 10% Pnom per minute for German PWRs [22]. Thus, even though the
majority of the power simulation models literature does implement hourly ramping constraints to
represent historical nuclear power variations (e.g., 25% Pnom per hour [11], [23]), PWRs do have higher
ramping capacities that do not limit their flexibility at an hourly time step.

 3
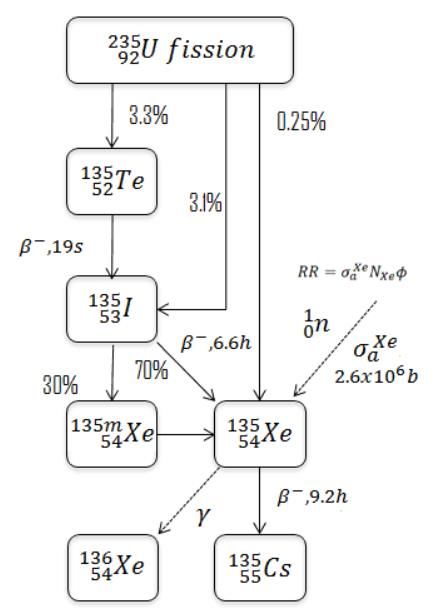
2.2 Xenon transients and boron concentration:
 During the fuel fission reaction, two fission fragments are emitted. They then travel a short distance
due to their positive charge and, once stopped, are considered as fission products. These are often
unstable atoms that will give birth to other radioactive decay fission products. Some of those fission
products are neutron poisons, meaning that they are undesired neutron absorbers that decrease the fuel's
fission reaction rate. Three different neutron poisons significantly impact the core reactivity: Xenon 135,
Samarium 149, and Gadolinium 157. Because Xenon 135 has the most considerable impact and is the
only neutron poison limiting the plant's flexibility, we chose not to consider Samarium 149 and
Gadolinium 157 reactivity defects.
 Xenon is a fission product that mainly originates from the decay of Iodine 135, a fission product
with a 6.7h half-life whose production rate is proportional to the fission reaction rate. Xenon 135
production in the core then evolves accordingly with the Iodine concentration in the core and
"disappears" either by neutron capture or decay, with a 9.2h half-life.

 Fig 1: Xenon 135 evolution chain, www.nuclear-power.net, Data: JANIS 4.0/NEA
 The fact that Xenon 135 originates mainly from the decay of Iodine 135 creates a temporal lag
between the fission reaction rate variations and Xenon 135 concentration, resulting in a flexibility
challenge that has to be managed [24]. As the reactor power rises, the I-135 concentration heightens
until the reactor's new equilibrium state is reached. Xe-135 concentration lessens because of increased
neutron flux, reaching a minimum three hours after the maneuvers' start, then goes back to an
equilibrium state due to the accumulated I-135 in the core. Reversely, as the reactor power decreases,
the I-135 production rate reduces, but the Xe-135 concentration heightens as it is still generated from
the accumulated I-135. Because Xe-135 is a strong neutron absorber, such transients' management is a
significant challenge to maneuverability, especially after large power variations. The reactivity

 4
variations induced by the Xenon transients can nonetheless be overcome during most of the fuel's
irradiation cycle, according to [10]. Thanks to the sufficient reactivity margin after refueling, it is
possible to compensate for the Xenon reactivity defects through boric acid concentration adjustments or
control rods' insertion level changes. [11] notes that if plant managers do stabilize their plant's output
after maneuvering for several hours[2], it is done to simplify operations but is not related to technical
limitations. However, at the end of the irradiation cycle, the core's reactivity decreases, and the reactivity
margin becomes insufficient to compensate for Xenon transients effects without losing criticality [10],
[24]. Indeed, the boric acid concentration in the primary circuit evolves following the reactivity decrease
due to the progressive fuel's "burn-up", resulting in a decreasing margin for boric acid adjustments in
the plant's primary circuit to control the fission reaction rate. Plants would then need to stabilize their
output for multiple hours after maneuvering before ramping back to their initial level. According to [10],
Xenon transients start to limit flexibility during the last 20% of the plant’s irradiation cycle. Xenon
transients' reactivity defects also explain why reactors need to remain closed for several hours after
shutting down while in their irradiation cycle.
 The achievable minimal stable power of PWRs then evolves according to the plants' advancement
in their irradiation cycle [3], [26]. During the first two-thirds of the irradiation cycle, plants can operate
flexibly up to 20% of their nominal power. Then, the achievable scope of maneuverability starts to
decreases, and the plant's minimal power starts to increase linearly until the boric acid concentration
reaches zero at the end of the fuel's irradiation cycle. The reactor can then only ensure primary and
secondary frequency regulation. Afterward, the PWR enters an "extended-cycle" phase where flexible
maneuvers are no longer possible, and the achievable maximal production capacity slowly decreases
following the fuel's depletion.

 2.3 Refueling strategies and nuclear planning:
 Each nuclear power plant alternates between successive generation phases and planned outage
phases linked to 1) the need to recharge fuel assemblies after the fuel’s depletion, 2) the need for
maintenance of components, and 3) security inspections to ensure that the reactor can operate safely.
Those three elements are crucial for available flexibility capacity at the plant level throughout the year.
 The generation phase duration depends on the reactor type, fuel cycle, and the fuel cycle’s utilities’
strategy. The irradiation cycle length that frames the generation phase’s duration is defined as Effective
Full Power Day (EFPD), which specifies how long reactors can operate at full power before their fuel’s
depletion. It ranges from 280 EFPD for older reactor designs such as CP0 reactors in France[27] to 500
EFPD and even 640 EFPD for newly-built reactors such as AP1000 [28] or EPR [29]. Those irradiation
cycle lengths correspond to generation phase duration ranging from 12 months to 24 months, depending
on the power plants’ load factor. The outage phase’s lengths depend on its type, either shorter refueling
outage or longer refueling and maintenance outage. Additional regulatory outages may occur to inspect
whether the nuclear plant meets safety requirements (i.e., decennial visit in France). Based on
operational feedback, the outage phases represent approximately one-fifth of the irradiation cycle length
[30]. This alternation between availability and unavailability is optimized beforehand to maximize the
available nuclear generation through peak demand and the plants' load factor. The resulting schedule
influences flexibility at two levels; the plant and the overall nuclear fleet. At the plant level, because of
outages or fuel burn-up, there are some periods where generation and participation in flexibility
requirements are impossible. At the fleet level, the addition of the combined electric system's reactors'
availability and flexibility capacities define the fleet's overall generation capacity and maneuverability.
The nuclear generation and flexibility availability is variable throughout the year, as illustrated in Figure
below. This optimized schedule is the primary driver of long-term flexibility.

 5
Fig 2: Average weekly nuclear availability, Years 2015-2019, France

 Second, plant managers typically do not shut down every reactor simultaneously due to human
resources and utility requirements constraints. Optimizing human resources for refueling and
maintenance tasks and maintaining the electric system generating margins are of primary importance
when deciding the fleet’s outage schedule [31]. For example, in the US, a maximum of 22.5 GWe2 of
its 97.2 GWe3 fleet went offline simultaneously over the 2016-2020 period. In France, a country with a
predominant nuclear fleet, a maximum number of 27 of its 58 reactors fleet went offline simultaneously
over the 2010-2019 period4. Even though no physical constraints prevent reactors from shutting down
simultaneously, it is crucial to ensure that a minimum share of the fleet is online to ensure that the
optimized planning is realistic.

 3. Unit-commitment (U-C) simulation models:
 3.1 Mixed-Integer Linear Programming (MILP) planning optimization model:

 As the plant’s irradiation cycle typically lasts for more than one year, it is necessary to adopt an
inter-annual approach to simulate the nuclear planning optimization. Using a benevolent system
manager approach, we built a Mixed-Integer Linear Programming model maximizing nuclear
availability when it benefits the electric system over several years. We consider this benefit equivalent
to maximizing nuclear availability during peak electric demand periods. A higher nuclear availability
during peak electric demand decreases peaking-plant use and drives prices low. The following heuristic
model aims to represent the nuclear planning dynamic:

2
 STATUS OF U.S. NUCLEAR OUTAGES, EIA 2021, “https://www.eia.gov/nuclear/outages/”
3
 World Nuclear Performance Report 2020. Produced by: World Nuclear Association. Published: August 2020.
Report No. 2020/008
4
 Computation by the authors, based on ASN data, https://www.asn.fr/Controler/Actualites-du-controle/Arret-
de-reacteurs-de-centrales-nucleaires

 6
 ∑ ∑ ∗ ∗ (1)
 =1 =1
 ∀ ∈ [0; ] : , + ≥ , − , −1 (2)
 =

 ∑ , + ≤ (3)
 =0
 ∀ ∈ [0; ] : , + ≤ 1 + , − , −1 (4)

 ∑ , ≥ (5)
 =1

Nomenclature:
Indices:
 : index of time, week.
 : index for nuclear units.
Variables:
 , : binary state variable for nuclear availability and outages, for nuclear unit , time .

Constants:
 : electric demand (MWh), time .
 : maximum power output (MW) for nuclear unit
 : minimum irradiation cycle duration (weeks) for nuclear unit
 : maximum irradiation cycle duration (weeks) for nuclear unit
 : minimum outages duration (weeks) for nuclear unit
 : maximum number of nuclear units that must be online simultaneously

Eq. (1) is the model’s objective function that maximizes the sum of the fleet’s available reactors times
their nominal power over a determined period. is a binary variable equal to 1 if the reactor
is available at time and 0 else. captures the demand variability across the studied period.
Eqs. (2), (3) frame the length of each plant’s irradiation cycle, ensuring that each reactor is available
during the entirety of its irradiation cycle length and preventing potential overrun of its extended-
cycle length . Eq. (4) frames the outages’ duration. It ensures that each reactor is unavailable for
 timesteps after shutting down for refueling or maintenance. Eq (5) limits the number of
nuclear units that can operate maintenance and refueling outages simultaneously.

 7
Minimum Maximum
 Equivalent Minimum Maximum
 Nominal Cycle Average Irradiation Irradiation
 Full Outage Outage
 power Lengths availability cycle cycle
 Power duration duration
 (MWe) (months) factor duration duration
 Days (weeks) (weeks)
 (weeks) (weeks)

Unit 1000 15 400 79.1% 10 14 56 66
 Table 1: Irradiation-cycle and outages lengths hypotheses

 This paper considers that all reactors are similar, with a 1000 MW nominal power, 15 months
 irradiation cycle length, and 79.1 % availability factor, equal to french PWRs’ availability factor since
 their industrial commissioning [32]. We chose to build our model at a weekly timestep to limit
 computational time. We hypothesized that each reactor shut down or start its irradiation cycle at the
 beginning of a week. The planning optimization timeframe chosen throughout the present paper is 18
 years, spanning the 2001–2019 period.

 3.2 MILP/UC electric system model:
 The economic dispatch model used in this paper’s scope is the ANTARES simulator developed by
 RTE. The paper by [33] provides a broad summary of the model. It is an open-source power system
 model that simulates the electric demand-supply equilibrium. The model consists of a unit-commitment
 program that determines the optimal economic dispatch of all the generating units in the system at an
 hourly timestep over one calendar year. The objective function minimizes the overall operational costs
 (variable, start-up, unsupplied energy costs) to meet the exogen hourly demand. Thus, the underlying
 discriminatory criterion between generators is the merit-order approach that ranks generators based on
 ascending order of short-term marginal costs. Apart from VRE sources, whose generation is considered
 exogen to the model, each generating unit’s behavior is subject to UC constraints related to its
 maximum/minimum production capacity and maximum/minimum up/downtime. The ANTARES
 simulator includes each unit’s availability planning, allowing modelers to adjust for seasonal plant’s
 outage finely. A custom ANTARES solver solves the MILP problem, finding the optimal generation
 profile for each unit given its constraints, and computes the resulting market prices, CO2 emissions,
 spilled energy, and unsupplied energy of the modeled electric system.
 The model integrates spinning reserves for thermal technologies in order to represent frequency
 regulation management. Aside from coal, gas, and fuel technologies, nuclear power plants contribute to
 automatic generation control signals sent by system operators and operating reserves. As existing
 reactors reserve 5-10% of their nominal capacity to frequency regulation and operating reserves, we
 consider that thermal plants reserve 10% of their nominal capacity for reserves.
 This paper uses the 7.0.1 version, Accurate-Economy mode, whose mathematical formulation can
 be found in [34]. Contrary to version 8.0, version 7.0.1 does not optimize the system’s capacity mix,
 meaning that this paper will focus on specific case studies whose installed capacities were determined
 exogenously. We consider that the environment is deterministic, with no uncertainties on future VRE
 production, demand level, thermal plants availabilities, and reserve requirements.

 8
4. Case study and results:
 4.1 Assumptions
 The French electric system is the basis of this paper’s case studies. We chose this system due to the
 historically high share of installed nuclear power, meaningful feedback on nuclear fuel-cycle
 management, and data availability regarding renewables and electric demand. The French electric
 demand data used to optimize the nuclear planning range from 2001 to 2019 is the historical demand
 originating from RTE, the French Transmission System Operator. We exclude the year 2020 due to the
 demand decrease induced by the Covid-19 crisis that impacted economic activities. The paper builds
 VRE production profiles using actual capacity factors data from the renewables.ninja website, whose
 use is widespread in the electric simulation literature. Using capacity factors instead of actual generation
 profiles allows for multiple case studies depending on VRE integration levels. Although our heuristic
 model creates inter-annual planning for a specified fleet, we limit our electric system simulation to only
 a representative year. Following [35] that computed the sum of absolute difference of wind onshore,
 wind offshore, and solar PV capacity factors, we focus on the year 2006 as VRE capacity factors seem
 to be the most representative of French renewable production over the 2000-2017 period. Thus, electric
 demand, VRE capacity factors, and the nuclear fleet resulting from our model heuristic model, which
 the Antares Simulator uses to simulate electric system operations, are all 2006 data. This paper also
 focuses only on the isolated electric system of one country, meaning that the following case studies do
 not account for potential flexibility levers such as interconnections or sector-coupling mechanisms (EV
 charging, hydrogen production…). The installed technologies are limited, with only onshore wind,
 offshore wind, solar photovoltaic, nuclear, and natural gas. VRE’s and nuclear’s installed capacities are
 case-specific and fixed exogenously, whereas natural gas capacity is an output of each simulation, where
 gas capacity is dimensioned to ensure no Loss of Load. The considered natural gas technology is Open-
 Cycle Gas Turbine plants with a 38% electrical efficiency due to their high flexibility. Because this
 paper does not account for investments and fixed costs, the natural gas varying capacity does not impact
 the model results aside from gas being the last marginal unit that fixes the market price. Variable costs
 such as fuel costs are fixed over one year and originate from the report by the Nuclear Energy Agency
 (NEA): The Costs of Decarbonisation: System Effects with High Shares of Nuclear and Renewables
 [12].

 Minimum Environmental
 Nominal Variable Minimum Minimum Start-Up Reserve
 Stable impacts
Technology capacity costs Uptime Downtime Costs requirements
 Power (gCO2eq/kWh)
 (MW) ($/MWh) (hours) (hours) ($/MW/start) (%)
 (%) – IPCC (2014)

 Wind - 0 - - - - - 11
 Solar PV - 0 - - - - - 41
 Nuclear 1000 11.5 50% 8 24 500 10% 12
 Natural
 300 96.11 25% 1 1 50 10% 490
 Gas
 Table 2. Overview of technology costs, flexibility and environmental impacts [12]
 The paper constrains the flexible behavior of each thermal technology modeled. As mentioned in
 Section 2.1, ramping constraints do not limit nuclear or OCGT flexibility at an hourly timestep. Thus,
 we limit flexibility constraints to minimum up and downtime constraints only. We chose not to represent
 the minimal power evolution in this paper to focus our analysis on the effects of nuclear planning
 optimization. Implications of this assumption are discussed in Section 5. The other flexibility
 characteristics in Table 1 correspond to plants commissioned in 2020 [12].

 9
4.2 Cases:
 We simulate multiple cases that explore various capacity mixes and nuclear planning assumptions.
 The two case categories refer to two simulation assumptions: with or without heuristic nuclear planning
 optimization. The cases without nuclear planning optimization assume that nuclear availability is
 constant throughout the simulated year. This constant availability is equal to the average availability of
 the nuclear fleet in the corresponding heuristic planning case using our heuristic planning optimization
 model described in 3.1. The objective is to compare simulation results between those two core cases to
 evaluate the impact of nuclear planning optimization on modeling results. We include several sensitivity
 cases for each of those two core cases depending on the number of reactors installed and VRE
 penetration. Those two parameters are essential to the flexibility required of nuclear power plants. Each
 reactor fleet sensitivity cases represent various numbers of reactors, ranging from 20 reactors to 60
 reactors. Each VRE penetration cases represent various VRE capacities, where VRE provides from 0 to
 80 % of the total load if no curtailment occurs. We consider that the proportion of wind –onshore and
 offshore- capacities and solar capacities remain constant for each sensitivity case. We assume that this
 proportion is equal to the currently installed French VRE capacities[36]. Accounting for all VRE
 penetration, fleet size, and nuclear planning assumption cases, we simulate a total of 5x3x2 = 30
 different cases. Table 2 details the corresponding installed capacities for each renewable and nuclear
 sensitivity case.

 Nuclear capacity (GW) Gas OCGT (GW)
 Wind –
 VRE Solar
 Onshore and 20 40 60 20 40 60
penetration PV
 Offshore - reactors reactors reactors reactors reactors reactors
 scenario (GW)
 (GW) scenario scenario scenario scenario scenario scenario

0% VRE 0 0 68.03* 51.77* 35.49*
20% VRE 19.96 33.86 64.17* 47.91* 31.63*
40% VRE 39.93 67.72 20 40 60 62.83* 46.57* 30.29*
60% VRE 59.89 101.58 61.49* 45.23* 28.95*
80% VRE 79.85 135.44 60.15* 43.89* 27.61*
 Table 3. Installed capacities for each simulated cases
 *determined ex-post

 4.3 Results:
 This section presents key results for each of our planning optimization and VRE penetration cases.

 4.3.1 Heuristic planning optimization results:
 We computed a heuristic reactors’ operating schedule for each of our nuclear fleet scenario cases –
 20 reactors, 40 reactors, and 60 reactors (represented in Fig 4.). The heuristic planning allows for greater
 nuclear availability during peak-demand periods and lower nuclear availability during low-demand
 periods for each nuclear fleet scenario. Indeed, each heuristic planning scenario is positively correlated
 to the electric demand profile. Thus, our heuristic model does replicate the usual nuclear availability
 dynamics. Compared to the constant availability assumption, each heuristic planning is better correlated

 10
to the demand profile. Secondly, we find that the impact of the planning optimization varies according
to the size of the fleet. The profile gap between the constant availability assumption and the heuristic
planning is more significant as the nuclear-installed capacity increases.

 Fig 3. Nuclear availability for each nuclear fleet size scenario, resulting from the heuristic planning
 optimization model.

 4.3.2 Simulation results:
Using the heuristic planning optimization discussed in 4.3.1), we simulate power system operation with
several VRE penetration levels - 0%, 20%, 40%, 60%, 80% VRE penetration, and compare the
simulation results to the corresponding simulations with constant availability assumptions.

 4.3.2.1 Thermal commitment dispatch:
 As the gross VRE production level is weather-dependent, its level is not sensitive to nuclear
planning optimization. For brevity, we will not detail the gross VRE production level in this section and
will focus on the thermal commitment dispatch. This dispatch evolves accordingly to each cases’
installed capacities, with higher nuclear production as the number of reactors in the mix increases.
Conjointly, the gas production level decreases as it is the marginal technology of the “merit order”.
 The impact of planning optimization on optimal thermal commitment dispatch varies depending on
the VRE penetration level and the nuclear fleet size. In cases with low VRE penetration and a limited

 11
number of installed reactors, planning optimization does not seem to impact the optimal commitment
 dispatch of thermal generating units, resulting in non-significant output changes. It may indicate that
 planning optimization is not of primary order when considering electric systems where nuclear power
 plants profit from a load factor near 100% (reported in Fig. 4). In cases with low VRE penetration and
 high fleet capacity, nuclear production moderately increases when the heuristic nuclear planning
 assumption is used. Conjointly, gas production decreases, meaning that the heuristic planning
 optimization resulted in diminished use of peaking plant to ensure the electric demand-supply
 equilibrium.
 In cases with higher VRE penetration and fleet capacity, nuclear power plants are expected to
 maneuver more due to the decreasing level of residual demand. The resulting nuclear capacity factor
 then evolves negatively to VRE penetration and fleet size. In such capacity mixes, the impact of planning
 optimization seems to be a joint decrease of nuclear and gas production compared to cases that assume
 that the nuclear operational planning is constant (Table 3.). The fall of nuclear and gas gross production
 is more significant as the nuclear fleet’s size increases. The planning optimization decreases not only
 the use of flexible peaking gas plants but also nuclear plants. It indicates that optimizing the nuclear
 operational planning decreases the need for flexible peaking plants to ensure the electric demand-supply
 equilibrium. On the other hand, the nuclear production decrease seems counterintuitive, as gas
 production decreases and the planning optimization allows for greater nuclear capacity during peak-
 demand periods. The annual commitment dispatch is insufficient to conclude on the origin of this
 decrease.

 0% VRE 20% VRE 40% VRE 60% VRE 80% VRE

Technology Nuclear Gas Nuclear Gas Nuclear Gas Nuclear Gas Nuclear Gas

 1.48E+08 3.32E+08 1.47E+08 2.37E+08 1.4E+08 1.52E+08 1.2E+08 9.79E+07 9.87E+07 6.47E+07
20 reactors (0.02%) (-0.01%) (0.02%) (-0.01%) (-0.12%) (-0.02%) (-2.87%) (0.25%) (-4.94%) (0.18%)

 2.9E+08 1.9E+08 2.81E+08 1.03E+08 2.43E+08 5.22E+07 1.96E+08 2.83E+07 1.55E+08 1.61E+07
40 reactors (0.01%) (-0.02%) (0.31%) (-0.89%) (-0.61%) (-4.56%) (-4.91%) (-8.60%) (-8.65%) (-10.65%)

 4.17E+08 6.31E+07 3.65E+08 1.96E+07 2.92E+08 7.31E+06 2.26E+08 3.36E+06 1.74E+08 1.84E+06
60 reactors (1.40%) (-8.38%) (1.93%) (-27.28%) (-1.39%) (-35.04%) (-7.58%) (-37.36%) (-12.45%) (-38.65%)

 Table 4: Annual thermal energy dispatch – MWhe – in the heuristic planning cases and change relative
 to the constant planning cases (in brackets)

 12
Fig 4. Annual nuclear capacity factor

 4.3.2.2 Curtailment of renewables and nuclear:
 The curtailed energy level of our simulated cases ranges from 0% of the total electricity production
(e.g., 0% VRE penetration – 20 reactors case – both heuristic and constant planning assumption) to
18.01% (i.e., 80% penetration – 60 reactors cases – constant planning assumption). Such phenomena
occur when the electric production is higher than the corresponding electric load because of an excessive
VRE production or a lack of thermal plants flexibility that, at some point, cannot adjust their output.
Regardless of the nuclear planning assumptions, the curtailed energy level positively correlates with
VRE penetration levels that increase flexibility needs to ensure the supply-demand equilibrium. Another
finding is that the curtailed energy level of our cases positively correlates to the installed nuclear fleet
capacity, with a higher share of curtailed energy as the number of reactors in the simulated mixes
increases. This negative effect of the size of the fleet on energy curtailment level is due to the
replacement of flexible gas production by nuclear technology, whose flexibility is limited.
 As we compare the heuristic and constant nuclear planning cases, we find that nuclear planning
optimization decreases the wasted VRE energy share due to curtailment. In like manner to the thermal
commitment dispatch, this impact is not significant in low VRE and nuclear capacity cases. In those
cases, the significant gas production meets most of the flexibility requirements, resulting in marginal
energy curtailment levels, and the benefits of nuclear planning optimization are null. Those benefits
seem substantial as soon as VRE ensures a significant share of the electric demand and the nuclear
capacity is higher than 20 GW. We evaluated the curtailment of nuclear technology, i.e., the production
that is wasted as nuclear cannot reduce its output due to a lack of flexibility. We find that the level of
nuclear production curtailment is lower as the nuclear planning profile is correlated to the electric
demand. Hence, even though the gross nuclear production level is higher in cases assuming that the
nuclear planning is constant (see. Section 4.3.2.1), this results in higher production curtailment. The
gross nuclear production increase in the constant nuclear planning assumptions cases results from the
curtailed production surplus. Finally, the combined decreases of VRE and nuclear curtailment highlights
the benefits of nuclear planning optimization in renewables and nuclear-driven cases.

 13
Fig 5. Curtailed energy for each VRE, nuclear, and nuclear planning assumption case

 4.3.2.3 Systems costs and CO2eq emissions:
 The overall effect of the heuristic nuclear planning is the decrease of the electric systems’
operational costs in cases with a significant share of VRE penetration and high nuclear capacity. The
first driver is the increasing share of the demand ensured by VRE technologies, whose operational costs
are null, due to lower VRE curtailment levels. Other drivers are the decreasing gas production that is
replaced by nuclear production and the decreasing total nuclear production, whose curtailment level
decreases (see Section 4.3.2.1 and Section 4.3.2.2). The cost benefits derived from the heuristic planning
optimization can be as high as a 15.38% cost decrease for the case with 80% VRE penetration and 60
GW nuclear capacity, highlighting the economic benefits of nuclear planning optimization as we
consider electric systems with substantial shares of renewables and nuclear. Similarly to systems costs,
the Global Warming Potential (GWP) of generating electricity, measured as CO2eq/kWh generated,
decreases with the heuristic nuclear planning optimization in cases with 40 and 60 reactors, the relative
decrease being as high as 22.42% in the 80% VRE penetration – 60 GW nuclear capacity case. The
environmental benefits of the heuristic nuclear planning optimization increase with the VRE penetration
in the 40 GW nuclear capacity cases, but not in the 60 GW nuclear capacity cases where the relative
decrease stagnates once VRE penetration reaches 20%. On the other hand, the heuristic nuclear planning
optimization does not influence the electric system's environmental impacts if the fleet capacity is low
- e.g., cases with 20 reactors.

 14
Fig 6. Heuristic planning cost and CO2eq changes relative to constant planning case

 4.3.2.4 Market prices and revenues per technology:
 The market price level evolves accordingly with the commitment dispatch of each case, with higher
market prices in cases with higher gas production, which is the marginal technology based on the merit
order. Thus, market prices decrease in cases with a higher nuclear capacity. The heuristic planning
optimization does seem to have a limited effect on the average market price level, with slight prices
decreases ranging from 0.3% to 12.25% of the average market prices in most cases (e.g., 40% VRE
penetration – 20 reactors, 60%, 80% VRE penetration – 40 reactors and 0%, 40%, 60%, 80% VRE
penetration – 60 reactor cases), but also increasing or stagnating prices in others. Because the average
price per MWh decrease for all cases is 0.54$ per MWh, we argue that the magnitude of this price
decrease is not sufficient to conclude on the potential benefits of planning optimization on market prices.
 On the other hand, heuristic planning optimization decreases the number of negative and null price
hours. In periods of high VRE production and when thermal production cannot adjust its production
level accordingly to the residual demand variations, negative prices may occur and reflect the thermal
plants' willingness to avoid shutting down. Apart from the 0% VRE penetration cases and the 20 % VRE
penetration – 20 GW nuclear capacity cases, where the number of negative price hours is null, the
heuristic planning optimization does reduce the number of hours where market prices are either zero or
negative. This result directly reflects the reduced level of VRE and nuclear curtailments that the heuristic
planning optimization entails. Conjointly, the number of hours with peaking prices also decreases due
to reduced gas production use, which is the primary driver of high market prices. For brevity, the
following table details the market prices structure only for the 40% penetration – 60 GW nuclear
capacity case, whose results are representative of renewables and nuclear-driven capacity mix cases.

 Average market price Number of hours Number of hours
 Planning assumption
 $/MWh 50 $/MWh
 Constant 24.24 2026 1196
 Heuristic 21.27 1402 905
 Relative change -12.25% -30.80% -24.33%
 Table 5. Market price data: 40% VRE penetration – 60 GW nuclear capacity case

 As the heuristic planning optimization does decrease the number of negative price hours, it
should increase the revenues of both VRE and nuclear technologies. However, this is not the case as we
analyze the different case results, with varying VRE and nuclear revenue changes, positive or negative,

 15
that do not reveal specific trends. It is then impossible to conclude on a potential effect of the heuristic
 planning optimization based on each technology’s revenue alone. To further our analysis, we investigate
 the composition of each technology revenue. In this paper’s simplified case studies, we argue that the
 revenues’ drivers are two-fold: first, the share of each technology output sold at low prices, driving
 revenues down, and second, the share sold at peaking prices, increasing revenues. If those two shares
 conjointly increase or decrease, their effects on revenues may balance out. We find that for each of our
 VRE penetration and nuclear capacity cases, the heuristic planning optimization decreases both the
 output share of all simulated technologies sold at low market prices and high market prices. Thus, for
 all low-carbon technologies –wind, solar and nuclear-, the revenue benefits stemming from less negative
 price occurrences are offset by the rarefication of peaking prices, driving the average market prices
 down. We illustrate this phenomenon using the following Table that highlights that even though each
 technology’s output share sold at negative prices lessens, it can be insufficient to increase the
 technology’s revenue. The contradictory effects of the decrease of negative price occurrences and the
 decrease of peaking price occurrences in all of our simulated cases also clarify why the heuristic nuclear
 optimization assumption has no definitive effect on the average market price level (see. Section 4.3.2.4).

 Solar Wind Nuclear
 Output Output Output Output Output Output
 Planning Revenues share sold share sold Revenues share sold share sold Revenues share sold share sold
assumption per MWh at at per MWh at at per MWh at at
 50$/MWh 50$/MWh 50$/MWh

 Constant 11.11 43.95% 5.51% 15.11 36.19% 9.18% 26.68 15.03% 19.98%

 Heuristic 10.82 35.78% 4.05% 13.73 25.89% 6.15% 24.19 8.21% 16.12%

 Relative
 -2.64% -18.60% -26.46% -9.11% -28.47% -32.96% -9.31% -45.34% -19.32%
 change
 Table 6. Average revenues level and profile: 40% VRE penetration – 60 GW nuclear capacity case
 In total, the impact of the heuristic planning optimization on market prices and technology revenues
 is ambiguous. The only simulated technology whose revenues decrease in all cases is gas due to its
 replacement by nuclear production. Regarding market prices, the heuristic planning optimization limits
 extreme price events, resulting in varying average prices per MWh changes. For VRE and nuclear
 profitability, the revenue benefits resulting from lower curtailment levels are offset by the decreasing
 peaking price share in some of our simulated cases.

 5. Conclusions:
 The present paper explores nuclear planning optimization benefits to integrate renewable energy in
 power systems such as wind and solar. We present a novel heuristic formulation of nuclear refueling
 and maintenance planning that frames nuclear operations, including irradiation-cycle and outage
 lengths. Using the resulting heuristic planning, we find that nuclear planning optimization does reduce
 operational costs, energy curtailments, peaking-plant use, and environmental impacts linked to
 electricity generation. Another key finding is that nuclear planning optimization’s relevance increases
 as the relative share of VRE and nuclear capacity in the capacity mix heighten, with low influence on

 16
simulation results in cases with few reactors and limited VRE penetration and significant impacts in
other cases. However, the impact of planning optimization on market prices and technologies’ revenues
is ambiguous, as the revenue benefits linked to the decrease of negative price occurrence can be offset
by a decreasing number of peak prices.
 The results found in this paper should nonetheless be contextualized. The numerical results are case-
specific, and comparison with real-life power systems should be made cautiously, with assumptions
such as gas prices heavily influencing those numerical results. Represented power systems are
simplistic, with only one country represented, which eludes the physical network constraints that may
reinforce energy curtailments. Most flexibility levers are also excluded, whether interconnections with
neighboring electric systems, storage facilities, hydroelectricity, and demand-side response, all of which
would likely decrease the flexibility value of nuclear planning optimization. Our objective in
representing only five generating technologies – wind onshore, wind offshore, solar photovoltaic,
nuclear, and gas CCGT - was to isolate the impact of nuclear planning optimization on the modeling
results. Therefore, this paper’s results should be extrapolated with care. We argue that nuclear planning
optimization should yield similar benefits in power systems with significant nuclear and VRE capacity,
where the nuclear availability seasonality would participate in VRE integration, reducing costs,
environmental impacts, and energy curtailment. Future work could focus on the impact measurement of
nuclear planning optimization in broader power systems with larger balancing areas, increased number
of generating technologies, and better modeling of flexibility levers.
 It is important to note that the proposed nuclear planning optimization model is a heuristic
formulation of a complex process to determine when nuclear power plants begin their irradiation cycle
or their outage phase. We consider that all reactors are similar, which is an unrefined representation of
a realistic nuclear fleet composed of diverse power plants design with varying irradiation cycle lengths
and nominal power. We also consider that the future is deterministic, with nuclear planning optimization
spanning 19 years without any uncertainties. The maintenance and refueling operations duration are
considered known beforehand, which is a gross simplification of real-life outages whose duration may
randomly increase as operational difficulties arise. The inclusion of stochastic elements into the heuristic
nuclear planning model would significantly impact the resulting optimal nuclear schedules. Such
considerations are left for future work. As mentioned in Section 2, the need to schedule refueling and
maintenance operations is not the only flexibility limit that frames nuclear adaptability to an increasing
share of VRE. Phenomena that were not implemented in this paper’s simulated cases, such as Xenon
transients, prevent reactors from maneuvering at the end of their irradiation cycle and lessen the value
of nuclear flexibility found in this paper. The analysis of the causal relationship between the nuclear
planning optimization and the resulting maneuverability capacity of the fleet that depends on each
reactor’s irradiation cycle advancement would help evaluate the benefits of nuclear outage scheduling.

REFERENCES:

[1] RTE, “Bilan Electrique 2019.” 2020.
[2] A. Lokhov, “Load-following with nuclear power plants,” NEA News, no. 29.2, pp. 18–20,
2011.
[3] IAEA, “Non-baseload Operation in Nuclear Power Plants: Load Following and Frequency
Control Modes of Flexible Operation,” International Atomic Energy Agency, Apr. 2018. Accessed:
Apr. 09, 2019. [Online]. Available: https://www.iaea.org/publications/11104/non-baseload-operation-
in-nuclear-power-plants-load-following-and-frequency-control-modes-of-flexible-operation

 17
[4] N. Troy, E. Denny, and M. O’Malley, “Base-Load Cycling on a System With Significant
Wind Penetration,” IEEE Trans. Power Syst., vol. 25, no. 2, pp. 1088–1097, May 2010, doi:
10.1109/TPWRS.2009.2037326.
[5] N. Kumar, P. Besuner, S. Lefton, D. Agan, and D. Hilleman, “Power Plant Cycling Costs,”
NREL/SR-5500-55433, 1046269, Jul. 2012. doi: 10.2172/1046269.
[6] OECD NEA, Nuclear Energy and Renewables: System effects in low-carbon electricity
systems. Paris: OECD Nuclear Energy Agency, 2012. Accessed: Nov. 22, 2013. [Online]. Available:
http://www.oecd-ilibrary.org/content/book/9789264188617-en
[7] M. Lykidi and P. Gourdel, “How to manage flexible nuclear power plants in a deregulated
electricity market from the point of view of social welfare?,” Energy, vol. 85, pp. 167–180, Jun. 2015,
doi: 10.1016/j.energy.2015.03.032.
[8] C. Cany, C. Mansilla, P. da Costa, G. Mathonnière, T. Duquesnoy, and A. Baschwitz,
“Nuclear and intermittent renewables: Two compatible supply options? The case of the French power
mix,” Energy Policy, vol. 95, pp. 135–146, Aug. 2016, doi: 10.1016/j.enpol.2016.04.037.
[9] R. Loisel, V. Alexeeva, A. Zucker, and D. Shropshire, “Load-following with nuclear power:
Market effects and welfare implications,” Prog. Nucl. Energy, vol. 109, pp. 280–292, Nov. 2018, doi:
10.1016/j.pnucene.2018.08.011.
[10] R. Ponciroli et al., “Profitability Evaluation of Load-Following Nuclear Units with Physics-
Induced Operational Constraints,” Nucl. Technol., vol. 200, no. 3, pp. 189–207, Dec. 2017, doi:
10.1080/00295450.2017.1388668.
[11] J. Jenkins, Z. Zhou, R. B. Vilim, F. Ganda, F. de Sisternes, and A. Botterud, “The benefits of
nuclear flexibility in power system operations with renewable energy,” Appl. Energy, vol. 222, pp.
872–884, Jul. 2018, doi: 10.1016/j.apenergy.2018.03.002.
[12] OECD NEA, The Costs of Decarbonisation: System Costs with High Shares of Nuclear and
Renewables. Paris: OECD Nuclear Energy Agency, 2019. [Online]. Available: https://www.oecd-
nea.org/ndd/pubs/2019/7299-system-costs.pdf
[13] A. Mileva, J. Johnston, J. H. Nelson, and D. M. Kammen, “Power system balancing for deep
decarbonization of the electricity sector,” Appl. Energy, vol. 162, pp. 1001–1009, Jan. 2016, doi:
10.1016/j.apenergy.2015.10.180.
[14] N. A. Sepulveda, J. D. Jenkins, F. J. de Sisternes, and R. K. Lester, “The Role of Firm Low-
Carbon Electricity Resources in Deep Decarbonization of Power Generation,” Joule, vol. 2, no. 11, pp.
2403–2420, Nov. 2018, doi: 10.1016/j.joule.2018.08.006.
[15] F. J. de Sisternes, J. D. Jenkins, and A. Botterud, “The value of energy storage in
decarbonizing the electricity sector,” Appl. Energy, vol. 175, pp. 368–379, Aug. 2016, doi:
10.1016/j.apenergy.2016.05.014.
[16] J. Wu, A. Botterud, A. Mills, Z. Zhou, B.-M. Hodge, and M. Heaney, “Integrating solar PV
(photovoltaics) in utility system operations: Analytical framework and Arizona case study,” Energy,
vol. 85, pp. 1–9, Jun. 2015, doi: 10.1016/j.energy.2015.02.043.
[17] Y. Alimou, N. Maïzi, J.-Y. Bourmaud, and M. Li, “Assessing the security of electricity supply
through multi-scale modeling: The TIMES-ANTARES linking approach,” Appl. Energy, vol. 279, p.
115717, Dec. 2020, doi: 10.1016/j.apenergy.2020.115717.
[18] IEA, “Status of power system transformation : Technical Annexes,” 2018.

 18
[19] J. Brochard et al., “Modelling of Pellet Cladding Interaction in PWR fuel,” p. 8.
[20] H. Ludwig, T. Salnikova, and A. Stockman, “Load cycling capabilities of German Nuclear
Power Plants (NPP),” vol. 55, no. Issue 8/9 August/September, 2010.
[21] NEA, “Technical and Economic Aspects of Load Following with Nuclear Power Plants,” p.
53, 2011.
[22] IEA, “Status of Power System Transformation 2018,” p. 115, 2018.
[23] B. Shirizadeh, P. Quirion, and CIRED, “Low-carbon options for the French power sector:
What role for renewables, nuclear energy and carbon capture and storage?,” Energy Econ., vol. 95, p.
105004, Mar. 2021, doi: 10.1016/j.eneco.2020.105004.
[24] H. Ukai and T. Iwazumi, “A new approach to control of xenon spatial oscillation during load
follow operation via robust servo systems,” IEEE Trans. Nucl. Sci., vol. 41, no. 6, Art. no. 6, Dec.
1994, Accessed: Apr. 15, 2021. [Online]. Available: https://ieeexplore.ieee.org/document/340634
[25] M. Muniglia, “Optimisation du pilotage d’un Réacteur à Eau Pressurisée dans le cadre de la
transition énergétique à l’aide d’algorithmes évolutionnaires,” 2017. Accessed: Apr. 02, 2019.
[Online]. Available: https://tel.archives-ouvertes.fr/tel-01678043/document
[26] S. Feutry, “Production renouvelable et nucléaire : deux énergies complémentaires,” Rev.
Générale Nucl., no. 1, pp. 23–28, Jan. 2017, doi: 10.1051/rgn/20171023.
[27] C. Cany, “Interactions entre énergie nucléaire et énergies renouvelables variables dans la
transition énergétique en France : adaptations du parc électrique vers plus de flexibilité,” Université
Paris-Saclay, CentraleSupelec, 2017.
[28] R. F. Mahmoud, M. K. Shaat, M. E. Nagy, and S. A. Agamy, “AP1000 Core Design
Development for Higher Burn-up and Long Operational Cycle Length,” J. Phys., p. 6.
[29] “EUR (2001), European Utility Requirements, Vol. 2, revision C. EUR, France, 2001.”
[30] Commissariat à l’énergie atomique et aux énergies alternatives, CEA Saclay, and Institut de
technico-économie des systèmes énergétiques, “Elecnuc: Les centrales nucléaires dans le monde -
Nuclear power plants in the word. Edition 2018.” 2018.
[31] T. A. Rieck, M. Benedict, E. A. Mason, J. C. Turnage, and B. E. Prince, “Effect of refueling
decisions and engineering constraints on the fuel management for a pressurized water reactor,”
Massachusetts Inst. of Tech., Cambridge; comps.; Oak Ridge National Lab., Tenn. (USA), ORNL-
TM-4443, Jan. 1974. Accessed: Apr. 28, 2021. [Online]. Available:
https://www.osti.gov/biblio/4333845
[32] Commissariat à l’énergie atomique et aux énergies alternatives, CEA Saclay, and Institut de
technico-économie des systèmes énergétiques, “Elecnuc: Les centrales nucléaires dans le monde -
Nuclear power plants in the word. Edition 2019.” 2019.
[33] M. Doquet, R. Gonzales, S. Lepy, S. Momot, and F. Verrier, “A new tool for adequacy
reporting of electric systems: ANTARES,” ResearchGate, 2008, Accessed: Mar. 04, 2019. [Online].
Available:
https://www.researchgate.net/publication/289478412_A_new_tool_for_adequacy_reporting_of_electri
c_systems_ANTARES
[34] RTE, “Antares-Optimization-Problems-Formulation,” May 2017. Accessed: Mar. 04, 2019.
[Online]. Available: https://antares.rte-france.com/wp-content/uploads/2017/07/170522-Antares-
Optimization-Problems-Formulation.pdf

 19
You can also read