THE STAR ENTERTAINMENT GROUP FY2021 RESULTS PRESENTATION - THURSDAY 19 AUGUST 2021
←
→
Page content transcription
If your browser does not render page correctly, please read the page content below
THE STAR ENTERTAINMENT GROUP

 FY2021 RESULTS PRESENTATION

            THURSDAY
            19 AUGUST
               2021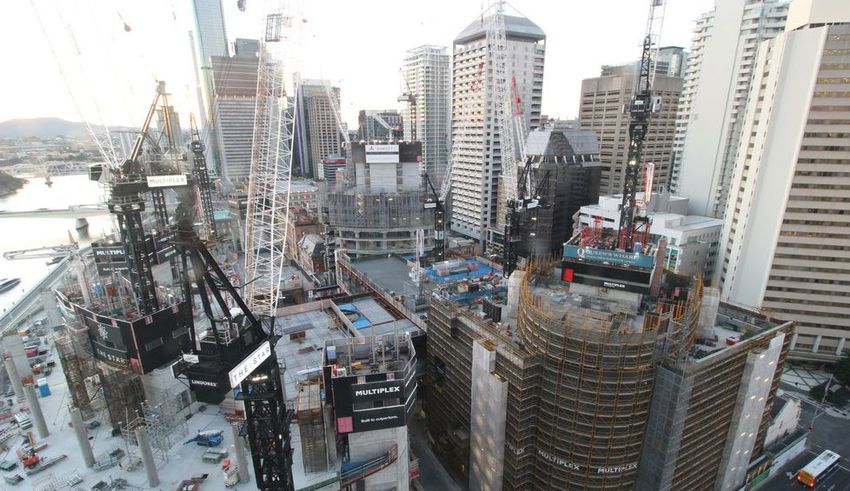
THE STAR ENTERTAINMENT GROUP
THE STAR ENTERTAINMENT GROUP LIMITED (ASX: SGR)
BASIS OF PREPARATION AND NON-IFRS INFORMATION
♦ Information in this presentation is provided as at the date of the presentation unless specified otherwise. It should be read in conjunction with The Star
  Entertainment Group Limited’s financial report for the full year ended 30 June 2021 (Financial Report) and other disclosures made via the Australian
  Securities Exchange
♦ The Star Entertainment Group results are reported under International Financial Reporting Standards (IFRS). This presentation may include certain
  non-IFRS measures including normalised results, which are used internally by management to assess the performance of the business
♦ Non-IFRS measures and current trading 1H FY2022 results to date have not been subject to audit or review
♦ Normalised results reflect the underlying performance of the business as they remove the inherent win rate volatility of the International VIP Rebate
  business. Normalised results are adjusted using an average win rate of 1.35% on actual turnover, taxes and revenue share commissions
♦ Normalised EBIT and Normalised EBITDA are calculated based on normalised gross revenue, taxes and revenue share commissions. Significant items
  are excluded from the normalised results
♦ Queensland results referred to in this presentation relate to The Star Gold Coast and Treasury Brisbane segments as reported in the Financial Report
♦ Comparatives are generally to the prior corresponding period, however, revenue comparatives in 2H FY2021 are more meaningful to 2H FY2019
♦ The Star Entertainment Group retrospectively adopted IFRIC’s agenda decision, released in April 2021, relating to the change in accounting treatment
  for configuration and customisation costs incurred related to Software as a Service (SaaS) arrangements. SaaS arrangements are arrangements
  whereby contracted access is given for use of cloud hosted software for a period of time. The new interpretation disallows the capitalisation of
  configuration and customisation costs relating to SaaS arrangements. Consequently, costs incurred to configure or customise SaaS arrangements will
  be expensed as they are incurred. Application of the new interpretation resulted in the derecognition of software assets, associated depreciation and an
  increase in operating costs for the periods to which they relate. Comparatives have been restated

DISCLAIMER
♦ This presentation is prepared for information purposes only and does not take into consideration any individual investor’s circumstances. The Star
  Entertainment Group recommends investors make their own assessments and seek independent professional advice before making investment
  decisions
♦ This presentation may include forward looking statements and references which, by their very nature, involve inherent risks and uncertainties. These
  risks and uncertainties may be matters beyond The Star Entertainment Group’s control and could cause actual results to vary (including materially)
  from those predicted. Forward looking statements are not guarantees of future performance. Past performance information in this presentation is
  provided for illustration purposes only. It is not indicative of future performance and should not be relied upon as such
♦ This presentation has been prepared by The Star Entertainment Group (unless otherwise indicated). Information may be reproduced provided it is
  reproduced accurately and not in a misleading context. Where the material is being published or issued to others, the sources and copyright status
  should be acknowledged. Some information included in this presentation has been provided by third parties with their consent. The Star Entertainment
  Group does not accept any responsibility for the accuracy or completeness of that information

                                                                                                                                                          2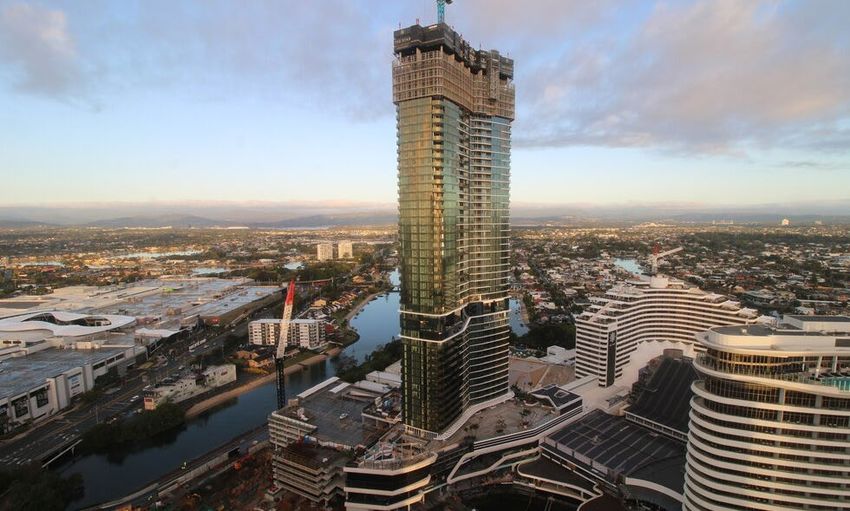
THE STAR ENTERTAINMENT GROUP
AGENDA

1. OVERVIEW

2. FINANCIALS

3. PRIORITIES

4. Q&A

                               3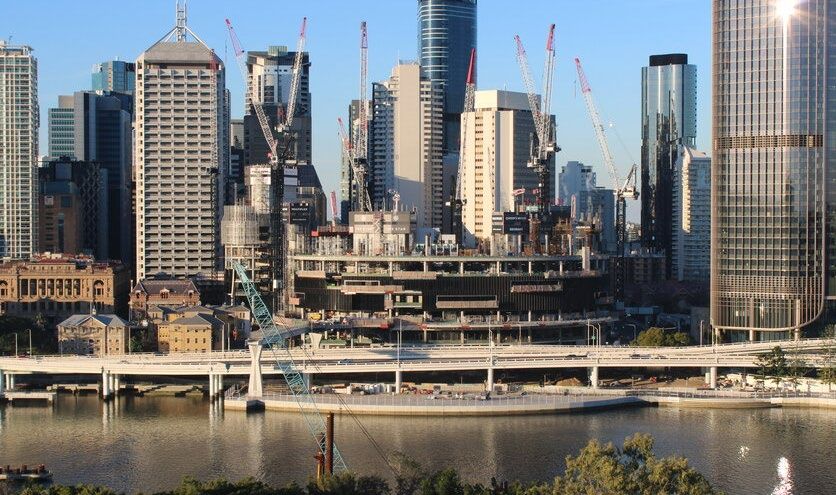
OVERVIEW
FY2021 HIGHLIGHTS
    PERFORMANCE                                                 ♦ Normalised Group revenue of $1.56bn, EBITDA of $430m and NPAT of $116m*
 IMPACTED BY COVID-19                                           ♦ Statutory EBITDA of $427m (before significant items) and statutory NPAT of $58m (after
 RELATED RESTRICTIONS                                             significant items)
                                                                ♦ COVID-19 related property shutdowns, operating restrictions and border closures materially
                                                                  impacted revenues and earnings

                                                                ♦    Queensland properties’ EBITDA increased 48% on pcp to $226m, record annual earnings
      KEY PERFORMANCE                                           ♦    Gold Coast domestic gaming revenue in 2H FY2021 up 18% on 2H FY2019**, Brisbane +3%
         HIGHLIGHTS
                                                                ♦    Group slots revenue in 2H FY2021 up 4% on the comparative period in 2H FY2019
                                                                ♦    Group loyalty gaming revenue in 2H FY2021 up 4% on 2H FY2019

      STRONG COST                                               ♦ Operating expenses down 11% on pcp to $740m***, down 30% on FY2019
   CONTROL AND MARGIN                                           ♦ $50m fixed cost reduction program progressed with full run-rate to be realised in FY2022
       EXPANSION                                                ♦ Group normalised EBITDA margin improved from 21.8% to 27.5%

                                                                ♦    Net debt reduced by $211m during the period
      BALANCE SHEET                                             ♦    Net debt/EBITDA declined to 2.7x, substantial liquidity on hand ($492m)
     POSITION IMPROVED
                                                                ♦    Capex down 63% to $89m****, well below D&A of $211m
                                                                ♦    Significant growth investments continuing to plan – QWB and Gold Coast Towers 1 and 2

                                                                ♦ VIP asset sales in FY2021, additional jet to be sold in FY2022
            ASSET SALES
                                                                ♦ In due diligence for the sale of an interest in the Treasury Brisbane buildings, targeting a sale
            PROGRESSING
                                                                  agreement in 1H FY2022
                                                                ♦ Initiated a formal process for the sale and leaseback (or similar transaction) of a minority
                                                                  holding in The Star Sydney property
* Not directly comparable to the pcp given COVID-related operating restrictions in both periods
** 2H FY2019 not impacted by COVID-19
*** Operating expenses $798m ex JobKeeper wage subsidy of $58m
**** Net of $7m SaaS adjustment

                                                                                                                                                                 4
OVERVIEW
TRADING UPDATE
  EARLY 1H FY2022     ♦ Early 1H FY2022 trading has been negatively impacted by property shutdowns and operating
TRADING IMPACTED BY     restrictions upon re-opening of the Queensland properties
       COVID          ♦ When open in Queensland, the revenue trends were broadly consistent with 1H FY2021
                      ♦ Restrictions may change over the remainder of the year, which could materially impact
                        revenues and earnings

                      ♦ The Star Sydney closed on 25 June 2021 and remains shut
PROPERTY CLOSURES     ♦ The Queensland properties were shut from 30 June 2021 for 3-4 days and re-opened with
                        operating restrictions in place, including 1 person per 4m2, the mandatory wearing of masks
                        and patrons had to be seated while eating or drinking
                      ♦ The Queensland properties were again shut down from 31 July 2021 for a period of 8 days

EMPLOYEE SUPPORT      ♦ The Star has supported staff through these shutdown periods, paying all staff through to 8
  AND MITIGATION        August 2021 and has subsequently provided access to hardship payments
     EFFORTS          ♦ With these hardship payments, The Star Sydney has weekly staff costs of ~$3.5m (including
                        corporate allocation), down from ~$6m (prior to 8 August)
                      ♦ Board and executive management have also taken fixed pay reductions

                                                                                                                 5
OVERVIEW
IMPROVING REVENUE TRENDS AS RESTRICTIONS EASE
                POSITIVE REVENUE         ♦ EGM revenue returned to growth on pre-COVID levels during 2H FY2021
   1                 TRENDS              ♦ Table games revenue improved but was still below pre-COVID levels

           QUEENSLAND STRONG             ♦ Gold Coast domestic gaming revenue up 18% in 2H FY2021 vs 2H FY2019
   2                                     ♦ Brisbane domestic gaming revenue up 3% in 2H FY2021 vs 2H FY2019 despite the
           GROWTH IN 2H FY2021
                                           shutdowns in January, March and June

                                         ♦ Sydney EGM revenue returned to growth from March vs 2H FY2019
   3            SYDNEY IMPROVING
                                         ♦ Table games improved post restrictions easing but were below pre-COVID levels

                                               GAMING REVENUE RELATIVE TO FY2019
                                                   (60 DAY ROLLING AVERAGE)
EGM vs FY2019   ……   TG vs FY2019   ……
                   GROUP                                     SYDNEY                                 QUEENSLAND
  40%                                         40%                                       40%

  20%                                         20%                                       20%

   0%                                          0%                                        0%

 -20%                                         -20%                                      -20%

 -40%                                         -40%                                      -40%

 -60%                                         -60%                                      -60%

                                                                                                                           6
OVERVIEW
SYDNEY
IMPACTED BY ♦ Earnings significantly impacted by the more onerous COVID-19 related operating restrictions
OPERATING (300 patron cap per area, no co-mingling, caps on table and machine utilisation, masks) and
RESTRICTIONS the property shutdown at the end of the period
♦ Domestic EBITDA down 16% on pcp
♦ Restrictions began to ease through the March quarter
♦ Sydney EGM revenue returned to growth from March vs 2H FY2019
♦ Table games improved post restrictions easing but have not yet reached pre-COVID levels
♦ Costs well-managed with operating expenses down 17% on pcp to $409m
STRONG PERFORMANCE
♦ Domestic EBITDA margin declined from 27.5% to 25.5%
ON COSTS
♦ Performance of the enlarged and expanded Sovereign PGR has been positive (revenue up
NEW INITIATIVES 6% on Sovereign 1.5) despite capacity being restricted for the majority of the period
♦ The refurbished Oasis Room opened during the period
♦ New Italian restaurant, ‘Cucina Porto’, was rated #1 best restaurant in Sydney by Tripadvisor
for the period 10 January 2021 to 7 June 2021
♦ Hosting the award winning musical ‘Hamilton’
Normalised FY2021
$m vs pcp
Gross Revenue 832 (30%)
Domestic 813 (10%)
VIP 12 (96%)
EBITDA 204 (26%)
EBIT 84 (48%)
Normalised results reflect the underlying performance of the business as they remove the inherent win rate volatility of the International VIP Rebate business. Normalised results are adjusted using an average win rate of 1.35% on actual turnover, taxes and
revenue share commissions and are before significant items. EBITDA is before equity accounted investments profits/ losses and significant items.
7OVERVIEW
SYDNEY OPERATING CONDITIONS
12-Feb-2021 29-Mar-2021 18-Jun-2021
♦ Capacity ♦ Restrictions ♦ Masks strongly encouraged in
03-Jan-2021
increased to lifted at all public indoor venues
♦ Masks mandatory
01-Jul-2020 10,000 patrons entertainment 20-Jun-2021
in gaming areas
♦ Capacity increased to 5,000 (1 person per venues, ♦ Masks mandatory in indoor
23-Mar-2020 patrons (1 person per 4m2 2m2 rule) nightclubs hospitality venues
♦ Property closed rule) 21-Dec-2020 ♦ Masks no 23-Jun-2021
♦ 3 patrons per table ♦ Revert to 24-Jul- longer 17-May-2021 ♦ 1 person per 4m2, no drinking
♦ Every second gaming machine 2020 restrictions mandatory ♦ Restrictions while standing
switched off eased
MAR-20 AUGUST-21
24-Jul-2020 07-Dec-2020 29-Jan-2021 17-Mar-2021
♦ Capacity reduced to ♦ Capacity increased to 10,000 ♦ Removal of 300 ♦ Removal of 6-May-2021
01-Jun-2020 1,800 patrons (300 patrons (1 person per 2m2 rule) patron cap per no-standing ♦ Masks
♦ Re-opened to 500 patron cap per area) ♦ 5 patrons per table area rule mandatory in
loyalty members ♦ No co-mingling and ♦ All gaming machines available ♦ Revert to 01-Jul- ♦ Gaming table gaming 26-Jun-2021
seating rules also ♦ Removal of 300 patron cap per 2020 conditions, capacity areas, no- ♦ Property Closed
introduced area and no co-mingling rules masks mandatory increased to 7 standing rule
SYDNEY DAILY GAMING VISITATION MARCH 2020 TO NOW
Property Property
Closed Closed
24/03
03/04
13/04
23/04
03/05
13/05
23/05
02/06
12/06
22/06
02/07
12/07
22/07
01/08
11/08
21/08
31/08
10/09
20/09
30/09
10/10
20/10
30/10
09/11
19/11
29/11
09/12
19/12
29/12
08/01
18/01
28/01
07/02
17/02
27/02
09/03
19/03
29/03
08/04
18/04
28/04
08/05
18/05
28/05
07/06
17/06
27/06
07/07
17/07
27/07
06/08
16/08
8OVERVIEW
GOLD COAST
♦ Gold Coast normalised EBITDA up 17% to $112m, margins improved from 18.0% to 29.2%
RECORD DOMESTIC
♦ Domestic EBITDA up 86% on pcp to $115m, margins improved from 20.4% to 30.2%
EARNINGS
♦ Very strong performance in the second half upon re-opening of domestic borders
♦ Domestic gaming revenue in the second half up 18% on 2H FY2019
SLOTS AND TABLES
♦ Slots revenue up 22% vs 2H FY2019
VERY STRONG
♦ Table revenue up 13% vs 2H FY2019
♦ Costs well-managed through the period, down 10% on pcp
♦ Dorsett Hotel and Residences scheduled to complete in 2H FY2022
COSTS AND CAPEX
WELL-MANAGED ♦ Commenced construction of Tower 2 in conjunction with our JV partners - $400m 63-storey
mixed use tower, incorporating a 210 room 5-star hotel. Scheduled to open in FY2025
♦ On track to exceed investment return hurdles despite absence of VIP business
Normalised FY2021
$m vs pcp
Gross Revenue 382 (28%)
Domestic 379 26%
VIP 1 (100%)
EBITDA 112 17%
EBIT 50 38%
Normalised results reflect the underlying performance of the business as they remove the inherent win rate volatility of the International VIP Rebate business. Normalised results are adjusted using an average win rate of 1.35% on actual turnover, taxes and
revenue share commissions and are before significant items. EBITDA is before equity accounted investments profits/ losses and significant items.
9OVERVIEW
BRISBANE
♦ Brisbane normalised EBITDA up 100% on pcp to $114m, revenue up 34%
RECORD PERFORMANCE
♦ EBITDA margin improved from 22.1% to 32.9%
DESPITE SHUTDOWNS
♦ Domestic gaming revenue in the second half up 3% on 2H FY2019 despite shutdowns in
SLOTS UP 4% ON 2H January (3 days), March (3 days) and June (2 days)
FY2019, TABLES +2%
♦ Slots revenue up 4% on 2H FY2019
♦ Table revenue up 2% on 2H FY2019
♦ QWB construction costs under lump sum contract now in excess of 90%
COSTS AND CAPEX
♦ QWB is now anticipated to open progressively in 1H CY2023, previously from late CY2022
WELL-MANAGED
♦ We are pro-actively expanding the table games market in anticipation of a much larger
footprint with the opening of QWB
♦ Opened a new bar/restaurant, ‘Will & Flow’, during the period - acknowledged as “one of the
most beautiful new bars to open in Australia and NZ in 2020” by Urban List
Normalised FY2021
$m vs pcp
Gross Revenue 348 34%
Domestic 346 38%
VIP 0 (96%)
EBITDA 114 100%
EBIT 86 192%
Normalised results reflect the underlying performance of the business as they remove the inherent win rate volatility of the International VIP Rebate business. Normalised results are adjusted using an average win rate of 1.35% on actual turnover, taxes and
revenue share commissions and are before significant items. EBITDA is before equity accounted investments profits/ losses and significant items.
10OVERVIEW
QUEENSLAND OPERATING CONDITIONS
17-Nov-2020 11-Jan-2021 22-Jan-2021 29-Mar-2021 29-Jun-2021 02-Jul-2021 08-Aug-2021
♦ Capacity increased ♦ Treasury Brisbane re- ♦ Revert to 1 ♦ Treasury Brisbane ♦ Brisbane-1 ♦ Gold Coast-1 person per 4m2, ♦ Brisbane and
to ~5,000 patrons (1 opened to ~2,500 patrons person per closed for 3 days, person per mandatory mask wearing, patrons Gold Coast-1
person per 2m2 rule) (1 person per 4m2 rule) 2m2 rule in restrictions 14 4m2, to be seated while eating/drinking person per 4m2,
at both properties ♦ 7 patrons per table Brisbane days mandatory 02-Jul-2021 mandatory mask
♦ 7 patrons per table ♦ All gaming machines ♦ Masks no ♦ Restrictions - mask wearing, ♦ Brisbane-1 person per 4m2, wearing, patrons
♦ All gaming available longer masks mandatory, patrons to be mandatory mask wearing, patrons to be seated
23-Mar-2020 machines available ♦ Masks mandatory mandatory seating rule seated while to be seated while eating/drinking while
♦ Properties ♦ Seating rule ♦ Reinstatement of seating eating/drinking eating/drinking
closed removed rule
MAR-20 AUGUST-21
03-Jul-2020 30-Jun-2021
♦ Properties re-opened to ♦ The Star Gold
~2,500 patrons (1 person per 01-Dec-2020 22-Dec-2020 08-Jan-2021 01-Feb-2021 01-Apr-2021 Coast closed 23-Jul-2021 31-Jul-2021
4m2 rule) ♦ Queensland ♦ Queensland ♦ Treasury ♦ Queensland ♦ Gold Coast 14-day for 3 days ♦ Brisbane ♦ Brisbane
♦ 4 patrons per table border re- - Greater Brisbane - Greater restrictions - masks ♦ Treasury and Gold and Gold
♦ Gaming machines switched on opened, Sydney closed for Sydney mandatory, seating rule Brisbane Coast – 3 Coast
but social distancing required benefiting the border 3 days border re- closed for 4 per 4m2 closed for
♦ Border closed Gold Coast closed opened days rule 8 days
GOLD COAST DAILY GAMING VISITATION MARCH 2020 TO NOW BRISBANE DAILY GAMING VISITATION MARCH 2020 TO NOW
Property Closed Property Closed
Property Property
Closed Closed
01/03
16/03
31/03
15/04
30/04
15/05
30/05
14/06
29/06
14/07
29/07
13/08
28/08
12/09
27/09
12/10
27/10
11/11
26/11
11/12
26/12
10/01
25/01
09/02
24/02
11/03
26/03
10/04
25/04
10/05
25/05
09/06
24/06
09/07
24/07
08/08
01/03
16/03
31/03
15/04
30/04
15/05
30/05
14/06
29/06
14/07
29/07
13/08
28/08
12/09
27/09
12/10
27/10
11/11
26/11
11/12
26/12
10/01
25/01
09/02
24/02
11/03
26/03
10/04
25/04
10/05
25/05
09/06
24/06
09/07
24/07
08/08
11THE STAR ENTERTAINMENT GROUP
AGENDA
1. OVERVIEW
2. FINANCIALS
3. PRIORITIES
4. Q&A
12FINANCIALS
GROUP OVERVIEW
♦ Operating expenses down 11% on pcp to $740m
OPERATING COSTS
♦ JobKeeper wage subsidy of $58m booked in 1H FY2021*
WELL-MANAGED
♦ $50m fixed cost reduction program progressed with the full run-rate to be realised in FY2022,
assuming more normal operating conditions
♦ $51.5m in net significant items were largely restructuring related**
♦ Net debt reduced by $211m during the period
BALANCE SHEET
♦ Net leverage declined to 2.7x (Net Debt/Normalised EBITDA)
POSITION IMPROVED
♦ Substantial liquidity on hand – $492m
♦ Capex down 63% on the prior period to $89m***, below guidance and well below D&A of
CAPEX DOWN $211m
SIGNIFICANTLY
♦ JV equity contributions $118m in FY2021 with QWB and Gold Coast Tower 1 equity
contributions now complete
♦ VIP asset sales in FY2021, additional jet to be sold in FY2022
ASSET SALES
♦ In due diligence for the sale of an interest in the Treasury Brisbane buildings, targeting a sale
PROGRESSING
agreement in 1H FY2022
♦ Initiated a formal process for the sale and leaseback (or similar transaction) of a minority
holding in The Star Sydney property
* The Star received $88m relating to the Jul-Dec 20 period with $30m flowing directly to employees stood down or on reduced hours
** Refer to Note A7 of the Financial Report for a reconciliation of significant items
*** Net of $7m SaaS adjustment
13FINANCIALS
EBITDA BRIDGE
$m
FY2020 International FY2020 Sydney Queensland Sydney Queensland FY2021 International FY2021
Statutory VIP Rebate Normalised Domestic Domestic International International Normalised VIP Rebate Statutory
EBITDA* Business EBITDA* EBITDA EBITDA VIP Rebate VIP Rebate EBITDA* Business EBITDA*
Normalisation EBITDA EBITDA Normalisation
Impact Impact
Normalised results reflect the underlying performance of the business as they remove the inherent win rate volatility of the International VIP Rebate business. Normalised results are adjusted using an average win rate of 1.35% on actual turnover, taxes and
revenue share commissions and are before significant items.
* Excluding equity accounted investments profits/ losses and significant items.
14FINANCIALS
CAPEX
GROUP CAPEX IS DOWN ♦ The Group is coming off a period of heavy investment, delivered on time and on budget
MATERIALLY FROM ♦ FY2021 group capex down 63% to $89m*, below guidance and well below D&A of $211m
PRIOR YEARS ♦ FY2022 expected capex remains $125-150m, FY2023 guidance is ~$175m
♦ FY2022 expected D&A expense of ~$205m
♦ Expected net funding costs $55-60m in FY2022
GROUP CAPEX ($M)
D&A
Historical capex
500 477 Forecast capex
420
400
306 320
300
226 206 225 211 205
187
200 164 164 165
146
202** 125-150
100 89
111
0
FY14 FY15 FY16 FY17 FY18 FY19 FY20 FY21 FY22 F
♦ JV equity contributions of $118m in FY2021, representing final equity contributions for
JV CONTRIBUTIONS ARE Queen’s Wharf Brisbane and Gold Coast Tower 1
ALSO REDUCING
♦ FY2022 JV equity contributions of ~$35m, primarily relating to Gold Coast Tower 2
* Net of $7m SaaS adjustment.
** Comparatives have been restated due to a change in accounting policy.
15FINANCIALS
ASSET SALES
♦ The Group has been pursuing a strategy of releasing capital from non-core or low-yielding
RATIONALE assets and to re-invest the proceeds in higher growth and more productive areas
♦ Assets that meet this criteria include VIP related assets, car parks, hotels, retail and
property more generally
♦ Assets currently in active processes include VIP assets, the Treasury buildings in Brisbane
and The Star Sydney property
♦ Some VIP assets were sold in FY2021, including a jet and a boat, realising ~$35m
VIP ASSET SALES ♦ An additional jet is targeted to be sold in FY2022
♦ In due diligence for the sale and partial leaseback of the Treasury Brisbane buildings
TREASURY BUILDINGS ♦ The Treasury buildings comprise four assets including the Treasury Casino building, the
Treasury Hotel building, the former State Library building, and Queens Gardens Car Park
♦ Expected sale price of ~$250m
♦ Targeting a sale agreement in FY2022
♦ The Star sees potential to unlock value from our property assets from a sale and leaseback
SYDNEY PROPERTY or similar transaction
♦ Formal process for the sale and leaseback (or similar transaction) of The Star Sydney
property has been initiated
♦ The Star is proposing to retain significant ownership and alignment via a >50% interest
♦ The Gold Coast and QWB properties could be added at a future point in time
♦ The sale of The Star Sydney Car Park concession remains under consideration
16FINANCIALS
PROFIT AND LOSS – FY2021
FY2021 FY2020* FY2021 FY2020*
$M fav/(unfav) 2
2
2 2
2
fav/(unfav)
STATUTORY STATUTORY NORMALISED NORMALISED
Domestic Gaming revenue 1,363.8 1,243.9 9.6% 1,363.8 1,243.9 9.6%
International VIP Rebate 9.5 285.2 (96.7%) 13.5 509.2 (97.3%)
Non-gaming and other revenue 183.8 219.8 (16.4%) 183.8 219.8 (16.4%)
Gross Revenue 1 1,557.1 1,748.9 (11.0%) 1,561.1 1,972.9 (20.9%)
Player rebates and commissions ( 11.7) ( 261.9) 95.5% ( 12.4) ( 315.8) 96.1%
Net Revenue 1,545.4 1,487.0 3.9% 1,548.7 1,657.1 (6.5%)
Gaming taxes and levies ( 378.7) ( 377.3) (0.4%) ( 379.0) ( 399.8) 5.2%
Operating expenditure ( 740.0) ( 827.7) 10.6% ( 740.0) ( 827.7) 10.6%
EBITDA (before significant items) 3 426.7 282.0 51.3% 429.7 429.6 0.0%
D&A ( 210.5) ( 202.2) (4.1%) ( 210.5) ( 202.2) (4.1%)
EBIT (before significant items) 216.2 79.8 170.9% 219.2 227.4 (3.6%)
Share of net profit/(loss) of associate ( 4.4) ( 2.1) (109.5%) ( 4.4) ( 2.1) (109.5%)
Statutory EBIT (before significant items) 211.8 77.7 172.6% 214.8 225.3 (4.7%)
Net funding costs ( 54.3) ( 48.4) (12.2%) ( 54.3) ( 48.4) (12.2%)
Tax (before significant items) 4 ( 48.1) ( 9.7) (395.8%) ( 44.1) ( 54.1) 18.5%
NPAT (before significant items) 109.4 19.6 458.3% 116.4 122.8 (5.2%)
Significant items (after tax)5 ( 51.5) ( 114.4) 55.0%
Statutory NPAT 57.9 ( 94.8) N.M.
Earnings per share (cents) 6.1 ( 10.3) N.M.
Total Dividends per share (cents) 0.0 10.5 (100.0%)
Notes
1. Revenue is shown as the net gaming win, but gross of rebates and commissions paid to players and third parties
2. Normalised results reflect the underlying performance of the business as they remove the inherent win rate volatility of the International Rebate business. Normalised results are adjusted using an average win rate of 1.35% on actual turnover, taxes and
revenue share commissions and before significant items
3. Statutory EBITDA of $426.7m is before equity accounted investments and before significant items
4. Tax before significant items is calculated for actual and normalised purposes based on the statutory effective tax rate paid in the period
5. Refer to Note A7 of the Financial Report for a reconciliation of significant items
* Comparatives have been restated due to a change in accounting policy.
17FINANCIALS
BALANCE SHEET
$M JUN 2021
JUN 2020 ♦ Capital programs progressed
RESTATED*
ASSETS • Property, plant and equipment declined, reflecting capex
Current Assets
Cash and cash equivalents 67.9 66.1
below depreciation
Trade and other receivables 23.3 99.5
• Investment in associates and joint venture entities
Inventories 15.2 16.4
Income tax receivable - 7.5 increased, relating to QWB and the Gold Coast JV towers
Derivative financial instruments 2.9 65.8
progressing as planned
Assets held for sale 30.6 37.2
Other assets 23.8 59.9 ♦ COVID-19 property and border closures impacted business
Total current assets 163.7 352.4
Non current assets
volumes and VIP debt provisioning
Property, plant and equipment
Intangible assets
2,695.4
1,831.4
2,837.0
1,839.8
• Cash, trade and other payables declined, reflecting lower
Derivative financial instruments 13.9 67.9 business volumes
Investment in associate and joint venture entities 631.7 525.1
Other assets 37.2 40.4 • Trade and other receivables declined, reflecting IRB
Total Non current assets 5,209.6 5,310.2 collections in the period and lower VIP business volumes
TOTAL ASSETS 5,373.3 5,662.6
LIABILITIES ♦ The movement in derivative financial instruments reflects the
Current liabilities movement in interest rates and currency exchanges
Trade and other payables 181.8 324.0
Interest bearing liabilities 6.8 162.9 ♦ Net debt of $1,171m* (excluding lease liabilities of $50m), was
Income tax payable 1.0 -
Provisions 78.6 70.9
down $211m vs 30 June 2020, reflecting free cashflow
Derivative financial instruments 5.6 7.7 generation
Other liabilities 23.5 21.5
Total current liabilities 297.3 587.0 ♦ Cash conversion was 123% (FY2020 102%) reflecting the
Non current liabilities
Interest bearing liabilities 1,285.9 1,462.1
unwinding of prepayments (e.g. NSW gaming tax), IRB
Deferred tax liabilities 138.3 134.3 collections, and JobKeeper wage subsidy
Provisions 10.0 10.5
Derivative financial instruments 8.0 7.0
Other liabilities 9.8 5.9
Total non current liabilities 1,452.0 1,619.8
TOTAL LIABILITIES 1,749.3 2,206.8
NET ASSETS 3,624.0 3,455.8
EQUITY
Share capital 3,159.3 3,050.8
Retained earnings 459.5 401.6
Reserves 5.2 3.4
TOTAL EQUITY 3,624.0 3,455.8
* Comparatives have been restated due to a change in accounting policy.
18THE STAR ENTERTAINMENT GROUP
AGENDA
1. OVERVIEW
2. FINANCIALS
3. PRIORITIES
4. Q&A
19PRIORITIES
OUR PRIORITIES FOR THE YEAR AHEAD
♦ Post COVID-19 earnings recovery
1 OPERATIONS
♦ Operating expenses – maintain cost benefits from recently executed programs
LEGAL, REGULATORY ♦ AUSTRAC – enforcement investigation – notified in June 2021
2 AND COMPLIANCE • The Star will co-operate fully with AUSTRAC in relation to its requests for
information and documents and the investigation
• The Star continues to enhance its AML capabilities inc. leveraging technology
♦ International VIP business repositioning - reduced the fixed cost base, will focus
on IPM and Direct Premium customers when borders re-open
♦ Cashless gaming - advance roadmap towards cashless gaming alternatives
♦ Sydney slots – proposal to government to increase the number of slots at Sydney
♦ Business Interruption insurance – unsuccessful at first instance, considering appeal
options
♦ Crown Resorts – withdrew the non-binding indicative merger proposal with Crown
3 STRATEGIC INITIATIVES Resorts but remain open to exploring value-enhancing opportunities with Crown
♦ Asset sales
• In due diligence for the sale of an interest in the Treasury Brisbane buildings
• Initiated a formal process for the sale and leaseback (or similar transaction) of
The Star Sydney property
♦ Gold Coast – continue to progress the construction of the Dorsett Hotel and
4 MAJOR PROJECTS Residences and JV Tower 2
♦ QWB – continue to progress the construction of the QWB IRD
♦ Sydney – advance masterplan for development opportunities
20PRIORITIES
STRATEGY REMAINS UNCHANGED
OUR STRATEGY OUR DELIVERY
♦ Privileged assets and
partnerships
1 Deliver on the operating model
♦ Signature gaming ♦ Leverage improved capabilities – loyalty, gaming,
♦ Premium hotel rooms, risk, RG, AML/CTF
Food and Beverage, ♦ Retain the efficiencies from cost management
retail (on site and
programs
proximate)
♦ Accelerate the growth of our hospitality, tourism and
Investments entertainment businesses
2 Deliver on the investment strategy
♦ JV capital light approach to major projects
♦ Locals – multiple
frequency/ occasions, ♦ QWB/The Star Brisbane
Visitation high recommendation ♦ Gold Coast Masterplan
♦ Visitors/ VIP – low
♦ Our Queensland properties are well-positioned for
frequency, high spend
the Brisbane Olympics in 2032
♦ Sydney – advance masterplan for additional mixed
use development opportunities
Earnings
3 Enhance shareholder returns
♦ Execute a capital efficient model
♦ Enhanced ROA and
shareholder returns ♦ Progress capital recycling options
♦ Supports further • asset sales
investment • property monetisation opportunities
♦ Pursue a partnership approach to investments
21PRIORITIES
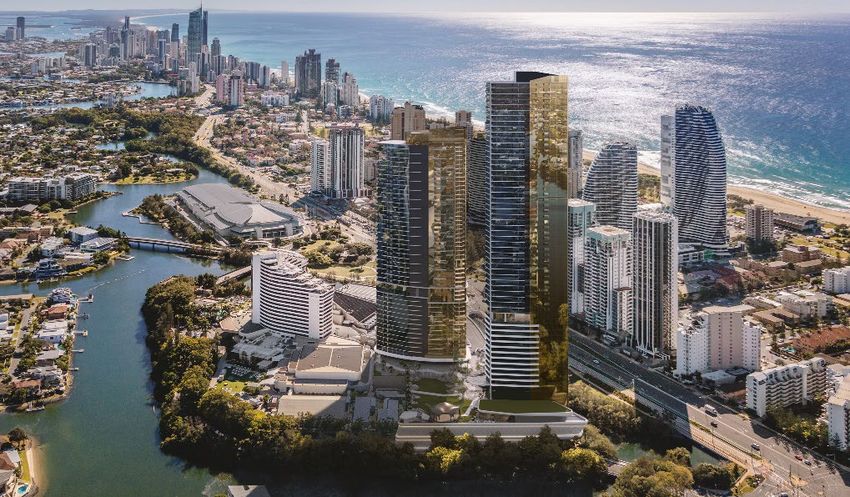
GOLD COAST
CONSTRUCTION ON TIME AND BUDGET
♦ Construction of the Dorsett Hotel and Residences (Tower 1)
• Remains on time and budget for completion in FY2022
• Equity contributions have been completed and $260m
in project level debt facilities are in place
• Sold 93% of the apartments
♦ Commenced construction of Tower 2 in February 2021 in
conjunction with our JV partners - a $400m 63-storey mixed
use tower, incorporating a 210 room 5-star hotel
• Pre-sold in excess of 80% of the apartments in Tower
THE STAR GOLD COAST – TOWERS 1 AND 2
2
• Capital works will be funded by partner contributions,
existing and new debt facilities, and free cash flow
generation
• The Star’s equity contribution for Tower 2 ~$50m over
3 years
KEY DATES*
Feb-21 ♦ Commence construction of Tower 2
FY2022 ♦ Opening of the Dorsett Hotel and Residences, retail and
associated facilities
FY2025 ♦ Complete construction of Tower 2 DORSETT HOTEL AND RESIDENCES – AUGUST 2021
* Subject to planning and other approvals
22PRIORITIES
QUEEN’S WHARF BRISBANE
WORKS ON BUDGET
♦ 60% of gross floor area (GFA) has been built
♦ Fit-out of the gaming floor has commenced
♦ In excess of 90% of project costs are now under lump sum
terms
♦ Signed a lease agreement with DFS, part of the LVMH
Group, for ~6,000 sqm of luxury retail floorspace
♦ Anticipating a progressive opening of the Integrated Resort
Development (IRD) in 1H CY2023, previously from late
CY2022
VIEW FROM 1 WILLIAM STREET – AUGUST 2021
♦ Equity contributions ceased in 2H FY2021, project debt
drawdowns have commenced
♦ A $1.6bn project level debt facility was established in May
2020 (5½ year term)
KEY DATES*
CY2021 ♦ Commence the internal fit-out of the Integrated Resort
1H CY2023 ♦ Opening of the first stage of the Integrated Resort
2023 ♦ Continuation of phased opening of the Integrated Resort VIEW FROM SOUTH BANK – AUGUST 2021
* Subject to planning and other approvals
23THE STAR ENTERTAINMENT GROUP
AGENDA
1. OVERVIEW
2. FINANCIALS
3. PRIORITIES
4. Q&A
24APPENDIX
KEY SUSTAINABILITY METRICS
SUSTAINABILITY A GLOBAL SUSTAINABILITY LEADER
AND ENVIRONMENTAL Casino and Gaming Category 2016 – 2021
Winner International Gaming
>80% portfolio with environmental
‘Sustainable Business – Operator’
ratings, 90% by 2022
Award
Green Star Performance Rating Aligning our reporting with the United
achieved – The Star Sydney and The Nations Sustainable Development
Star Gold Coast Goals
Net zero carbon emissions by 2030 for wholly owned and operated assets
30% reduction by 2023 in carbon emissions and water consumption intensity
Founding member of
Second TCFD aligned Climate-
Sydney’s Sustainable
related Disclosures report released
Destination Partnership
Food take-away packaging now 98%
compostable, targeting 100% overtime
SOCIAL AND COMMUNITY $470M 62 TONNES 32 TONNES
Government taxes and levies of food (183,000 meals) donated of furniture, equipment uniforms
paid in FY2019 * (OzHarvest, Foodbank) to date and hotel linen donated to
charities to date
Signatory to the Global Compact First Modern Slavery and Human
Network Australia Trafficking Statement released
* Unaudited
25APPENDIX
STATUTORY RESULTS – FY2021
SYDNEY GOLD COAST BRISBANE TOTAL
$M
FY2021 FY2020* fav/(unfav) FY2021 FY2020* fav/(unfav) FY2021 FY2020* fav/(unfav) FY2021 FY2020* fav/(unfav)
Slots 277.7 258.7 7.3% 203.9 132.6 53.8% 173.8 118.0 47.3% 655.4 509.3 28.7%
Domestic Tables 458.1 526.3 (13.0%) 100.8 93.0 8.4% 149.5 115.3 29.7% 708.4 734.6 (3.6%)
Non-gaming 77.1 115.7 (33.4%) 74.5 76.6 (2.7%) 22.8 17.3 31.8% 174.4 209.6 (16.8%)
Total Domestic 812.9 900.7 (9.7%) 379.2 302.2 25.5% 346.1 250.6 38.1% 1,538.2 1,453.5 5.8%
International VIP Rebate 8.5 261.6 (96.8%) 0.6 23.6 (97.5%) 0.4 0.0 100.0% 9.5 285.2 (96.7%)
Other revenue 6.8 7.2 (5.6%) 1.5 2.0 (25.0%) 1.1 1.0 10.0% 9.4 10.2 (7.8%)
Total Gross Revenue 828.2 1,169.5 (29.2%) 381.3 327.8 16.3% 347.6 251.6 38.2% 1,557.1 1,748.9 (11.0%)
Player rebates and commissions ( 11.5) ( 147.2) 92.2% ( 0.9) ( 110.5) 99.2% 0.7 ( 4.2) 116.7% ( 11.7) ( 261.9) 95.5%
Net Revenue 816.7 1,022.3 (20.1%) 380.4 217.3 75.1% 348.3 247.4 40.8% 1,545.4 1,487.0 3.9%
Gaming taxes and levies ( 208.1) ( 248.3) 16.2% ( 80.7) ( 62.6) (28.9%) ( 89.9) ( 66.4) (35.4%) ( 378.7) ( 377.3) (0.4%)
Operating expenses ( 408.8) ( 489.9) 16.6% ( 187.2) ( 208.6) 10.3% ( 144.0) ( 129.2) (11.5%) ( 740.0) ( 827.7) 10.6%
EBITDA (before significant items) 199.8 284.1 (29.7%) 112.5 ( 53.9) 308.7% 114.4 51.8 120.8% 426.7 282.0 51.3%
D&A ( 119.9) ( 114.7) (4.5%) ( 61.9) ( 59.7) (3.7%) ( 28.7) ( 27.8) (3.2%) ( 210.5) ( 202.2) (4.1%)
EBIT (before significant items) 79.9 169.4 (52.8%) 50.6 ( 113.6) 144.5% 85.7 24.0 257.1% 216.2 79.8 170.9%
Share of net profit/(loss) of associate ( 4.4) ( 2.1) (109.5%)
Significant Items ( 77.7) ( 159.0) 51.1%
Net funding costs ( 54.3) ( 48.4) (12.2%)
Tax ( 21.9) 34.9 (162.8%)
Statutory NPAT 57.9 ( 94.8) N.M.
EBITDA/Revenue % 24.1% 24.3% 29.5% (16.4%) 32.9% 20.6% 27.4% 16.1%
International VIP Rebate Front Money $m 51.6 2,161.4 (97.6%) 5.5 728.3 (99.2%) 1.4 49.5 (97.2%) 58.5 2,939.2 (98.0%)
International VIP Rebate Turnover $m 905.3 20,303.5 (95.6%) 76.8 16,872.2 (99.6%) 21.7 509.5 (95.7%) 1,003.8 37,685.2 (97.3%)
International VIP Rebate Win rate 0.94% 1.29% 0.78% 0.14% 1.84% 0.00% 0.95% 0.76%
Net Revenue is after player rebates and commissions. Complimentary revenue is included within domestic gaming revenue. International VIP Rebate includes IPM. Refer to Note A7 of the Financial Report for a reconciliation of significant items.
* Comparatives have been restated due to a change in accounting policy.
26APPENDIX
NORMALISED RESULTS – FY2021
SYDNEY GOLD COAST BRISBANE TOTAL
$M
FY2021 FY2020* fav/(unfav) FY2021 FY2020* fav/(unfav) FY2021 FY2020* fav/(unfav) FY2021 FY2020* fav/(unfav)
Slots 277.7 258.7 7.3% 203.9 132.6 53.8% 173.8 118.0 47.3% 655.4 509.3 28.7%
Domestic Tables 458.1 526.3 (13.0%) 100.8 93.0 8.4% 149.5 115.3 29.7% 708.4 734.6 (3.6%)
Non-gaming 77.1 115.7 (33.4%) 74.5 76.6 (2.7%) 22.8 17.3 31.8% 174.4 209.6 (16.8%)
Total Domestic 812.9 900.7 (9.7%) 379.2 302.2 25.5% 346.1 250.6 38.1% 1,538.2 1,453.5 5.8%
International VIP Rebate 12.2 274.6 (95.6%) 1.0 227.7 (99.6%) 0.3 6.9 (95.7%) 13.5 509.2 (97.3%)
Other revenue 6.8 7.2 (5.6%) 1.5 2.0 (25.0%) 1.1 1.0 10.0% 9.4 10.2 (7.8%)
Total Gross Revenue 831.9 1,182.5 (29.6%) 381.7 531.9 (28.2%) 347.5 258.5 34.4% 1,561.1 1,972.9 (20.9%)
Player rebates and commissions ( 11.0) ( 166.1) 93.4% ( 2.1) ( 144.6) 98.5% 0.7 ( 5.1) 113.7% ( 12.4) ( 315.8) 96.1%
Net Revenue 820.9 1,016.4 (19.2%) 379.6 387.3 (2.0%) 348.2 253.4 37.4% 1,548.7 1,657.1 (6.5%)
Gaming taxes and levies ( 208.3) ( 249.6) 16.5% ( 80.8) ( 83.1) 2.8% ( 89.9) ( 67.1) (34.0%) ( 379.0) ( 399.8) 5.2%
Operating expenses ( 408.8) ( 489.9) 16.6% ( 187.2) ( 208.6) 10.3% ( 144.0) ( 129.2) (11.5%) ( 740.0) ( 827.7) 10.6%
Normalised EBITDA 203.8 276.9 (26.4%) 111.6 95.6 16.7% 114.3 57.1 100.2% 429.7 429.6 0.0%
D&A ( 119.9) ( 114.7) (4.5%) ( 61.9) ( 59.7) (3.7%) ( 28.7) ( 27.8) (3.2%) ( 210.5) ( 202.2) (4.1%)
Normalised EBIT 83.9 162.2 (48.3%) 49.7 35.9 38.4% 85.6 29.3 192.2% 219.2 227.4 (3.6%)
Share of net profit/(loss) of associate ( 4.4) ( 2.1) (109.5%)
Normalised EBIT after share of net profit
214.8 225.3 (4.7%)
of associate
Net funding costs ( 54.3) ( 48.4) (12.2%)
Tax ( 44.1) ( 54.1) 18.5%
Normalised NPAT 116.4 122.8 (5.2%)
EBITDA/Revenue % 24.5% 23.4% 29.2% 18.0% 32.9% 22.1% 27.5% 21.8%
International VIP Rebate Front Money $m 51.6 2,161.4 (97.6%) 5.5 728.3 (99.2%) 1.4 49.5 (97.2%) 58.5 2,939.2 (98.0%)
International VIP Rebate Turnover $m 905.3 20,303.5 (95.6%) 76.8 16,872.2 (99.6%) 21.7 509.5 (95.7%) 1,003.8 37,685.2 (97.3%)
International VIP Rebate Win rate 1.35% 1.35% 1.35% 1.35% 1.35% 1.35% 1.35% 1.35%
Normalised results reflect the underlying performance of the business as they remove the inherent win rate volatility of the International VIP Rebate business. Normalised results are adjusted using an average win rate of 1.35% on actual turnover, taxes and
revenue share commissions and are before significant items.
Net Revenue is after player rebates and commissions. Complimentary revenue is included within domestic gaming revenue. International VIP Rebate includes IPM. Refer to Note A7 of the Financial Report for a reconciliation of significant items.
* Comparatives have been restated due to a change in accounting policy.
27APPENDIX
OPERATIONAL METRICS
SYDNEY GOLD COAST BRISBANE
OPERATIONAL METRICS
FY2021 FY2020 fav/(unfav) FY2021 FY2020 fav/(unfav) FY2021 FY2020 fav/(unfav)
Slots
Revenue ($m) 278 259 7.3% 204 133 53.8% 174 118 47.3%
NMR/machine/day 539 477 13.1% 373 245 52.3% 322 206 56.3%
MTGMs
Revenue ($m) 76 73 3.6% 15 11 32.7% 25 18 41.4%
NMR/machine/day 368 341 8.0% 209 169 23.7% 361 244 48.2%
Domestic Tables (excl. MTGMs)
Revenue ($m) 382 453 (15.6%) 86 82 5.0% 125 97 28.1%
Hold % 21% 20% 20.3% 21.5% 20.8% 19.5%
VIP Rebate (Actual)
Front Money ($m) 52 2,161 (97.6%) 6 728 (99.2%) 1 50 (97.2%)
Turnover ($m) 905 20,304 (95.6%) 77 16,872 (99.6%) 22 510 (95.7%)
Turns 17.5 9.4 86.8% 13.8 23.2 (40.6%) 15.8 10.3 53.8%
Win Rate 0.94% 1.29% 0.78% 0.14% 1.84% 0.02%
Hotels
Occupancy 67% 76% (8.7%) 77% 78% (0.9%) 88% 83% 4.7%
Cash Revenue ($m) 22 25 (10.7%) 24 22 9.0% 4 2 53.2%
Restaurants
Cash Revenue ($m) 30 39 (24.2%) 28 28 (1.2%) 8 7 18.1%
Gross Revenue ($m) 46 59 (21.3%) 41 40 1.7% 17 15 11.4%
Bars
Cash Revenue ($m) 11 28 (58.8%) 16 12 30.9% 10 7 47.0%
Gross Revenue ($m) 63 74 (14.5%) 38 32 19.2% 25 19 32.2%
Statutory EBITDA/Revenue % 24.1% 24.3% 29.5% (16.4%) 32.9% 20.6%
Normalised EBITDA/Revenue % 24.5% 23.4% 29.2% 18.0% 32.9% 22.1%
Employee Costs/Statutory Revenue % 24.7% 21.0% 26.0% 31.4% 23.1% 27.0%
Employee Costs/Normalised Revenue % 24.6% 20.8% 26.0% 19.4% 23.1% 26.2%
Normalised results reflect the underlying performance of the business as they remove the inherent win rate volatility of the International VIP Rebate business. Normalised results are adjusted using an average win rate of 1.35% on actual turnover, taxes and
revenue share commissions and are before significant items.
28APPENDIX
CASH CONVERSION AND FUNDING
CATEGORY Jun-20
Jun-21
$M RESTATED*
CASH CONVERSION Cash flows from operating activities before interest and income tax
Net cash receipts from customers (inclusive of GST) 1,689.7 1,640.1
Payments to suppliers and employees (inclusive of GST) (995.9) (1,106.9)
Payment of government levies, gaming taxes and GST (335.2) (418.7)
Receipt of government grants 112.7 40.0
Net cash inflows from operating activities before interest and income tax 471.3 154.5
Profit before net finance costs and income tax* 138.4 (77.5)
Add back depreciation, amortisation and impairment 243.8 229.5
EBITDA* 382.2 152.0
Cash conversion 123% 102%
Note: Including share of net profit/(loss) of associate and significant items. Significant items in FY2021 include impairment expense.
* Comparatives have been restated due to a change in accounting policy.
DEBT MATURITY PROFILE AT 30 JUNE 2021 ($M)
FUNDING
800
As at 30 June 2021: 600
257
♦ $1.6bn total facilities
♦ 3.7 years weighted 400
average debt maturity of
committed debt facilities 508
200
♦ $0.5bn total available cash 5 100 369
and facilities 31 145
75
31
44 64 9
0
FY22 FY23 FY24 FY25 FY26 FY27 FY28
USPP Drawn Bank Debt Undrawn Bank Debt
29APPENDIX
INTERNATIONAL VIP REBATE RECEIVABLES*
INTERNATIONAL VIP REBATE BUSINESS 30 DAYS - ♦ 30 June 2021 past due not
0 - 30 DAYS 1 - 3 YEARS 3 YEARS + TOTAL
RECEIVABLES (BEFORE PROVISIONS) 1 YEAR impaired receivables down on 30
June 2020 reflecting significantly
June 2021 ($m)
reduced VIP business activity
Not yet due 1.8 - - - 1.8 (border closures) and collections
Past due not impaired - 0.1 3.8 0.3 4.2
Considered impaired - - 38.1 - 38.1
Total 1.8 0.1 41.9 0.3 44.1
December 2020 ($m)
Not yet due 0.9 - - - 0.9
Past due not impaired - 8.4 13.8 - 22.2
Considered impaired - 18.3 18.7 - 37.0
Total 0.9 26.7 32.5 - 60.1
June 2020 ($m)
Not yet due 0.5 - - - 0.5
Past due not impaired - 46.7 6.1 - 52.8
Considered impaired - 64.3 39.3 - 103.6
Total 0.5 111.0 45.4 - 156.9
* Excludes non-gaming debtors
30APPENDIX
GLOSSARY
TERM DEFINITION
AML/CTF Anti-Money Laundering and Counter-Terrorism Financing
AUSTRAC Australian Transaction Reports and Analysis Centre
CAGR Compound Annual Growth Rate
Capital expenditure Unless otherwise stated, capital expenditure is presented on an accruals basis and excludes investments in associates and
(capex) equity acquisitions
D&A Depreciation and Amortisation
Domestic Tables Domestic Tables includes main gaming floor table games, private gaming room table games, domestic rebate table games
EGM Electronic gaming machine – includes slots and MTGMs
F&B Restaurants and bars
IPM International Premium Mass, the international loyalty program business (non-commission)
JV Joint venture
IRD Integrated Resort Development
MGF Main gaming floor
MTGM Multi-terminal gaming machine or electronic table game
NMR Net revenue per machine
Normalised/ Normalised results reflect the underlying performance of the business as they remove the inherent win rate volatility of the
normalisation International VIP Rebate business. Normalised results are adjusted using an average win rate of 1.35% of actual turnover,
taxes and commissions
pcp Prior comparable period
PGR Private gaming room
QWB Queen’s Wharf Brisbane
RG Responsible Gambling
ROA Return on Assets
Significant items Items of income or expense which are, either individually or in aggregate, material to The Star Entertainment Group and:
♦ Outside the ordinary course of business (e.g. the cost of significant reorganisations or restructuring); or
♦ Part of the ordinary activities of the business but unusual due to their size and nature (e.g. impairment of assets)
USPP US Private Placement debt
VIP International VIP Rebate business
yoy Year on year
31You can also read