THE STATE OF EDUCATION - A REPORT ON TRENDS AND ISSUES CHARACTERISING THE EDUCATION SECTOR OVER THE LAST 5 YEARS (2014 - 2019) - Equal ...
←
→
Page content transcription
If your browser does not render page correctly, please read the page content below
A REPORT ON
  THE STATE OF
   EDUCATION
      TRENDS AND ISSUES CHARACTERISING THE
EDUCATION SECTOR OVER THE LAST 5 YEARS (2014 - 2019)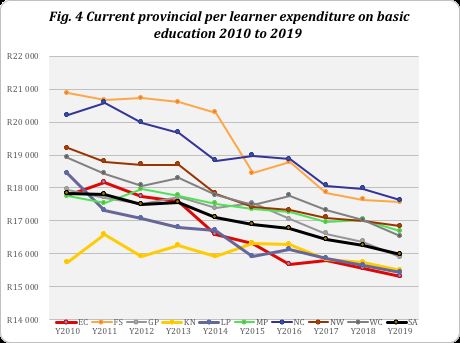
A R E P O R T O N T H E S TA T E O F E D U C AT I O N

                                      CONTENTS

            List of abbreviations							4

            A.      EXECUTIVE SUMMARY						5

            B.      INTRODUCTION – IN A “VICIOUS CYCLE”				8

                    Background and context					8

                    Purpose of the report						9

                    Scope and structure of the report				            10

            C.      FUNDING TRENDS AND RELATED ISSUES CHARACTERISING 11
                    THE CURRENT STATE OF BASIC EDUCATION
            D.      SCHOOL INFRASTRUCTURE AND SANITATION			21

            E.      EARLY CHILDHOOD DEVELOPMENT AND EARLY LEARNING   27

            F.      LEARNER TRANSPORT PROVISIONING				35

            G.      EXCLUSIONARY ADMISSION PRACTICES AND THE 		      40
                    FAILURE TO REASONABLY ACCOMMODATE

            H.      CONCLUSION							48

            Annexe A								49

            Endnotes 								50

                                              2
A R E P O R T O N T H E S TA T E O F E D U C AT I O N
This report was published by the Equal Education Law Centre (“EELC”).
The EELC is a public interest law centre with activist lawyers and researchers working
to advance the struggle for quality and equality in education through legal research,
advocacy and strategic litigation. The EELC works closely with Equal Education (“EE”),
a membership-based, democratic movement of learners, parents, teachers and com-
munity members also striving for quality and equality in education in South Africa. The
information in this report therefore draws on both the independent work of the EELC
and the work it does in collaboration with EE.
This report was drafted by Rubeena Parker with Demichelle Petherbridge and Astrid
Coombes.
ACKNOWLEDGMENTS:
We would like to thank members of the EELC team for their input, as well as Sibabalwe
Gcilitshana of Equal Education for her assistance with budget analysis.
Date: May 2019
3A R E P O R T O N T H E S TA T E O F E D U C AT I O N
LIST OF ABBREVIATIONS
APP Annual Performance Plan
ASIDI Accelerated Schools Infrastructure Delivery Initiative
DBE Department of Basic Education
DoT Department of Transport
DPME Department of Planning, Monitoring and Evaluation
DSD Department of Social Development
ECD Early Childhood Development
ECDoE Eastern Cape Department of Education
EE Equal Education
EELC Equal Education Law Centre
EGRS Early Grade Reading Study
EIG Education Infrastructure Grant
FFC Financial Fiscal Commission
MTBPS Medium-Term Budget Policy Statement
MTEF Medium-Term Expenditure Framework
MTSF Medium-Term Strategic Framework: 2014-2019
NDP National Development Plan 2030: Our future – make it work
NNSSF National Norms and Standards for School Funding
PED Provincial Education Department
PPN Post Provisioning Norms
SAFE Sanitation Appropriate for Education
SAHRC South African Human Rights Commission
SASA The South African Schools Act, 84 of 1996
SDGs Strategic Development Goals
SGB School Governing Body
SIBG School Infrastructure Backlogs Grant
4A R E P O R T O N T H E S TA T E O F E D U C AT I O N
A. EXECUTIVE SUMMARY
T
he Department of Basic Education This report presents additional, and in some
(“DBE”) has translated the National De- cases, alternative critical information on the na-
velopment Plan 2030: Our future-make ture and extent of the DBE’s progress. Through
it work (“NDP”) Chapter 9 education goals into an assessment of certain key targets in educa-
Action Plans, Strategic Plans and Annual Perfor- tion over the last five years, the report reveals
mance Plans. In its last published Annual Report critical system failures relating to data collection,
for 2017/2018 (“Annual Report”), the DBE indi- the coordination and cooperation of govern-
cates it has made “substantial progress” towards ment departments and other stakeholders, as
achieving learning and education-related targets well as severe legislative and policy gaps and im-
as set out in the NDP. plementation barriers.
As the current electoral term draws to an end, it REGRESSIVE FUNDING TRENDS
is important to critically assess the DBE’s over-
all progress, not only as last reported, but also It is widely acknowledged that progressive
more broadly over the last five years. funding and efficient spending are needed to
improve basic education outcomes.
The report reveals critical system failures However, South Africa has in fact shown regres-
relating to data collection, the coordi- sive funding trends over the period under re-
view. Amongst others, the DBE budget has de-
nation and cooperation of government
creased in real terms over the past 5 years and
departments and other stakeholders, as per learner spending has declined by about 8%
well as severe legislative and policy gaps since 2010.
and implementation barriers.
The report recommends that along with an in-
crease in the allocations to basic education, allo-
cations to basic education must keep pace both
The Equal Education Law Centre (“EELC”) set out with other components of the Learning and Cul-
to conduct research across some of its central ture budget and with inflation. In addition, the
thematic areas to assess the performance of report recommends that provincial Education
the DBE and other government departments in Departments (“PEDs”) must prioritise per-learn-
advancing the right to basic education. Whilst er allocations made to no-fee schools so that
acknowledging that there has been some pro- national minimum thresholds for all quintiles
gress made by the DBE during this time, the re- are met. Further, the report recommends that
port questions whether such progress has been norms and standards for resourcing must be
“substantial” in the light of regressive education adopted and must provide for all costs associat-
funding, chronic underspending and a consist- ed with education.
ent failure to meet set targets.
5A R E P O R T O N T H E S TA T E O F E D U C AT I O N
SCHOOL INFRASTRUCTURE AND These developments must be assessed against
SANITATION the existing challenges to the provision of quality
ECD services, namely the inability of government
Despite the fact that government has continued departments to effectively co-ordinate responsi-
to assert that school infrastructure is a key priority bilities, the lack of reliable and credible data and
and that “significant strides in addressing school insufficient funding and capacity at national, pro-
infrastructure challenges” have been made, there vincial and local government levels. Large-scale
has in fact been declining funding commitments capacity building is required in national and pro-
to school infrastructure and a substantial fail- vincial departments and districts for the effective
ure to implement binding legislative norms and provision of ECD services.
standards over the past five years.
Current trends in funding and expenditure of the
Budget and expenditure trends are indicative of ECD conditional grant pose an additional chal-
government compromising the implementation lenge. The ECD conditional grant is effectively pro-
of Infrastructure Norms and Standards. The re- jected to remain almost stagnant over the next
port analyses the decline in allocations to both three years.
the School Infrastructure Backlogs Grant (“SIBG”)
and the Education Infrastructure Grant (“EIG”), as In order to realise the proposed ECD develop-
well as chronic underspending by PEDs. ments, it is imperative that National Treasury en-
sure that the ECD conditional grant is increased
In addition, the report notes with concern the in order to accommodate the expansion of ECD
need for the courts to direct government to carry services.
out its constitutional obligations. Over the period
under review, the failure to ensure effective provi- LEARNER TRANSPORT PROVISIONING
sioning of school infrastructure resulted in various
litigious challenges with the courts ultimately or- Notwithstanding the introduction of the Nation-
dering government to improve legal frameworks al Learner Transport Policy (“Learner Transport
and ensure infrastructure delivery. Policy”) published by the Department of Trans-
port (“DoT”) in 2015, provisioning of learner trans-
The report recommends more effective oversight port is only superficially addressed in the DBE’s
mechanisms over provincial infrastructure spend- Annual Report and is not adequately catered for
ing as well as coherent implementation plans to in government plans.
ensure that significant failures over the previous
period are remedied. Challenges to implementing the Learner Trans-
port Policy include the lack of seamless stake-
EARLY CHILDHOOD DEVELOPMENT AND holder co-operation and co-ordination, failure to
EARLY READING adequately monitor implementation, the absence
of a clear funding mechanism, and the lack of re-
The President recently announced the introduc- liable data. The failure to accommodate learners
tion of two years of compulsory Early Childhood with disabilities is also of significant concern.
Development (“ECD”), a migration of ECD servic- Recommendations for improving scholar trans-
es from the Department of Social Development port provisioning include, amongst others, a pro-
(“DSD”) to the DBE, and an expansion of the Early posal that guidance be issued on the uniform
Grade Reading Study (“EGRS”). implementation of the principles contained in
6A R E P O R T O N T H E S TA T E O F E D U C AT I O N
the Learner Transport Policy and that deliberate In light of the various regressive trends and imple-
steps must be taken to clarify the exact roles and mentation gaps identified, the report argues that
responsibilities of the DBE, the DoT and other key changes need to be made to the manner in
stakeholders. which the DBE, as well as PEDs, other departments
and National Treasury prioritise, plan and budget.
EXCLUSIONARY ADMISSION PRACTICES
AND THE FAILURE TO REASONABLY Education funding which maintains positive
ACCOMMODATE growth while keeping up with inflation is needed,
alongside the eradication of factors which result
The report highlights, with concern, a failure to ac- in irregular and wasteful expenditure, as well as
knowledge or address current practices in schools underspending of allocated funds.
which exclude learners at the point of admission. The urgent implementation, according to uncom-
promising timelines, of existing laws (and where
Examples of these exclusionary practices include required, the urgent clarification of or passing
the refusal to admit undocumented learners, of binding laws) which provide for education re-
the difficulty parents face in finding appropriate sourcing, the delivery of infrastructure, and the
placement and support for children experiencing removal of all barriers to education and learning
barriers to learning, and the failure of schools to is necessary.
help parents when applying for fee exemptions.
The capacitation of district officials, School Gov-
The practice of denying learners with disabilities erning Bodies (“SGBs”), teachers, practitioners
admission to ordinary schools instead of providing and other relevant role-players is required in or-
learners with reasonable accommodation has been der to facilitate implementation of binding laws.
highlighted as an ongoing and concerning practice.
Additionally, critical system changes must be put
The report makes specific recommendations in in place, including more effective and accurate
relation to each of these issues, including the re- data collection, consistent and meaningful coor-
view, clarification and monitoring of existing leg- dination between government departments and
islation and policies in order to effectively ensure other key stakeholders, and clarification of the
that all learners’ rights to inclusion in education roles and responsibilities of each department in
are protected. delivering key outcomes.
GENERAL RECOMMENDATIONS As a new electoral cycle commences and a new
administration gets ready to take the reins, this
report offers a point of critical engagement with
The report offers a point of critical the challenges encountered by the outgoing ad-
engagement with the challenges encoun- ministration and some proposals to reverse the
regressive trends which have characterised the
tered by the outgoing administration and
last five years.
some proposals to reverse the regressive
trends which have characterised the last
five years.
7A R E P O R T O N T H E S TA T E O F E D U C AT I O N
B. INTRODUCTION – IN A “VICIOUS CYCLE”
BACKGROUND AND CONTEXT1
1. The NDP was adopted by the South African government in 2012.2 It was intended to provide a
broad strategic framework to guide key choices and actions,including the planning, prioritisation,
budgeting and actions of government departments.
2. In the education context, the NDP sets the goals and targets for the education sector. These
are translated into medium-term actions in the Medium-Term Strategic Framework: 2014-2019
(“MTSF”), and, more specifically, in the DBE strategic plans. These include its Action Plan to 2019:
Towards the Realisation of Schooling 2030 (“Action Plan to 2019”),3 its Five-Year Strategic Plans,
and its Annual Performance Plan(s) (“APP”).
3. These strategic plans are in turn linked to budget plans, including annual national and provincial
budgets and the Medium-Term Expenditure Framework (“MTEF”), to ensure that key objectives
and priorities are budgeted for and achieved.
In the current context, the ‘virtuous cycle’ and social cohesion envisaged by the NDP,
driven by ‘strong leadership’, ‘effective government’ and ‘active citizenry’, could well be
replaced by a ‘vicious cycle’ and social division, marked instead by ‘weak leadership’,
‘ineffective government’ and an ‘inactive citizenry’.
4. Speaking at the Vision 2030 Summit in June 2018, the head of the secretariat of the National Planning
Commission of South Africa, Tshediso Matona, said about the NDP and South Africa’s vision for 2030:
“The NDP is very ambitious given the current context. We cannot achieve this if we stay along this path that
we’re on”.4 Matona echoed the concerns of the Department of Planning, Monitoring and Evaluation
(“DPME”) in its Mandate Paper 2018, which stated that “if the current trends continue, it is unlikely that
South Africa will achieve the NDP goals [,] progress and transformational targets set out”.5
5. Commenting on the NDP two months after the Vision 2030 Summit in August 2018, researcher,
writer and strategist Dino Galetti looked more closely at the “current context” and “current trends”
facing South Africa. He noted that on the current path such context and trends might not only
make NDP goals unachievable by 2030, but that the NDP itself may eventually be rendered whol-
ly ineffective and irrelevant.6 It is a context in which, Galetti writes, the “virtuous cycle” and social
cohesion envisaged by the NDP, driven by “strong leadership”, “effective government” and “active
citizenry”, could well be replaced by a “vicious cycle” and social division, marked instead by “weak
leadership”, “ineffective government” and an “inactive citizenry”.7
6. Matona’s statements and Galletti’s arguments are deeply concerning, but not surprising, as the
NDP warns of its own fallibility, stating that achieving the capabilities required for development “is
not automatic, nor will they emerge if the country continues on its present trajectory”.8
8A R E P O R T O N T H E S TA T E O F E D U C AT I O N
7. Needless to say, the failure to achieve NDP goals (and/or the redundancy of the NDP in its entirety)
will ultimately and invariably result in the setting of equally unachievable, illusive sectoral targets
and the failure to fund and execute them adequately. This is already evident in the education
sector where, at least in the last five years, among other things: (i) there has been consistent un-
derspending by government departments, as well as a failure to meet planned targets;9 (ii) basic
education spending in particular is being outpaced by spending on higher education and training
programmes;10 and (iii) the real growth rate of the overall education budget (national and provin-
cial) has been stagnating, and in the case of the national DBE, has in fact been shrinking in real
terms over the last four years.11
8. In assessing the performance of the DBE and other government departments in advancing the
right to basic education, it is important to examine the goals set by these departments, to deter-
mine whether these goals are being achieved within set timeframes, and examine the reasons for
the failure to meet set goals and targets. Further, it is important to understand how the budgets to
achieve these goals are formulated, allocated and ultimately spent. Without this, we are unlikely to
change paths and to emerge from the “vicious cycle” in which we find ourselves.
PURPOSE OF THE REPORT
9. This report seeks to analyse the performance of the education sector in the light of NDP goals. This
includes assessing education priorities and the budgets allocated and spent to fulfil them. In doing
so, we refer, among others, to the DBE’s last published Annual Report for 2017/2018 (“Annual Re-
port”),12 which looks at the DBE’s performance relative to the targets set in its APP.13
10. In the Annual Report, the Minister of Basic Education, AM Motshekga (the “Minister”), commented
on the DBE’s progress towards achieving effective learning and the education-related outcomes
articulated in the MTSF. She noted that:
substantial progress has been made towards achieving the set targets”14
11. The Minister maps the DBE’s progress by identifying key advances made during the Annual Report
reporting period. In particular, she lists the various ongoing steps and initiatives taken to achieve
the Strategic Development Goals (“SDGs”);15 including, among others, government’s scholar trans-
port programme,16 the continued interdepartmental work conducted by the DBE with the DSD to
expand access to ECD services,17 and the continuous improvement in the quality of teaching and
learning through, among other things, the provision of adequate, quality infrastructure through
the Accelerated School Infrastructure Delivery Initiative (“ASIDI”) and the EIG programmes.18
12. As the MTSF’s 2019 planning horizon approaches and the current electoral term draws to an end,
it is especially important to critically assess the DBE’s overall progress, not only as last reported
but also more broadly over the last five years, and to consider whether or not its progress has in
fact been substantial.
9A R E P O R T O N T H E S TA T E O F E D U C AT I O N
13. This report therefore presents additional, and in some cases, alternative critical information on the
nature and extent of the DBE’s progress and seeks to assess the continuing challenges facing the
education sector and plans for achieving the NDP education-related outcomes. Such information
is presented in the light of current trends and issues in the education sector, including ineffec-
tive planning and implementation, and regressive budgeting over this period. Further, the report
makes recommendations to the DBE and other departments, including National Treasury, to ad-
dress some of these challenges and to effectively plan and prioritise for the forthcoming strategic
planning cycle.
SCOPE AND STRUCTURE OF THE REPORT
14. At the outset, we note some of the current funding trends and indicators characterising the pres-
ent state of basic education. These include budget and spending trends, the failure to adopt norms
and standards for adequate resourcing and funding, and revision of the equitable share formula.
15. We then examine certain central thematic areas in the light of
The report focuses on
these trends and indicators. The scope of the report is limited to
four thematic areas,
consideration of specific issues in relation to which the EELC does
including:
a significant amount of work, often in collaboration with EE. These
issues include:
School infrastructure
15.1 school infrastructure and sanitation – in particular, imple- and sanitation;
mentation implementation of the Infrastructure Norms and
Standards; Early childhood
development;
15.2 early childhood development – in particular, the potential
consequences of the migration of ECD services from DSD to Learner transport
DBE and the introduction of two compulsory years of ECD; provisioning; and
15.3 learner transport provisioning – in particular, the challeng- Exclusionary admission
practices.
es relating to implementing the Learner Transport Policy; and
15.4 exclusionary admission practices – in particular, challenges with implementing the Regu-
lations Relating to the Exemption of Parents from Payment of School Fees in Public Schools,
included in the South African Schools Act 84 of 1996 (“SASA”) (“Fee Exemption Regulations”),
and cases relating to undocumented learners and the reasonable accommodation of those
experiencing barriers to learning.
16. Finally, we present our key recommendations relating to each thematic issue.
10A R E P O R T O N T H E S TA T E O F E D U C AT I O N
C. FUNDING TRENDS AND RELATED ISSUES CHARACTERISING
THE CURRENT STATE OF BASIC EDUCATION
17. This section looks briefly at the performance of the basic educa-
tion sector, and more particularly the DBE, by considering certain Progressive funding and
key indicators. It also examines the size and composition of the efficient spending are
basic education budget and considers the effectiveness, equity needed to improve basic
and adequacy of education spending in the last five years. education outcomes.
Despite this, South
18. Investment in basic education does not appear to have facilitated
Africa exhibits regres-
the implementation of minimum norms and standards, or even
sive funding trends over
to address legacy inequalities and resulting backlogs. This is ap-
the period under review:
parent in the fact that the majority of learners attending public
schools are failing to meet basic curriculum, literary and numera-
cy standards, while also being unable to access safe, sanitary and
dignified learning environments.
19. Research shows that Grade 4 learners in South Africa scored the TREND 1:
lowest of 50 countries participating in reading tests and that 78% Basic education as
of Grade 4 learners cannot read for meaning. Rural provinces a portion of the
consolidated budget is
are the worst affected, with 91% of Grade 4 learners in Limpopo,
declining.
85% of Grade 4 learners in the Eastern Cape and 83% of Grade
4 learners in Mpumalanga unable to read for meaning.19 At the TREND 2:
same time, there is a failure to implement norms and standards Increases in allocations
of school infrastructure, regulations on public school fee exemp- to PEDs do not
tions, or national and provincial policies for the provision of learn- necessarily translate
into better service
er transport.
delivery.
20. Progressive funding and efficient spending are needed to improve
these outcomes. Unfortunately, a closer look at the basic educa- TREND 3:
Allocations to DBE
tion budget shows that these elements are not in place.
are decreasing in
real terms.
TREND 1: TREND 4:
Allocations to DBE
Basic education as a portion of the and PEDs compared
consolidated budget is declining to actual expenditure
reveals patterns of
21. After debt servicing costs, education is often described as “the underspending.
fastest growing area of expenditure”.20 In the 2019 annual budget,
R1.24 trillion was allocated to Learning and Culture over the MTEF. TREND 5:
In 2019/20 in particular, R386.39 billion was allocated to Learning Per learner spending
has declined by about
and Culture, making up about 21,2% of the consolidated budget.21
8% since 2010.
Learning and Culture is therefore a clear government spending
priority.
11A R E P O R T O N T H E S TA T E O F E D U C AT I O N
22. Importantly, basic education makes up only one component of the Learning and Culture budget,
with ‘Post-school Education and Training’ and ‘Arts, Culture, Sport & Recreation’ making up the rest.
The basic education sector budget, which includes money allocated to DBE as well as transfers to
PED’s, makes up about 14.4% of the total 2019/20 consolidated budget.22 Basic education is often
signalled as being prioritised over other spending areas such as health and defence. However, as
Table 1 below illustrates, the share of consolidated expenditure allocated to the basic education
sector has declined from 15,40% in 2014/15 to 14,50% in 2021/22. Over the same period, the share
of health spending increased, while spending on social development remained relatively constant.
Table 1: Learning and culture versus basic education % of consolidated budget
2014/15 2015/16 2016/17 2017/18 2018/19 2019/20 2020/21 2021/22
Outcomes Revised Medium Term Estimates
Learning and Culture
Nominal budget
251,80 277 295,3 322,9 354,8 3864,4 415,2 442,6
(R in billions)
% of consolidated budget 20,49% 20,17% 20,42% 20,84% 21,31% 21,15% 21,30% 21,19%
Basic Education
Nominal budget
189,2 203 216,9 231,1 246,6 262,4 282,3 302,8
(R in billions)
% of consolidated budget 15,40% 14,78% 15,00% 14,91% 14,81% 14,36% 14,48% 14,50%
Source: 2019 Estimates of National Expenditure (Vote 14)
23. As Table 2 below reflects, the annual growth of the basic education sector budget has been far
outpaced in recent years, both in nominal and real terms, by the annual growth of post-school
education. Looking at the 2019/20 financial year alone, we see that the basic education budget
grew by 6.41% while the post-school or higher education budget grew by more than double that,
by 15.37% in nominal terms.23
24. Figure 1 below plots the annual nominal growth rate of the basic education budget relative to that
of post-school education and training. The disparity is considerable and suggests a direct trade-off
between the rapid growth of higher education and training spending and the slow (almost stag-
nant) growth of the basic education budget.
Table 2: Basic versus post-school education annual % change
2014/15 2015/16 2016/17 2017/18 2018/19 2019/20 2020/21 2021/22
Outcomes Revised Medium Term Estimates
Learning and Culture
Nominal budget
189,2 203 216,9 231,1 246,5 262,3 282,3 302,8
(R in billions)
Nominal annual % change 7,29% 6,85% 6,55% 6,66% 6,41% 7,62% 7,26%
Post-school education & training
Nominal budget
54,4 64,5 68,7 81,8 97,6 112,6 121,3 127,5
(R in billions)
Nominal annual % change 18,57% 6,51% 19,07% 19,32% 15,37% 7,73% 5,11% 24
Source: 2018 and 2019 Estimates of National Expenditure (Vote 14)
12A R E P O R T O N T H E S TA T E O F E D U C AT I O N
Fig.1 Basic versus post-school education annual nominal % change
25,0%
19,1%
20,0% 19,3%
18,6%
Percentage
15,4%
15,0%
Basic education
10,0% 7,7%
5,0% Post-school education &
6,5% 5,1%
training
0,0%
2015/16 2016/17 2017/18 2018/19 2019/20 2020/21 2021/22
TREND 2:
Increases in allocations to PEDs do not necessarily translate into better
service delivery
25. It is also important to note that basic education is a labour-intensive sector. The Post Provisioning
Norms (PPN)25 provide for 80% of provincial education budgets to be spent on teacher salaries,
with 20% left for non-personnel expenditure, which includes service delivery. While allocations to
PEDs appear to be increasing, this does not always translate into service delivery, as a large pro-
portion of this increase funds teacher compensation.26
26. If provinces fail to pay salaries, they often exceed the 80:20 ratio. As Figure 2 below shows for the
2016/17 financial year, compensation of employees comprised between 80 and 89 per cent of
provincial education budgets, encroaching on the 20% set aside for service delivery. Rising wage
bills put a strain on all provinces. The worst affected will be those with “less fiscal space to absorb
the increases”, such as Kwazulu-Natal.27 Unchecked growth in the wage bills of provincial education
departments puts a strain on the ability of these departments to facilitate equity and quality in
school education.28
13A R E P O R T O N T H E S TA T E O F E D U C AT I O N
Fig.2 Public ordinary school (Programme 2) expenditure versus portion spent on compensation 2016/17
40 000 000 Programme 2:
89%
Expenditure
82% Total Public ordinary
30 000 000 school expenditure
86% 85%
20 000 000
86% 87%
88% 86% Compensation of
10 000 000
87% employees for
0 Programme 2
KZN WC EC FS GP LMP MPL NC NW
Province
TREND 3:
Allocations to DBE are decreasing in real terms
27. Taking the budget of the DBE on its own, that is, after transfers to PEDs have been made, the
policy-making entity is left with only about 2.1% of the consolidated budget in 2018/19.29
28. Table 3 below shows that, while allocations to the DBE have increased year on year, the nomi-
nal rate of increase slowed by an average of about 4.7 percentage points between 2015/16 and
2019/20. Unsurprisingly, when inflation is taken into account, the DBE budget has in fact been
decreasing in real terms. This is also shown in Figure 3 below.
Table 3: DBE real and nominal allocations (2015/16 to 2019/20)
2015/16 2016/17 2017/18 2018/19 2019/20
Nominal appropriation
R21 286 R22 413 R22 993 R23 699 R24 504
(R in millions)
Annual nominal change (%) 8.1% 5.3% 2.6% 3.1% 3.4%
Real appropriation
R26 142 R25 896 R25 374 R24 900 R24 504
(R in millions)
Annual real change (%) 2.8% -0.9% -2.0% -1.9% -1.7%
Source: 2018 and 2019 Estimates of National Expenditure (Vote 14)
14A R E P O R T O N T H E S TA T E O F E D U C AT I O N
Fig. 3 DBE allocations and annual % real change
R26 500 4,0%
R26 000 2,8% 3,0%
R25 500 2,0%
1,0%
R Million
R25 000
0,0%
R24 500
-0,9% -0,2% -1,0%
-1,9% -1,6%
R24 000 -2,0%
R23 500 -3,0%
2015/16 2016/17 2017/18 2018/19 2019/20
Total DBE allocation (Real) Annual % change
TREND 4:
Allocations to DBE and PEDs compared to actual expenditure
reveals patterns of underspending
29. Table 4 below shows that negative deviations or underspending of the DBE increased from be-
tween 0.8 per cent in 2014/15 to 4.2 per cent in 2016/17.30 In 2013/14, the largest deviations were
recorded in the Planning, Information and Assessment programme due to underspending of the
SIBG and the EIG, liquidation of service contracts, and grant funding being withheld from provinces
for poor spending.31
Table 4: DBE real and nominal allocations (2015/16 to 2019/20)
2014/15 2015/16 2016/17 2017/18 2018/19
Nominal budget
R19 689 R21 286 R22 413 R22 993 R23 699
(R in millions)
Expenditure (R in millions) R19 528 R20 796 R21 476 R22 932 R23 686
Underspending variance
R161 R490,30 R937,40 R61,60 R12,80
(in millions)
Variance (%) 0.82% 2,30% 4,18% 0,27% 0,05%
Source: Estimates of National Expenditure (Vote 14)
30. In its Budget Brief for South Africa, UNICEF notes consistent underspending by PEDs, usually re-
sulting from cashflow challenges caused by, among other things, growing personnel budgets and
the unauthorised use of conditional grants to alleviate low cash resources.32 In 2013/14, the prov-
inces collectively underspent by 3.8%. The Free State PED underspent by close to 10% of its budget,
and Gauteng PED underspent its budget by 6.2%. 33
15A R E P O R T O N T H E S TA T E O F E D U C AT I O N
31. In the context of enabling an inclusive education system, a DBE report assessing the implemen-
tation of Education White Paper 6 on Inclusive Education (“White Paper 6”)34 noted that “given
the enormity of the support needs…spending is by far not enough” and budgets were “inconsistently
allocated and spent”, resulting in “a very poor situation, especially in the poorer provinces.” 35 In its con-
cluding observations on South Africa’s report, the United Nations Committee on the Rights of the
Child confirmed that comprehensive, transparent and equitable inclusive education budgets were
a necessary component of the right to basic education for children with disabilities.36
32. We acknowledge the progress made in securing a ring-fenced conditional grant for learners with
severe to profound intellectual disabilities (“PID conditional grant”), which is in its second year of
application. However, as the Financial Fiscal Commission (“FFC”) noted, apart from one province,
all other provinces had been underspending the PID conditional grant, with “average performance
of provinces at 67 percent in 2017/18”. The main reason for under-expenditure in some provinces
was the delay in the recruitment of required personnel.37
TREND 5:
Declining and inadequate learner allocations
Trend 5.1: Declining per learner allocations
33. Goal 23 of the Action Plan to 2019 is to “ensure that all schools are funded at least at the minimum per
learner levels determined nationally and that funds are utilised transparently and effectively”.38 Despite
this, we see diminishing funding for basic education, resulting in a growing shortfall in funding
both of individual schools and learners.
The decline in per learner funding and expenditure impacts the quality of education,
‘reversing all gains made in education’, and depriving learners of essential aspects of
the right to basic education.
34. Education researcher Nic Spaull identifies declining per-learner public expenditure as “one of the
underappreciated trends of the last seven years”.39 Spaull writes that per-learner spending has de-
clined by about 8% in real terms since 2010, if one takes into account such factors as a spike in
birth rates, an increase in public school enrolments, and above-inflation increases to teacher sala-
ries.4 This is despite information from National Treasury stating that basic education spending per
learner has simply plateaued since 2011/12. Figure 4 below depicts the decline in each province.
16A R E P O R T O N T H E S TA T E O F E D U C AT I O N
Fig. 4 Current provincial per learner expenditure on basic education 2010 to 2019
R22 000
R21 000
R20 000
R19 000
R18 000
R17 000
R16 000
R15 000
R14 000
Source: Taken from Spaull, N “Priorities for Education Reform in South Africa: A Report to President Ramaphosa & Minister 41Mboweni”, 2019.41
Trend 5.2: The failure to meet per learner allocation thresholds
35. In a recent meeting of the Portfolio Committee on Basic Education, on the question of implement-
ing the amended National Norms and Standards for School Funding (“NNSSF”),42 the Committee
noted that, while there was improvement in meeting minimum thresholds, budget cuts meant that
these thresholds were becoming “moving target[s], almost like a tantalising mirage”.43
36. The Committee further noted that the decline in per learner funding and expenditure impacted
the quality of education, “reversing all gains made in education”,44 and depriving learners of es-
sential aspects of the right to basic education. For example, as we discuss below, a great number
of learners continue to travel several kilometres to school every day, and the DBE claimed that
there were insufficient funds to transport these learners. Spaull cites further examples of how
discriminatory and regressive funding impacts the quality of education, noting that the average
Grade 4 class size increased from 40 in 2011 to 45 in 2016, with the largest increases occurring at
the poorest schools, and that international assessments showed no improvement in reading out-
comes across the country during this period.45
37. The NNSSF requires PEDs to classify their public, ordinary schools into five categories, or quintiles,
for the purposes of receiving state funding. Schools are ranked from quintile 1 to quintile 5, with
quintile 1 to 3 schools in the poorest communities, judged by the condition of the school and the
relative poverty of the community in which it is located.46
38. Quintiles 1 to 3 are declared ‘no-fee’ schools by the Minister. As such, these schools are prohibited
from charging school fees and are completely dependent on the minimum per learner subsidy
from government.
17A R E P O R T O N T H E S TA T E O F E D U C AT I O N
39. Every year, the DBE determines national targets that aim to guide PEDs in the way they should
fund learners attending schools in each quintile. The following per-learner thresholds were deter-
mined for the 2017/18 period:47
Table 5: 2017/18 per learner allocation thresholds quintile 1-5
Quintile 1 R1243
Quintile 2 R1243
Quintile 3 R1243
Quintile 4 R 623
Quintile 5 R 215
40. As Table 5 shows, according to the national targets for 2017/18, PEDs should have allocated almost
twice as much to each learner attending a quintile 1-3 school, relative to those attending quintile
4 schools. Similarly, learners attending quintile 1-3 schools should have received over five times
more than each learner at a quintile 5 school. 48
41. Notwithstanding these national targets, PEDs are empowered to determine their own levels of
spending, but, as reflected in Table 6 below, they do not always meet these national thresholds.
Table 6: 2017/18 actual per learner allocations quintile 1-5
Provincial Education Quintile 1-3 schools Quintile 4 schools Quintile 5 schools
Department
National Threshold R1243 R623 R215
EC R1177 R590 R204
FS R1243 R623 R240
GT R1243 R623 R623
KZN R955 R522 R179
LP R1241 R621 R205
MP R1059 R530 R183
NC R1177 R736 R346
NW R1243 R623 R215
WC R1243 R993 R369
Source: DBE Presentation to the Select Committee on Education and Recreation
42. In terms of actual per-learner allocations made by PEDs in 2017, the Eastern Cape, KwaZulu-Natal,
Limpopo, and Mpumalanga provinces allocated funds below the national threshold across all 5
quintiles. In addition, the Northern Cape province failed to meet the national target for quintile
1-3 schools.50
43. No-fee schools, especially in more rural provinces such as the Eastern Cape, Limpopo and KwaZu-
lu-Natal, are often severely under-resourced. Additional challenges include inappropriate or dete-
riorating infrastructure, and a lack of basic water and sanitation. Consequently, these schools need
targeted interventions, with additional funding to ensure that learners enjoy access to equitable
18A R E P O R T O N T H E S TA T E O F E D U C AT I O N
and quality education. Unfortunately, the DBE recently indicated that, in terms of the current budg-
etary constraints experienced by provinces, “most PEDs will probably not be able to find the additional
funding required within their existing budgets”. 51
Recommendations:
Allocations to basic education must keep pace with other components of the Learning and
Culture budget, and allocations to DBE must keep pace with inflation.
For per-learner allocations:
• The DBE, along with National Treasury, must conduct updated research into the causes, true
extent and real effects of the decline in per-learner expenditure.
• Funding should be increased, and any additional funds should be ring-fenced for specific
education outcomes interventions, for example, to improve reading
or mathematics. 52
• PEDs, particularly in rural provinces such as KwaZulu-Natal, Mpumalanga and Eastern Cape,
must prioritise the per-learner allocations made to no-fee schools so that national minimum
thresholds for all quintiles are met.
Failure to adopt norms and standards to enable adequate resourcing and funding
44. We note that government departments often publish guidelines rather than prescriptive, binding
norms and standards relating to resourcing and funding.
45. This can be seen, for example, where the National Strategy on Screening, Identification, Assess-
ment and Support (“SIAS”) policy provides for “the development of norms and standards for resourc-
ing an inclusive education and training system” which is “an immediate requirement for the successful
implementation of the policy.” 53 Despite this, the DBE announced in 2017 that the Council of Educa-
tion Ministers had considered the proposal to develop norms and standards, but had instead de-
cided to publish guidelines for comment, as opposed to binding norms and standards. The Annual
Report therefore notes that draft Guidelines on Resourcing of Inclusive Education were approved
by the Minister for public comment in February 2018.54
46. This is concerning, given that guidelines will not have sufficient weight to compel provinces to
resource inclusive education adequately. In addition to this, the funding model proposed in the
guidelines continues to incentivise special education over inclusive education.”55
Recommendation
• Norms and standards for resourcing inclusive education must be adopted and inclusive
education must be comprehensively funded to provide for all costs of education, such as
appropriate transport, assistive devices and learner teacher support materials.
19A R E P O R T O N T H E S TA T E O F E D U C AT I O N
Revision of the Equitable Share Formula
47. EE and EELC have advocated for reforms to the equitable share formula which determines how
national funds are allocated to provinces. In particular, as noted above in relation to funding and
spending trends and inadequate per learner allocations, there are concerns about underspending
in certain provinces and the failure to meet the NNSSF requirements for per-learner allocations.
Reforms to the equitable share formula are required in order to facilitate reversal of
regressive funding trends.
48. Accordingly, the EE and EELC made comprehensive presentations and submissions to the Standing
Committee on Appropriations, highlighting, among other things, the failure of the equitable share
formula to cater for the higher costs of delivering education in rural provinces. In 2019, EE acknowl-
edged National Treasury’s commitment to reviewing the formula, but requested time frames of the
review process to be made public. EE also acknowledged the change from the use of the Schools
Reality Survey to the Learner Unit Record Information Tracking System. EE and EELC have urged
that factors such as the historic underfunding of former ‘homelands’, smaller population densities,
historical infrastructural disadvantage, age demographics and the effects of rural poverty be taken
into account. 56
Recommendation
• In addition to specific recommendations on how the equitable formula can be remodelled,
EE and EELC encouraged National Treasury to publish the timelines by which this review
will take place, and to make clear the mechanisms for public participation. We reassert this
recommendation here.
20A R E P O R T O N T H E S TA T E O F E D U C AT I O N
D. SCHOOL INFRASTRUCTURE AND SANITATION
D.
49. School infrastructure is a clear priority outlined in South Africa’s key planning documents. The NDP
identifies the need to “ensure that all schools meet minimum standards for infrastructure and commit
to upgrading each school’s infrastructure to meet optimum standards”.57 This goal is reflected in the
DBE’s Action Plan to 2019, in which there is an undertaking to ensure that “the physical infrastruc-
ture and environment of every school inspire learners to want to come to school and learn, and teachers
to teach”. 58
50. The Annual Report also confirms school infrastructure as being at the forefront of the MTSF pri-
orities and states that the DBE has made “significant strides in addressing school infrastructure chal-
lenges”.59 The DBE illustrates its progress in the Annual Report with reference to what has been
achieved through ASIDI, namely the replacement of inappropriate structures (the completion of
12 schools in 2017/2018); and the provision of sanitation (a total of 54 Completion Certificates be-
tween 2015/16-2017/2018), water (a total of 75 Completion Certificate between 2013/14-2017/18),
and electricity (67 Completion Certificates between 2012/13-2017/18).60
51. The true significance of the progress made to address infrastructure challenges needs to be as-
sessed in the light of the current trends in the education sector. In particular, we must consider the
effect of cuts to school infrastructure funding, of underspending, of the consistent failure to meet
infrastructure targets, and of government’s seeming unwillingness to commit entirely to these tar-
gets.
Government’s commitment to the delivery of school infrastructure - Implementation of
the Infrastructure Norms and Standards
52. Perhaps the best indicator of the commitment to overcome infrastructure challenges is the extent
to which the Infrastructure Norms and Standards have been implemented.
53. For years members of EE campaigned, first for the adoption of the Infrastructure Norms and
Standards,61 and then for the state to comply with the deadlines contained therein, set by the
Minister. At the same time, attempts were made to persuade the Minister to close unconstitutional
loopholes and to fix the vague language contained in the Infrastructure Norms and Standards. In
particular, EE wished to engage the Minister on what it referred to as the “escape clause”.62 This
had the effect of relegating targets set out in the Infrastructure Norms and Standards to mere
aspirational goals, the achievement of which was subject to available resources and the buy-in
and co-operation of other government departments, with no guarantee that they would ever be
achieved. The “escape clause” stated:
the implementation of the norms and standards contained in these
regulations is, where applicable, subject to the resources and co-operation of
other government agencies and entities responsible for infrastructure in gen-
eral and the making available of such infrastructure”. 63
21A R E P O R T O N T H E S TA T E O F E D U C AT I O N
54. Attempts to engage the Minister failed, and during this time the first of the deadlines articulated
in the Infrastructure Norms and Standards, 29 November 2016, by which date no schools should
have been without water, electricity or sanitation, and schools built from mud, wood, asbestos or
metal should have been replaced by proper structures, had come and gone. Tragically, learners
continued to face indefensible conditions. Michael Komape died two months after the Infrastruc-
ture Norms and Standards were adopted, and Lumka Mkhethwa died more than a year after the
deadline had passed.
Our courts are being increasingly relied upon to direct government, rather than
government showing the requisite will to carry out its constitutional obligations.
55. In the Annual Report, the Minister highlights the need to strengthen processes and systems, re-
flecting on the death of learners as a tragedy which makes the DBE “more resolute to continue to
work jointly with PEDs” in addressing the backlogs and maintaining the existing infrastructure.64 We
are however concerned that this sentiment does not translate into a commitment to implement
the Infrastructure Norms and Standards with immediate effect and according to stipulated dead-
lines.
56. Compelled to approach the courts for a declaration that regulation 4(5)(a) is unconstitutional and
therefore unlawful and invalid, EE, represented by the EELC, was ultimately granted an order en-
tirely in its favour by the Bhisho High Court in Equal Education and Amatolaville Primary School v the
Minister of Basic Education and Others (“Bhisho High Court matter”).65 The Minister attempted
to argue, despite clear constitutional jurisprudence declaring otherwise, that the right to basic
education is progressively realisable.66 She also argued that her office was hamstrung by a lack of
adequate resources and reliance on other state organs.67
57. Acting Justice Msizi rejected each of these arguments, reasoning that the natural consequence
flowing from the stance of the Minister would be that government would never be called to ac-
count and that the public would never be able to ascertain “whether, when and what school infra-
structure to expect”, and that this was simply untenable.68 Msizi AJ also noted that the Minister’s
responses, as they related to her decision to prioritise schools made entirely of inappropriate ma-
terials over and above those made in part with inappropriate materials, failed to assist the Court
in determining what was in fact being ‘prioritised’.69
58. Despite the Bhisho High Court’s clear confirmation of the law regarding the immediate realisabil-
ity of the right to basic education as it has long been established by our Constitutional Court, the
DBE launched an application for leave to appeal the judgment. This was arguably another indica-
tion of its seeming unwillingness to accept its obligations and to work towards implementing the
Infrastructure Norms and Standards. Another three and a half months passed, further delaying
the delivery of infrastructure to schools. On 2 November 2018, the Constitutional Court issued an
order refusing to hear the appeal, saying that it had “no prospects of success”. Once again, our
courts had to be relied on to direct government, rather than government showing the requisite will
to carry out its constitutional obligations.
22A R E P O R T O N T H E S TA T E O F E D U C AT I O N
59. Also deeply concerning was the inadequate and unconstitutional plan which the national and Lim-
popo education departments submitted to the Polokwane High Court in response to an order of
the Court directing departments to fix inadequate and unsafe sanitation in the province.70 The
plan was severely lacking in detail,71 and, horrifyingly, only anticipated the commencement of work
to address sanitation infrastructure in 2026.72 This was notwithstanding the 29 November 2016
deadline which had already been passed, and the deadline of 29 November 2020 articulated in
regulation 4(1)(b)(ii) read with 4(3)(c) of the Infrastructure Norms and Standards, by which ade-
quate sanitation must be achieved, including proper, safe and sanitary latrines and a hygienic ratio
of learners to toilets at schools.73 The DBE, as well as, in this case, the Limpopo PED, therefore
appeared to be significantly off track when it came to meeting critical infrastructure deadlines and
implementing the Infrastructure Norms and Standards.
60. When the then Finance Minister Malusi Gigaba announced a R7.2 billion cut to the school infra-
structure budget in the 2018 National Budget over the MTEF,74 the Minister noted the “disastrous
effect” of this, and claimed that “achieving minimum norms and standards in government schools –
such as water, electricity and sanitation - will be set back by between five to 10 years as a result of the
budget cut”.75 The judgment of the Bhisho High Court made it clear that this reaction was unaccept-
able. Without losing sight of this judgment, we examine budget and expenditure trends which are
compromising the implementation of the Infrastructure Norms and Standards.
Budget, spending cuts and irregular expenditure compromise the delivery of
infrastructure and the ability to meet infrastructure targets
61. Two grants address school infrastructure challenges, namely the direct EIG, disbursed to and im-
plemented by provincial education departments, and the indirect SIBG, which funds the ASIDI and
is implemented by the DBE on behalf of PEDs, often through the contracting of non-governmental
contractors in charge of building school infrastructure (“implementing agents”).
School Infrastructure Backlogs Grant
62. In its submission to the Standing Committees on Appropriations and the Select Committee on
Appropriations on 6 March 2019, EE noted a clear downward trend in allocations to the school in-
frastructure grants. In the case of the SIBG in particular, EE raised the concern that this downward
trend continued between the 2018/19 and 2019/20 financial years, with a 15.2% decrease in the
allocation in real terms; that is, when taking inflation into account.76 This is particularly concerning
when government claims to be prioritising school infrastructure and when Infrastructure Norms
and Standards deadlines have passed. Unfortunately, declining infrastructure funding is not the
only challenge facing infrastructure delivery. Spending on and performance of the ASIDI are also
key factors.
63. The SIBG was meant to be a temporary high impact grant. Accordingly, one would expect allo-
cations and spending to reflect this.77 Instead, as the FFC pointed out in its briefing to the Port-
folio Committee on Basic Education on 9 October 2018, spending of the SIGB, “despite improving
in 2017/18, has been poor with an average spending performance of only 66% since 2011”.78 The FFC
went on to say that this, “coupled with the astonishing lack of progress on ASIDI targets…, cannot simply
be accepted by Parliament”.79
23A R E P O R T O N T H E S TA T E O F E D U C AT I O N
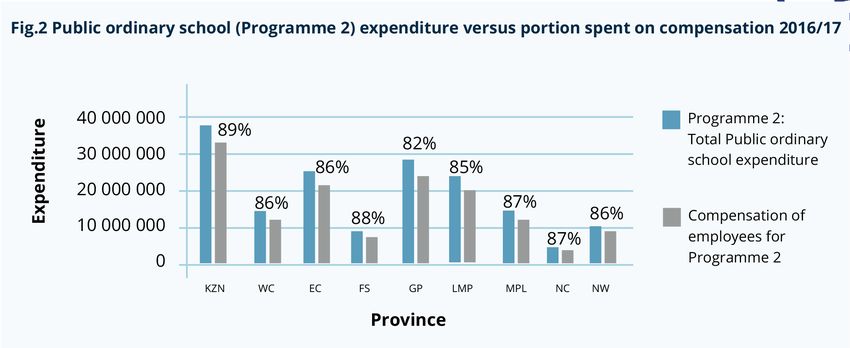
64. Figure 5 below illustrates the poor performance of the ASIDI between 2016/17 and 2018/19.80 It
also reflects how poor delivery ultimately results in the downward revision of targets in the follow-
ing year. This has the real effect of putting the Infrastructure Norms and Standards deadlines even
further out of reach. In fact, in the Annual Report, the DBE states that “target setting will be revised
to be more realistic with effect from the 2019/20 APP”.81
Fig. 5 ASIDI targets and performance
2018/19
Performance
Target
2016/17 2017/18
Performance
Target
Performance
Target
0 200 400 600 800 1200 1400 1600
Fig. 5 ASIDI targets and performance
2016/17 2017/18 2018/19
Target Performance Target Performance Target Performance
Schools Built 136 16 115 12 50 9
Sanitation 265 9 257 29 285 64
Water 459 10 344 43 325 64
Electricity 620 0 134 17
Source: DBE Annual Report 2017/2018; 2018 Adjusted Estimates of National Expenditure (Vote 14) and 2019 Estimate of Adjusted Expenditure (Vote 14)
65. The Annual Report lists various reasons for the failure to meet the above targets, including poorly
performing contractors or implementing agents. We are encouraged by the DBE’s work to contin-
uously engage with and monitor implementing agents and note the positive impact of this work
on the implementation and completion of some of the ASIDI projects.83 Still, as the FFC noted
during a briefing to the Portfolio Committee on Basic Education in October 2017, there needs to be
continued strengthening of oversight and control in the accountability chain to counter recurring
underspending.84
66. Moreover, the Annual Report also notes that “irregular expenditure”, or expenditure incurred in
contravention of legislation, amounted to almost R154.478 million in the 2017/18 financial year.
This, according to the Auditor General’s report, is mainly the result of supply chain processes not
being followed and the appointment of implementing agents outside of the legal requirements of
their appointment.85
24A R E P O R T O N T H E S TA T E O F E D U C AT I O N
Education Infrastructure Grant
67. Like the SIBG, allocations to the EIG have also decreased in real terms over the years between
2015/16 and 2019/20. Between 2017 and 2018 alone, seven (7) of the nine (9) provinces had their
budget allocations reduced.86
68. In the Bhisho High Court matter, EE made specific reference to underspending of the EIG in the
Eastern Cape. EE noted that in 2014/15 budget, R1 177 914 000 was allocated to the Eastern Cape
through the EIG and that R181 343 000 of this amount was unspent, after which National Treasury
stopped the allocation of the EIG to the Eastern Cape in terms of Section 19 of the Division of Rev-
enue Act.87 Section 19(1) of the Division of Revenue Act provides that allocation of funds may be
stopped on a number of grounds, including if the National Treasury anticipates that a province or
municipality will substantially underspend on the allocation, or on any programme partially or fully
funded by the allocation, in the 2015/2016 financial year.88
69. Accordingly, EE argued that the reason the grant was stopped in this case was because it was antic-
ipated that the Eastern Cape would again substantially underspend its allocation, and further that
this demonstrated that proper planning and implementation were not taking place in cooperation
with other departments, even where funds were made available.89
70. Table 7 below shows the Eastern Cape failed to meet its EIG targets for classrooms built, as well as
the provision of water, electricity and sanitation in 2016/17.
Table 7: EIG Targets versus performance (2016/17)
Target Performance
Classrooms 509 88
Sanitation 246 88
Water 165 77
Electricity 95 10
Source: Adapted from Budget Justice Coalition’s Submission to the Standing and Select Committees on Appropriations, 2019.
71. As was the case with the administration of the SIBG, common challenges resulting in the variances
between targets and performance of the EIG included the non-performance of implementing
agents and poor project management capacity and practices.90
72. It is worth noting that EE launched a report on implementing agents at the Eastern Cape Depart-
ment of Education (“ECDoE”) offices in December 2018.91 The report highlighted the key enablers
of effective school infrastructure delivery, which would ensure that implementing agents time-
ously built and fixed schools. The launch was attended by provincial government officials and
representatives from certain implementing agents. Themba Kojana (ECDoE Head of Department)
committed to preparing an action plan for carrying out the recommendations made during EE’s
presentation on the report. These included:
72.1 engaging with the DBE in order to develop guidelines for how Heads of Department
appoint implementing agents and evaluate their capacity;
72.2 introducing a mechanism which would allow the public to access important informa-
tion on construction projects at specific schools;
25You can also read