The UW Virtual Brain Project: An immersive approach to teaching functional neuroanatomy - arXiv
←
→
Page content transcription
If your browser does not render page correctly, please read the page content below
The UW Virtual Brain Project • February 2021 • Preprint

                                          The UW Virtual Brain Project: An immersive approach to teaching
                                                             functional neuroanatomy
                                                             Karen B. Schloss1,2 *, Melissa A. Schoenlein1,2 , Ross Tredinnick2 , Simon Smith2 ,
                                                                 Nathaniel Miller1,3 , Chris Racey4 , Christian Castro5 , and Bas Rokers3
                                                                      1 Department of Psychology, University of Wisconsin–Madison
                                                                  2 WisconsinInstitute for Discovery, University of Wisconsin–Madison
                                                                               3 Program in Psychology, NYU Abu Dhabi
                                                                              4 School of Psychology, University of Sussex
                                                       5 Collaborative for Advancing Learning and Teaching, University of Wisconsin–Madison
arXiv:2108.13522v1 [cs.HC] 30 Aug 2021

                                                   ©2021, American Psychological Association. This paper is not the copy of record and may not
                                                      exactly replicate the final, authoritative version of the article. Please do not copy or cite
                                                     without author’s permission. The final article will be available, upon publication, via its
                                                                                       DOI: 10.1037/tps0000281

                                                                                                       Abstract

                                               Learning functional neuroanatomy requires forming mental representations of 3D structure, but forming such representations
                                               from 2D textbook diagrams can be challenging. We address this challenge in the UW Virtual Brain Project by developing 3D
                                               narrated diagrams, which are interactive, guided tours through 3D models of perceptual systems. Lessons can be experienced
                                               in virtual realty (VR) or on a personal computer monitor (PC). We predicted participants would learn from lessons presented
                                               on both VR and PC devices (comparing pre-test/post-test scores), but that VR would be more effective for achieving both
                                               content-based learning outcomes (i.e test performance) and experience-based learning outcomes (i.e., reported enjoyment
                                               and ease of use). All participants received lessons about the visual system and auditory system, one in VR and one on a PC
                                               (order counterbalanced). We assessed content learning using a drawing/labeling task on paper (2D drawing) in Experiment
                                               1 and a Looking Glass autostereoscopic display (3D drawing) in Experiment 2. In both experiments, we found that the
                                               UW Virtual Brain Project lessons were effective for teaching functional neuroanatomy, with no difference between devices.
                                               However, participants reported VR was more enjoyable and easier to use. We also evaluated the VR lessons in our Classroom
                                               Implementation during an undergraduate course on perception. Students reported that the VR lessons helped them make
                                               progress on course learning outcomes, especially for learning system pathways. They suggested lessons could be improved by
                                               adding more examples and providing more time to explore in VR.

                                            Public Significance Statement. We designed and evaluated interactive 3D narrated diagrams to teach
                                         functional neuroanatomy. These lessons can be experienced on desktop PCs and in virtual reality (VR), and are
                                         helpful for teaching undergraduates about structure and function of perceptual systems in the human brain.

                                             To learn functional anatomy, such as how sensory                     Prior studies have suggested physical models are
                                         information is processed in the human brain, students                better than computer models for illustrating gross
                                         must form mental representations of 3D anatomical                    anatomy (Khot et al., 2013; Preece et al., 2013; Wainman
                                         structures. Evidence suggests forming mental represen-               et al., 2020; Wainman et al., 2018). However, physi-
                                         tations is easier for learners when they are presented               cal models are limited in their potential to illustrate
                                         with 3D models (i.e., different views can be rendered                dynamic, functional processes, such as how neural
                                         by translation and rotation), compared with 2D images                signals are triggered by sensory input and propagate
                                         (see Yammine and Violato (2015) for a meta-analysis).                through a perceptual system. Given that our focus is
                                         This benefit of 3D models, at least in part, is because              on functional anatomy, we will focus our discussion on
                                         piecing together multiple views from 2D images incurs                computer-based models only.
                                         a cognitive load that detracts from learning the content,               The present study is part of the UW Virtual Brain
                                         especially for learners with lower visual-spatial ability            Project, in which we have developed and assessed a
                                         (Bogomolova et al., 2020; Cui et al., 2016).                         new approach for teaching students about functional
                                            * Correspondence concerning this article should be addressed to Karen Schloss, University of Wisconsin-Madison, 330 North Orchard
                                         Street, Room 3178 Madison, WI 53715. E-mail: kschloss@wisc.edu

                                                                                                                                                                             1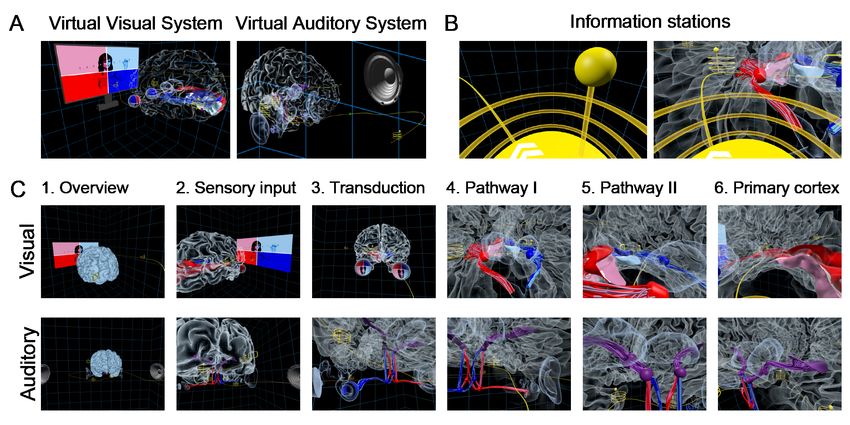
The UW Virtual Brain Project • February 2021 • Preprint

anatomy of perceptual pathways. Previous computer-                       Experience-based learning outcomes included finding
based 3D models of the human brain were geared                           the lessons enjoyable and easy to use.
toward teaching medical students about gross anatomy                         We predicted that learners would make significant
(Adams & Wilson, 2011; L. K. Allen et al., 2016; Cui                     gains in content-based learning outcomes from lessons
et al., 2017; Drapkin et al., 2015; Ekstrand et al., 2018;               experienced in both VR and PC viewing (compared to
Kockro et al., 2015; Stepan et al., 2017).1 In contrast, our             a pre-test baseline), but VR viewing would be more
lessons give learners guided, first-person view tours                    effective. We also predicted VR would be more effec-
through “3D narrated diagrams” illustrating the func-                    tive for achieving experience-based learning outcomes.
tional anatomy of the human brain. We use the term                       Previous work strongly supports our prediction for
“3D narrated diagram” to refer to 3D models combined                     experience-based learning outcomes, demonstrating
with labels and verbal descriptions, analogous to con-                   that VR facilitates enjoyment, engagement, and mo-
tent found in textbook diagrams with corresponding                       tivation, compared with less immersive experiences
text. They can also include animations that illustrate                   (Hu-Au & Lee, 2017; Makransky et al., 2020; Pantelidis,
dynamic aspects of the system. Thus, 3D models form                      2010; Parong & Mayer, 2018; Stepan et al., 2017). How-
the basis for the environment used to teach students                     ever, prior evidence concerning our prediction that VR
about sensory input, system pathways, and system                         would better support content-based learning outcomes
purposes, which are key learning outcomes in an un-                      is mixed. Research on learning 3D structure and spa-
dergraduate course on sensation and perception.                          tial layout suggests VR should facilitate learning, but
    Our aim was to develop structured, self-contained                    research on narrated lessons suggests VR may hinder
lessons for an undergraduate audience, which har-                        learning, as discussed below.
nessed principles for effective multimedia learning                          Research on learning 3D anatomical structure sug-
(Mayer, 2009). These principles have previously been                     gests stereoscopic viewing facilitates learning com-
shown to facilitate learning in a variety of domains. For                pared to monoscopic viewing of the same models, at
example, using visual cues to signal students where                      least when viewing is interactive. A meta-analysis re-
to look during a lesson can help them learn about                        ported that viewing interactive stereoscopic 3D models
neural structures (signaling principle) (Jamet et al.,                   provided a significant benefit, compared with view-
2008). Learners benefit from having self-paced con-                      ing interactive monoscopic 3D models (i.e., the same
trols through a lesson, compared with experiencing                       image was presented to both eyes, or the image was
system-paced continuous animation (segmenting prin-                      presented to one eye only) (Bogomolova et al., 2020).
ciple) (Hasler et al., 2007). And, receiving input from                  For example, Wainman et al. (2020) found students
multiple modalities (audio narration plus visual illus-                  learned better when stereoscopically viewing 3D mod-
tration) can be better than receiving visual input alone                 els compared to when one eye was covered while using
(modality principle) (Harskamp et al., 2007).                            a VR HMD. The additional depth information provided
    The UW Virtual Brain 3D narrated diagrams can be                     by stereopsis likely contributes to these enhanced learn-
viewed on personal computer monitors (referred to as                     ing outcomes (Bogomolova et al., 2020; Wainman et al.,
“PC”; the same image is presented to both eyes) or in                    2020). Evidence suggests that stereoscopic informa-
virtual reality using a head mounted display (HMD)                       tion is especially beneficial for 3D perception under
with stereoscopic depth (referred to as “VR”; differ-                    interactive viewing conditions where head tracking-
ent images are presented to each eye 2 ). In the VR                      based motion parallax information and task feedback
version, the brain is room-sized, so learners can “im-                   are available (Fulvio & Rokers, 2017), perhaps because
merse” their whole body inside the brain. This study                     viewers tend to discount stereoscopic information un-
investigated whether students made significant gains                     der passive viewing conditions (Fulvio et al., 2020).
in content-based learning outcomes from the Virtual                      This may explain why the contribution of stereopsis
Brain lessons, and whether viewing device (VR vs.                        to achieve learning outcomes was more limited under
PC) influenced the degree to which learners achieved                     passive viewing (Al-Khalili & Coppoc, 2014) and fixed
content-based and experience-based learning outcomes.                    viewpoint rendering (Chen et al., 2012; Luursema et al.,
Content-based learning outcomes included being able                      2008).
to describe (draw/label) key brain regions and path-                       A separate line of studies testing the ability to re-
ways involved in processing visual and auditory input.                   member spatial layout in new environments suggests
    1 Studies
            evaluating the efficacy of these 3D models used a myriad of comparison conditions that differed from the 3D models in multiple
dimensions. Thus, it challenging to form general conclusions from their results (see Wainman et al. (2020) for a discussion of this issue).
   2 We note earlier literature used the term “VR” in reference to viewing 3D models on 2D displays (e.g., computer monitors), rather than

immersive head mounted displays (see Wainman et al. (2020) for a discussion of this issue). In this article, we reserve the term “VR” for head
mounted displays, like an Oculus Rift, Oculus Go, or HTC Vive.

2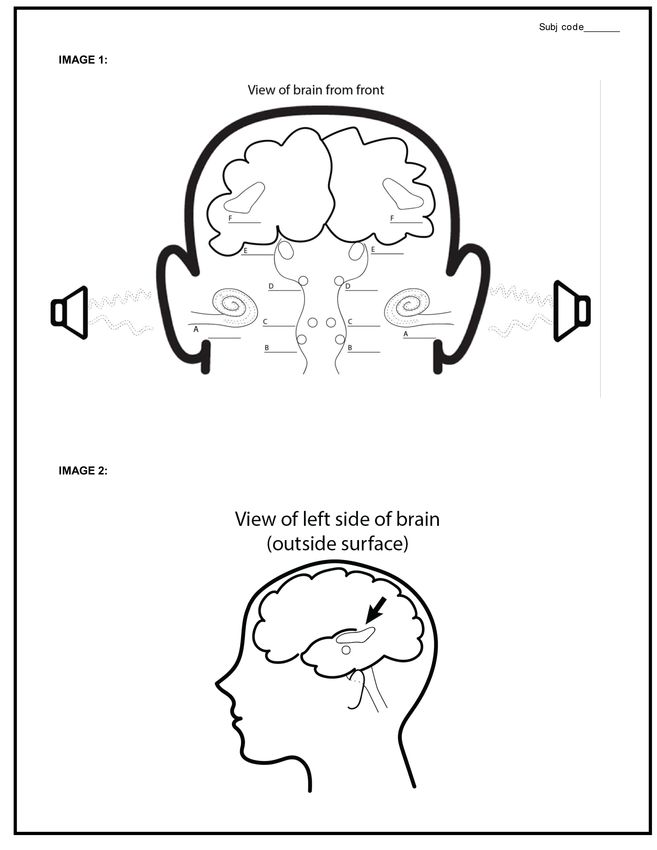
The UW Virtual Brain Project • February 2021 • Preprint

that VR facilitates spatial memory. Comparisons be-          sensation and perception textbook (Wolfe et al., 2014),
tween learning in VR or on a desktop PC suggest par-         and constructed from human neuroimaging data.
ticipants were better at navigating a virtual building           The UW Virtual Brain Project lessons leveraged sev-
(Ruddle et al., 1999) and recalling the spatial location     eral principles for creating effective materials for mul-
of objects (Krokos et al., 2019) in VR. These results have   timedia learning Mayer (2009). In our lessons, verbal
been explained by increased presence (feelings of “be-       narration was combined with visual input (multimedia
ing there”) (Sanchez-Vives & Slater, 2005) in VR, due        principle) in a way that enabled learners to listen and
to greater immersion supported by proprioceptive and         look at the same time (modality principle). Through
vestibular sensory information available during VR           the narration, we provided verbal cues about where to
experiences (Krokos et al., 2019; Ruddle et al., 1999).      look (e.g., “look to your left, you will see...”) to help
Increased presence enables learners to leverage spa-         learners align the visual and verbal input (signaling
tial cues in the environment to facilitate memory (i.e.,     principle). The lessons were self-paced (segmentation
the method of loci or the memory palace technique)           principle), as learners controlled their motion and trig-
(Krokos et al., 2019).                                       gered narration by choosing when to enter an informa-
    Although work on stereopsis and spatial memory           tion station. We avoided additional elements unrelated
suggests VR will help with learning spatial structure        to the content (coherence principle) by only including
in the Virtual Brain lessons, research comparing nar-        neural structures and labels that were relevant to the
rated lessons viewed in VR or on PCs suggests VR             perceptual system featured in a given lesson.
might hinder learning. Studies on narrated lessons               For any kind of VR-based visualization, motion
about scientific procedures (e.g., DNA sample prepa-         sickness can lead to considerable discomfort (Stanney
ration) reported no difference (Makransky et al., 2020)      et al., 2020). We employed several design considera-
or worse performance for VR (Makransky et al., 2020;         tions to mitigate motion sickness. First, we optimized
Makransky et al., 2019) compared to PC viewing. One          our code to maintain the maximum frame-rate of the
exception in which VR facilitated learning was when          VR headset. Second, the participant was in control of
it was paired with enactment using physical objects          all movement, eliminating the possibility of any drastic
in-between the VR lesson and testing (Makransky et al.,      and unexpected motion signals. Third, the trajectory
2020). The general concern about narrated VR lessons         along which the participant could move was always
is that presence from immersion in VR can distract           visible, allowing the participant to anticipate the visual
learners from the content in the lesson, which impedes       consequences of any initiated movement. We evalu-
learning (Makransky et al., 2020; Makransky et al., 2019;    ated the efficacy of these design considerations using
Parong & Mayer, 2018). Thus, it is possible that adding      the Simulator Sickness Questionnaire (SSQ) (Kennedy
additional cognitive load from narration will diminish       et al., 1993) and a questionnaire assessing participants’
or even reverse the benefits of learning 3D structure        enjoyment and ease of use in the different conditions,
from added stereopsis and increased presence in VR.          which we describe in the Measures section of Exp. 1A.
    In the following sections, we first describe the gen-    The SSQ results are presented in the Supplemental
eral methods for designing and implementing the UW           Material.
Virtual Brain Project lessons. We then present the               Figure 2 outlines our pipeline for constructing the
results of two laboratory experiments that assessed          virtual environments. We began with a T1-weighted
learning outcomes of lessons presented in VR vs. PC          anatomical MRI scan and used FreeSurfer (Fischl, 2012)
viewing (Experiment 1 and Experiment 2). Finally, we         to extract the pial surface of the brain. This approach
discuss how we implemented the lessons in an under-          was similar to Ekstrand et al. (2018). We generated
graduate course on the psychology of perception and          cortical regions of interest by extracting surfaces from
present results from student evaluations (Classroom          FreeSurfer’s default segmentation and cortical surface
Implementation).                                             generation and Glasser’s Human Connectome Project
                                                             Multimodal Parcellation Atlas (Glasser et al., 2016).
                   General Methods                           For some subcortical structures, we estimated their
                                                             location based on gross anatomy and rendered them
We created and evaluated two UW Virtual Brain                manually. We generated major white matter pathways
lessons, the Virtual Visual System and Virtual Auditory      using probabilistic tractography and manually recre-
System. Learners could travel along a track and stop at      ated smaller pathways. We then imported all geometry
information stations to hear narration about key struc-      into the Unity game engine and added features includ-
tures and pathways involved in perceptual processing         ing voice-over playback, text rendering, and navigation.
(Figure 1). The interactive diagrams in our Virtual          Additional details on the history of VR brain rendering
Brain lessons were adapted from figures in a popular         can be found in the Supplemental Material.

                                                                                                                     3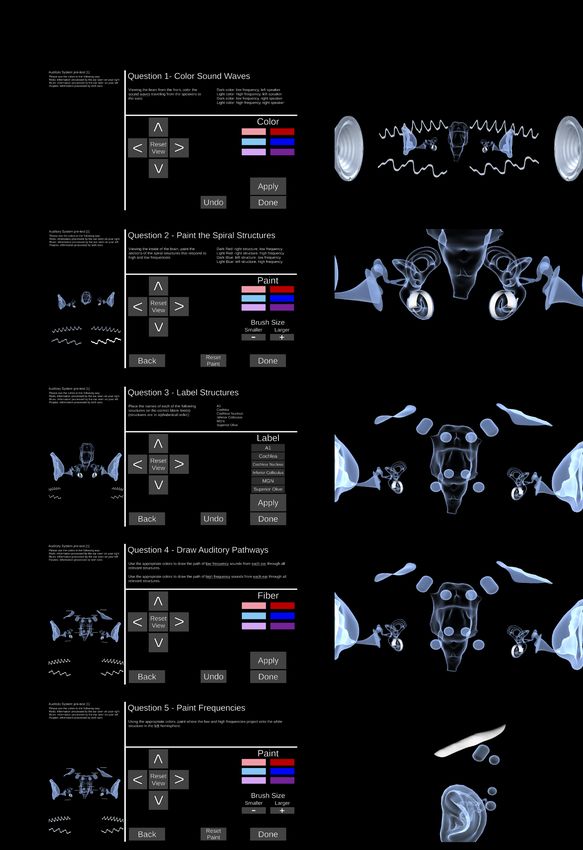
The UW Virtual Brain Project • February 2021 • Preprint

Figure 1: Illustration of the of the UW Virtual Brain Project. (A) Screenshots of the Virtual Visual System and Virtual
Auditory System. (B) Information stations, where participants learn about the structures and pathways via audio narration.
(C) Each lesson has 6 stations that learners visit along a track at key points in the perceptual system pathway.

    The Virtual Visual System and Virtual Auditory System      chair. Participants heard narration through built in
(Figure 1A) each have six information stations, which          speakers in the HMD and interacted with the environ-
start outside of the brain (Station 1) and follow along        ment using Oculus Touch controllers. They moved for-
a track from sensory input (Station 2), to transduction        ward/backward along the track by pressing the Oculus
(Station 3), to midbrain regions and pathways (Stations        Touch joystick and looked around the room by moving
4 and 5), to primary cortex (Station 6) as shown in            their head. The HMD tracked this head movement
Figure 1C. When learners arrive at a station, glowing          (6-degrees of freedom head tracking) and updated the
yellow rings appear around the perimeter of the station        image to match the head motion. In the PC version
(Figure 1B) and voice-over narration provides informa-         learners sat in front of a 24-inch Samsung monitor and
tion relevant to that location. After the audio finishes,      heard narration through headphones. They used the
the rings fade away, and learners can continue along           left/right mouse buttons to move forward/backward
the track. The locations and narration for the two per-        along the track and slid the mouse in any direction
ceptual systems were as parallel as possible and the           to “look around” (rotate the view). In the Classroom
lessons were equal in length (~5 minutes). See the Sup-        Implementation we used wireless Oculus Go HMDs
plemental Material for descriptions of the lesson expe-        which support 3-degrees of freedom head tracking
riences and narration scripts. The lessons can be down-        (rotation only) and the Oculus Go controller to move
loaded from https://github.com/SchlossVRL/UW-                  along the track.
Virtual-Brain-Project.
                                                                   For each device in the experiments, participants
   In Experiments 1 and 2, the VR and PC setups were           completed a practice lesson that introduced them to
powered by a Dell Alienware Aurora workstation with            the virtual environment and the device controls. The
a nVidia GeForce 970 GPU. In the VR version we used            environment included a model of the brain’s cortical
an Oculus Rift CV1 with 360 degree tracking enabled.           surface (no structures/pathways). Audio narration in-
Three Oculus camera sensors were placed in the up-             structed participants about how to use the controls for
per corners of a 6-ft × 8-ft tracked space. Participants       the given device and asked them to practice moving
stood in the middle of the space, and the Oculus cord          forward/backward and looking around. In the VR
was suspended from above, enabling full 360-degree             practice, participants also used a virtually rendered
body rotation. Although our participants stood, the            eye chart to adjust the interpupillary distance of the
VR lessons could be done while seated on a swivel              Oculus lenses to minimize blurriness.

4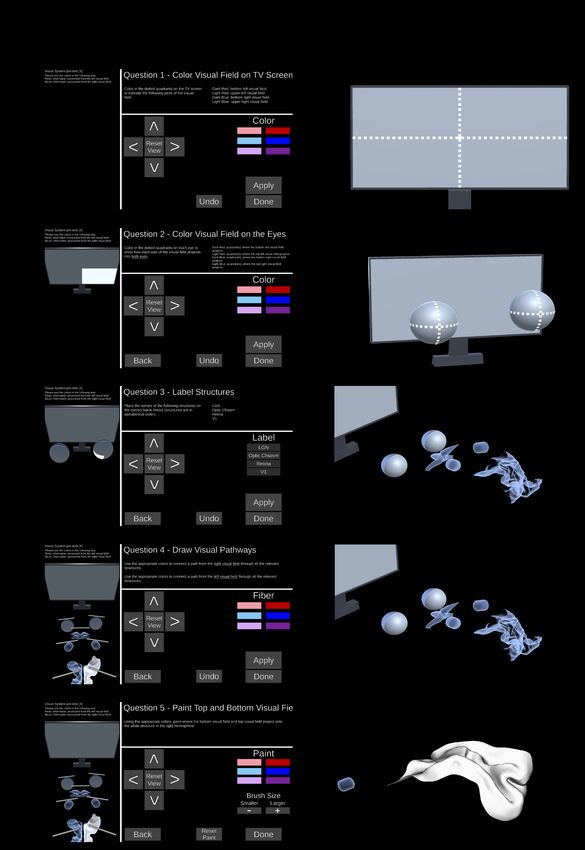
The UW Virtual Brain Project • February 2021 • Preprint

Figure 2: Pipeline for creating the UW Virtual Brain lessons, beginning with an MRI scan and ending with lessons that can
be used on PC desktops or in VR.

                     Experiment 1                             first completed the SSQ as a baseline measure for mo-
                                                              tion sickness symptoms. Second, they completed the
Experiment 1 compared the effects of PC vs. VR view-          first lesson block, which included a paper pre-test, a
ing on achieving content-based and experienced-based          practice experience for the given device, the lesson, and
learning outcomes. Assessments of content-based               a post-test. Third, participants completed the second
learning outcomes were done by drawing/labeling on            SSQ to assess how they were feeling after the first les-
paper. Exp. 1A and 1B were the same except Exp. 1B            son. Fourth, participants completed the second lesson
had twice the sample size to increase statistical power.      block, which was the same as the first, except using a
                                                              different device (e.g., if VR was used in the first lesson
                                                              block, PC was used in the second lesson block) and
                    Experiment 1A                             different perceptual system (e.g., if the visual system
                                                              was used in the first lesson block, the auditory system
                        Methods                               was used in the second lesson block). Fifth, partici-
                                                              pants completed another SSQ to assess how they were
                      Participants
                                                              feeling after the second block. Last, participants com-
60 undergraduates (30 female, 29 male, 1 no report;           pleted the experience questionnaire. The procedure
mean age = 19.1) participated for credit in Introductory      lasted approximately 1 hour. The time to complete the
Psychology at University of Wisconsin–Madison. Data           VR condition was about 3 minutes longer than the PC
from three others were excluded due to experimenter           condition due to extra time adjusting the HMD in the
error. A power analysis estimating a medium effect            practice room before the VR lesson.
(d = .5) for a two-tailed paired t-test comparing PC
vs. VR (α = .05, power of .9) suggested a sample of
                                                                                      Measures
n = 44, but we rounded to n = 60 to be more conserva-
tive. All participants had typical color vision (screened     Content learning. We assessed content learning using
using H.R.R. Pseudoisochromatic Plates (Hardy et al.,         a pre-test/post-test design for each perceptual system
2002)) and typical stereo vision (screened using the          with the same test provided at both time points. We
RANDOT®Stereovision test). For all experiments in             used a drawing/labeling task, which aligned with the
this study, all participants gave informed consent and        content-based learning outcomes of describing key re-
the UW–Madison IRB approved the protocol.                     gions and pathways of the perceptual systems. We
                                                              used the same pre-test and post-test because it was a
                Design and Procedure                          controlled way of testing exactly what gains in knowl-
                                                              edge were made during the lessons. A limitation of this
Figure 3 shows an overview of the experiment pro-             approach is that learners were primed on the critical
cedure (Figure 3A), the experiment design (Figure             information prior to starting the lesson. However since
3B), and the testing materials (Figure 3C). The de-           the design was consistent across the PC and VR con-
sign included 2 devices (VR and PC; within-subjects)          ditions, this priming could not account for differences
× 2 device orders (VR-first or PC-first, between-             between conditions.
subjects) × 2 perceptual system-device pairings (visual-          Tests for both perceptual systems were matched in
VR/auditory-PC or auditory-VR/visual-PC; between              number and types of questions. Tests for each system
subjects) (n = 15/group, randomly assigned).                  included two line drawing images of the brain from
   During the consenting process, we emphasized that          different perspectives (Figure 3C), which resembled
participants could end the experiment at any time if          perspectives experienced during the lessons. Partici-
they felt unwell. During the experiment, participants         pants responded to five questions by coloring/labeling

                                                                                                                       5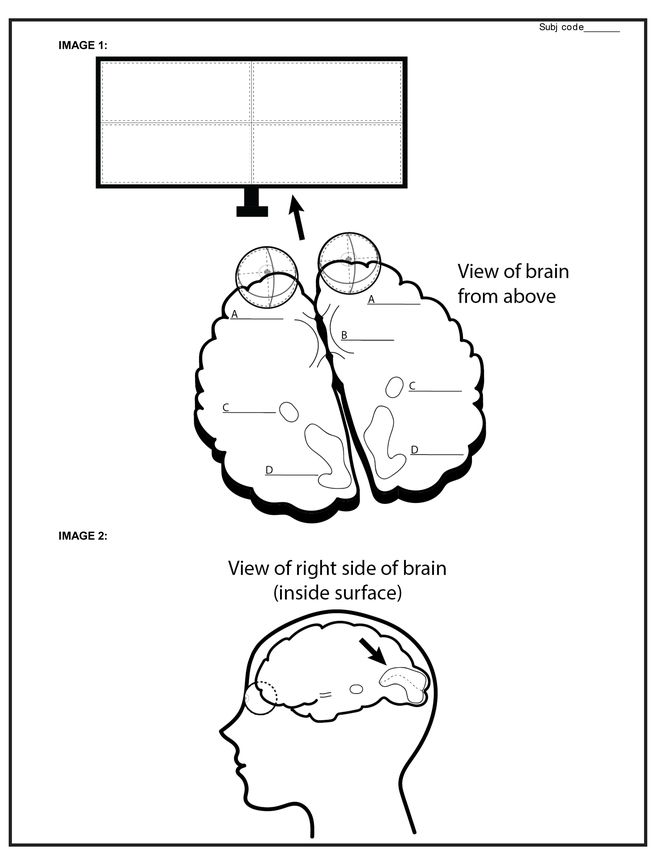
The UW Virtual Brain Project • February 2021 • Preprint
Figure 3: Overview of the experimental procedure. (A) In both Experiments 1 and 2 each lesson block featured a pre-test, the
lesson (either desktop personal computer (PC) or virtual reality (VR)), and a post-test. Three simulator sickness questionnaires
(SSQs) were administered throughout the course of the experiment, with an Experience questionnaire at the end. (B) Illustra-
tion of the experimental design. We randomized the 2 learning device (within-subjects) × and 2 perceptual system-device
pairings (between-subjects). Each row represents the lessons experienced by a participant. Not explicitly represented is device
order. If the figure presented represents VR-first, the PC-first groups would mirror that (between-subjects). (C) Illustration
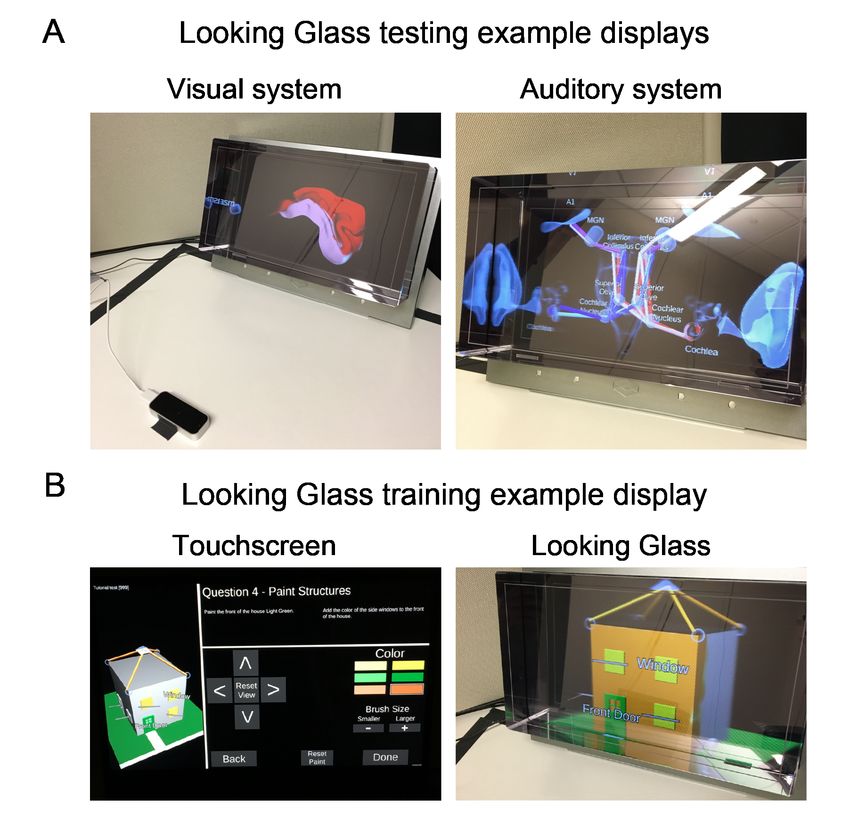
of Paper tests (Exp. 1A and 1B) and Looking Glass tests (Exp. 2) used to assess content-based learning outcomes for each
perceptual system lesson. See Supplemental Material for full tests and instructions and for larger images of the Looking
Glass display (Figure C10).
structures and drawing pathways on the two images red pen: quadrant(s) of the eyes where the bottom left
(image 1 for questions 1-4; image 2 for question 5), visual field projects”), (c) Use the black pen to write
using pens in three hues (red, blue, purple), with two the names of the structures on the blank lines, (d) Use
pens per hue (light/dark), and one black pen (7 pens the “appropriate colors” (based on previous responses)
total). The questions built on one another, requiring to draw the path from both the right and left visual
participants to use the hues/lightness of the pens to field through all relevant structures, (e) On image 2,
indicate how the sensory input from the world travels indicate (color) where the bottom and top visual field
into and through the perceptual system and projects project on the marked structure (which was V1).
onto the system’s structures. Participants were encour- In the auditory system test, the first test image fea-
aged to answer all questions, even if guessing. If they tured a coronal slice of a head with ears and a brain,
made a mistake, they were told to ask for a new blank flanked by speakers “producing” sound waves. In the
page. See Supplemental Material for full tests and brain, the cochleas, MGNs, and A1 structures were
instructions (Figures C1-C5). outlined and circles represented the cochlear nuclei,
In the visual system test, the first test image con- superior olives, and inferior colliculi. The second test
sisted of a TV screen and an axial slice of the brain fea- image showed a profile view of the left side of the head
turing two eyes and outlines of the optic chiasm, LGNs, and had outlines of MGN and A1. Participants were
and V1 structures. The second test image showed a told to use the colored pens as follows: “Reds: infor-
sagittal slice of the brain, featuring the right hemi- mation processed by the ear seen on your right; Blues:
sphere, with the corresponding eye, LGN, and V1. Par- information processed by the ear seen on your left;
ticipants were told to use the colored pens as follows: Purples: information processed by both ears; Black: La-
“Reds: information processed from the left visual field; beling structures.” The questions for the auditory test
Blues: information processed from the right visual paralleled the visual except in place of the visual field
field; Black: Labeling structures.” The questions are (TV), participants colored in the sound waves from the
summarized as follows: (a) Use the colored pens to speakers and drew the pathways in regard to low and
indicate (color in) the four parts of the visual field in high frequency sounds. Also, instead of the retina and
the TV screen (i.e., “dark red pen: bottom left visual V1, participants colored the parts of the cochlea and A1
field), (b) Color in the quadrants on the eyes, with in reference to processing lower/higher frequencies.
respect to where the visual field projects (i.e., “dark Experience Questionnaire. We assessed
6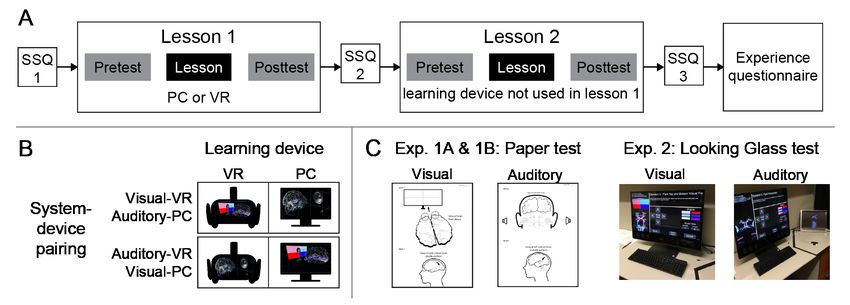
The UW Virtual Brain Project • February 2021 • Preprint

experience-based learning outcomes by having partici-                                              Content questions
pants rate seven items on a Likert scale from 1 (“Not at
all”) to 7 (“Very Much”). The items asked how much                          Figure 4A shows mean change in test performance for
participants (a) found the experience awe inspiring, (b)                    the PC and VR devices, averaged over participants, test-
found the experience aesthetically pleasing, (c) enjoyed                    ing order, and perceptual system-device pairing. t-tests
the experience, (d would like to use this kind of experi-                   against zero showed that change scores were signifi-
ence for their own studies about the brain in the future,                   cantly positive for both PC and VR (t(59) = 13.05, p <
(e) would recommend the experience to a friend for                          .001, d = 1.68, and t(59) = 11.69, p < .001, d = 1.51,
learning about the brain, (f) would recommend the                           respectively), indicating that participants learned from
experience to a friend to do for fun, (g) found ease                        the Virtual Brain lessons on both devices. A paired sam-
with using the control system to move around and see                        ples t-test did not reveal a significant difference in learn-
what they wanted to see. This task was done on paper.                       ing between devices (t(59) = 1.59, p = .118, d = .21).
    Simulator Sickness Questionnaire (SSQ). We as-                              In an exploratory analysis to test for effects of de-
sessed a subset of symptoms from the SSQ (Kennedy                           vice order and perceptual system-device pairing, and
et al., 1993). For each symptom (headache, nausea,                          their interaction with device (mixed-design ANOVA: 2
eye strain, and dizziness with eyes open) participants                      devices (VR vs. PC; within-subjects) × 2 device orders
indicated how they felt by circling “None”, “Slight”,                       (VR-first vs. PC-first; between-subjects) × 2 percep-
“Moderate”, or “Severe” (scored as 1-4). The SSQ results                    tual system-device pairing (visual-VR/auditory-PC vs.
are reported in the Supplemental Material, see Figure                       auditory-VR/visual-PC; between-subjects)), there was
D1. For all experiments, mean responses to all four                         no effect of device (F (1, 56) = 2.47, p = .122, η 2p = .041),
symptoms were between none and slight at all time                           or system-device pairing (F < 1), but there was a main
points, and no participant reported severe symptoms.                        effect of device order (F (1, 56) = 4.56, p = .037, η 2p =
This task was done on paper.                                                .075), in which the mean change in performance was
                                                                            greater for participants in the VR-first group than the
                                                                            PC-first group. The 2- and 3-way interactions were not
                     Results and Discussion
                                                                            significant (Fs < 1.19).
                               Scoring                                          We also explored whether there was a difference
                                                                            in the pre-test performance for the two perceptual sys-
Each test was scored by two independent raters using                        tems and found greater performance for the visual
an 18-item rubric with each item worth 1 point (see the                     system (t(59) = 7.00, p < .001, d = .90). Given the way
Supplemental Material). Prior to collecting and scor-                       we coded the counterbalanced factors, an interaction
ing the data, we collected data from five pilot subjects                    between device and perceptual system-device pairing
to fine-tune the rubric. The two raters used an initial                     would indicate differences in change in performance
rubric to independently score the pilot data. They then                     for the visual and auditory systems. We do not see
discussed discrepancies in their scores and updated                         such a difference here, indicating learning was similar
the rubric to make it more precise. No changes to the                       across perceptual systems.
rubric were made once testing in Exp. 1A began.
    During the experiment, each test page was given
a random code that represented subject number and                                             Experience questionnaire
condition. The raters did not have access to these codes,
so they could not identify which tests were pre-tests                       Figure 4B shows the mean ratings for each of the seven
versus post-tests, which were from VR or PC lessons,                        experience questionnaire items. From visual inspec-
and which belonged to the same participant. To eval-                        tion, VR ratings were much higher than PC for every
uate inter-rater reliability, we correlated each of the                     item except ease of use. This suggests participants
raters’ scores over 240 tests [60 participants × 2 lessons                  found the VR experience more awe-inspiring, enjoy-
(visual, auditory) × 2 tests (pre-test, post-test)]. The                    able, aesthetically pleasing, and were more likely to use
correlation was high (r = .94), so we averaged the scores                   it themselves and recommend it to others for learning
across raters for each participant. We then calculated                      or for fun than the PC experience.
change in performance for each participant as the post-                         Given that many of the items were highly correlated
test scores minus pre-test scores (ranging from -18 to                      (see Table D1 in the Supplemental Material), we used
18) for each device. Data for all experiments can be                        Principle Components Analysis (PCA, with oblique
found at https://github.com/SchlossVRL/UW-Virtual-                          rotation) to reduce the dimensions before conducting
Brain-Project.                                                              statistical tests to compare across devices.3 All items
  3 Five   of the participants left one item blank, so we inserted the mean of all other participants’ responses for that item.

                                                                                                                                        7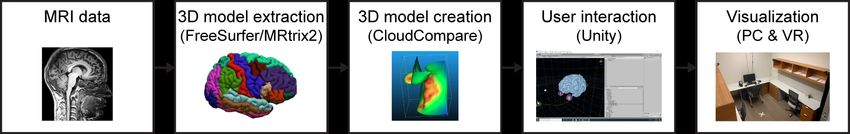
The UW Virtual Brain Project • February 2021 • Preprint

Figure 4: Results of learning outcome assessments as a function of device (PC vs. VR). (A) Mean change in test performance
and (B) mean ratings for ease of use and “average enjoyment” for personal computer (PC; light bars) and virtual reality (VR;
dark bars) devices, averaged over participants, testing order, and perceptual system in Experiments 1 and 2. The data to the
right of the vertical dashed line in (B) correspond to the 6 individual items used to calculate “average enjoyment”. Error bars
represent standard errors of the means. ∗ p < .05, ∗ ∗ p < .01, ∗ ∗ ∗ p < .001

except ‘ease of use’ loaded strongly onto the first prin-        and pathways involved in processing sensory infor-
cipal component, which can be summarized as “enjoy-              mation from the lessons experienced on both devices.
ment” (capturing 66% of the variance). Thus, we used             There was no significant difference in content learning
the mean of these items for subsequent analysis and              between devices, but assessments of experience-based
refer to it as “average enjoyment.” Item 7, ease of use,         learning outcomes showed that participants enjoyed
was an outlier in the PCA, so we treated it separately.          the VR lesson significantly more than the PC lesson.
Paired samples t-tests comparing devices showed that             There was no significant difference in ease of use.
average enjoyment was significantly greater for VR                   In the a priori power analysis for this experiment, we
than for PC lessons (t(59) = 9.50, p < .001, d = 1.23),          estimated a medium effect size comparing VR and PC
and there was no significant difference for ease of use          devices for measures of content-learning, but a power
(t(59) = .86, p = .39, d = .11).                                 analysis using our observed effect size (η 2p = .041,
    In summary, this experiment demonstrated that par-           when accounting for device order and perceptual sys-
ticipants learned key content such as the brain regions          tem/device pairing) with power of .80, α = .05 sug-

8
The UW Virtual Brain Project • February 2021 • Preprint
gested we needed a larger sample size (112 participants) is further supported by a paired samples t-test com-
to observe an effect. We note that if this effect were paring change in performance scores for visual and
significant, it would be in the opposite direction of our auditory lessons (t(119) = 3.95, p < .001, d = .36). The
prediction (i.e., greater learning for PC than VR). To other 2-way interactions and 3-way interaction were not
test this possibility, we conducted Exp. 1B as a direct significant: device × device order (F < 1), perceptual
replication of Exp. 1A with an increased sample size system-device pairing × device order (F < 1), 3-way
(120 participants to be more conservative). interaction (F (1, 116) = 2.30, p = .132, η 2p = .019). Ex-
amining the pre-test scores, the visual system scores
Experiment 1B were again significantly greater than the auditory sys-
tem scores (t(119) = 7.66, p < .001, d = .70).
Methods
Experience questionnaire
The methods were the same as Exp. 1A except we
increased the sample size based on the power analysis As in Exp. 1A, we conducted statistical tests on mean
reported in Exp. 1A. 120 undergraduates (79 females, enjoyment (averaging over six items) and ease of use.
36 males, 5 no report; mean age = 18.60, two no report) This data set includes only 114 out of 120 participants
participated for extra credit in Introductory Psychol- because six participants did not complete the survey.
ogy at UW–Madison. All had typical color and stereo Mean enjoyment was significantly greater for VR than
vision and gave informed consent. Eight additional for PC (t(113) = 9.16, p < .001, d = .86) (Figure 4B), as
participants were excluded due to experimenter error in Exp. 1A. Ease of use was also significantly greater
or technical difficulties (4 participants), atypical color for VR than PC (t(113) = 2.39, p = .02, d = .22), which
vision (1 participant), or atypical stereo vision (3 par- was not significant in Exp. 1A (likely due to the smaller
ticipants). sample size in Exp. 1A).
In summary, Exp. 1B showed that with greater sta-
Results and Discussion tistical power, there was no difference between VR and
PC viewing on achieving content-based learning out-
Content questions comes (learning occurred on both devices). However,
The two raters from Exp. 1A scored the tests (inter- increasing power may be responsible for the finding
rater reliability: r = .91). As in Exp. 1A, change scores that participants rated VR as significantly easier to use
were significantly greater than zero for PC (t(119) = than PC, which was only marginal in Exp. 1A.
15.46, p < .001, d = 1.41) and VR (t(119) = 13.94, p <
.001, d = 1.27), indicating that participants learned on EXPERIMENT 2
both devices (Figure 4A). The t-test comparing devices
averaged over all other factors again showed no sig- Exp. 1 showed no differences between PC and VR de-
nificant difference between devices (t(119) = 1.62, p = vices for content learning. However, it is possible that a
.109, d = .15). Likewise, the full ANOVA [2 devices difference could still exist and our paper test measure
(VR vs. PC; within-subjects) × device orders (VR-first was not sufficient to detect it. Although paper assess-
vs. PC-first; between-subjects) × 2 perceptual system- ments (2D drawing) may be the norm in the classroom,
device pairings (visual-VR/auditory-PC vs. auditory- they may be limited in their ability to assess students’
VR/visual-PC; between-subjects)] again showed no sig- mental representations of 3D structures. Moreover, pa-
nificant effect of device, even after having increased per assessments were better aligned with 2D viewing
power (F (1, 116) = 2.95, p = .089, η 2p = .025). The on the PC than 3D viewing in VR. Thus, in Exp. 2 we
other main effects were also not significant: device examined whether testing under 3D viewing would
order (F (1, 116) = 2.01, p = .159, η 2p = .017), system- reveal differences in learning from VR vs. PC devices.
device pairing (F < 1). There was a significant de- By comparing these results to Exp. 1, we could test
vice × system-device pairing (F (1, 116) = 15.93, p < for effects of alignment between learning and testing
.001, η 2p = .121), which can be reduced to better perfor- method (similar to Wainman et al. (2018)).
mance for the visual system than the auditory system. The most straightforward way to implement testing
That is because participants with the system-device in 3D viewing would have been to test in the same
pairing of visual-VR/auditory-PC had higher scores VR device used for learning. However, in Exp. 1,
for VR (visual) compared to PC (auditory), whereas testing was implemented using a different format (pa-
participants with auditory-VR/visual-PC pairings had per/pens) from the two devices used for learning (VR
higher scores for PC (visual) than VR (auditory) indicat- and PC), so we also wanted to use a different format
ing overall greater learning for the visual system. This for testing in Exp. 2. Thus, we used a Looking Glass
9The UW Virtual Brain Project • February 2021 • Preprint
3D autostereoscopic display, which allowed 3D view- activated to match the question (i.e., structure labels
ing without glasses via parallax barriers and multiple would replace the color swatches for labeling ques-
layers of displays. Participants interacted with the tions). Screenshots of completed questions appeared
Looking Glass using a Leap Motion hand tracking con- on left of the touchscreen, allowing participants to view
troller, enabling them to complete analogous tests as in their previous answers. Each test had four tasks anal-
Exp. 1, but using their hands to draw/label in 3D. ogous to the paper test: filling in structures, labeling
structures, drawing pathways, and painting on struc-
Methods tures (See Supplemental Material for details). For each
task, participants used one hand to make selections on
Participants the touchscreen, and the other hand to complete the
drawing task. The Leap Motion tracked their draw-
48 undergraduates (29 females, 18 males, 1 no report;
ing hand and replicated its motion using a 3D hand
mean age = 19.17) participated for extra credit in Intro-
model in the Looking Glass. Because the Looking Glass
ductory Psychology at UW–Madison.4 All had typical
tasks were novel, participants received training on how
color and stereo vision. Additional participants were
to do the tasks prior to completing the first pre-test.
excluded due to experimenter error (4 participants),
They learned how to fill, draw, paint, and label parts
not finishing in the allotted time (1 participant, re-
of a 3D model house. Additional details on this train-
ported eye strain), atypical color vision (2 participants),
ing, including instructions (Figures C6 and C7) and
atypical stereo vision (1 participant).
examples displays (Figure C10), can be found in the
Supplemental Material.
Design, Displays, and Procedure
The design, displays, and procedure were the same Results and Discussion
as in Exp. 1, except we replaced the paper draw-
Content questions
ing/labeling tests with analogous tests using a 15.6
inch Looking Glass autostereoscopic display system Pre- and post-tests were automatically scored, except
(Dodgson, 2005), see Figure 3C. The overall display for items requiring painting portions of the system (i.e.,
resolution was 3840 × 2160 px, with 45 separate views painting the halves of V1 to represent where the up-
rendered at 768 × 240 pixels/view. Participants in- per/lower visual field maps onto V1; four questions in
teracted with the Looking Glass using a Leap Motion the visual system and seven for the auditory system)
hand tracking controller and a 28-in touch screen PC and one question addressing fiber cross-overs in the vi-
(A Dell XPS 27-7760 All-in-One Desktop). Due to the sual system. These questions were scored by the same
novelty of the Looking Glass and the need to train two raters from Experiment 1 for all 192 tests (48 par-
participants on how to use it, the experiment typically ticipants × 2 tests × 2 experiences) following a rubric
lasted 15-30 minutes longer than Experiment 1 (approx- adapted from that of Exp. 1. Inter-rater reliability was
imately 1.5 hours). high (r = .98) and scores were averaged over raters for
The Looking Glass displayed the 3D model of the each participant.
virtual brain from the lessons, except that it was resized As in Exp. 1, change in performance was signifi-
to fit on the display. It featured different subsections cantly positive for both PC (t(47) = 9.55, p < .001, d =
of the brain, providing views similar to the outlines 1.38) and VR (t(47) = 12.08, p < .001, d = 1.74), in-
on the paper drawing/labeling tests (see Figures C8 dicating participants learned using both devices (Fig-
and C9 in the Supplemental Material for images of the ure 4A). The t-test comparing devices averaged over
touch screen and corresponding views on the Looking all other factors again showed no significant differ-
Glass for each test question). ence between devices (t(47) = −.80, p = .428, = .12).
The touchscreen contained four main sections: the Similarly, the full ANOVA [2 devices (VR vs. PC;
questions (top), response buttons (right), a screenshot within-subjects) × device orders (VR-first vs. PC-first;
of the previously completed questions (left), and con- between-subjects) × 2 perceptual system-device pair-
trols for changing the viewpoint of the display (middle). ing (visual-VR/auditory-PC vs. auditory-VR/visual-
The questions were the same as the paper tests, except PC; between-subjects)] showed no significant effect of
we replaced the use of pens with the response buttons device (F < 1). None of the other main effects or in-
(i.e., color swatches, labels). The questions were pre- teractions were significant: device order (F (1, 44) =
sented one at a time, with different response buttons 2.87, p = .097, η 2p = .061), system-device pairing (F <
4 Weplanned to collect data for 120 participants to match Exp. 1B, but data collection was suspended due to COVID-19. The pattern of
results of this experiment parallel those of Exp. 1, suggesting that the change in testing method does not change the main results, even with
the reduced sample size.
10The UW Virtual Brain Project • February 2021 • Preprint
1), device × system-device pairing (F < 1), device minutes. The lessons were used at different times in
× device order (F (1, 44) = 2.46, p = .124, η 2p = .053), the semester when the material in the Virtual Brain
system-device pairing × device order (F < 1), 3-way lessons was typically covered. The Virtual Visual Sys-
interaction (F < 1). Examining just the pre-test scores tem was used in Week 2 of the course, in place of slides
again indicates that the visual system scores were sig- typically used to cover that material. Students com-
nificantly greater than the auditory system pre-tests pleted the VR lesson at the start of the class period, and
(t(47) = 5.77, p < .001, d = .83). the instructor immediately transitioned to lecturing on
We next examined whether testing format (2D draw- new material. The instructor observed that starting
ing on paper in Experiment 1 vs. 3D drawing on the a class meeting with VR felt abrupt, and transition-
Looking Glass in Experiment 2) resulted in different ing from the VR lesson to new material felt disjointed.
patterns of performance from PC or VR learning. We Therefore, we revised our approach for the auditory
used a mixed design ANOVA with 2 lesson devices system, implemented in Week 11. We embedded the
(PC vs. VR; within-subjects) × 2 testing devices (Paper VR lesson in a pre-VR lecture and post-VR activity,
vs. Looking Glass; between-subjects). There were no allowing for gradually-released instruction (Bransford
significant effects of lesson device (F < 1) or testing et al., 2000) (i.e., I do it, I do it with you, you do it
device (F (1, 226) = 1.30, p = .254, η 2p = .006), and no alone). In the ’I do it’ phase, the instructor first lec-
interaction (F (1, 226) = 2.86, p = .092, η 2p = .013). Thus, tured briefly on the material that would be covered in
we saw no significant effect of whether the testing for- VR. In the ‘I do it with you phase’, students completed
mat (2D vs. 3D drawing) was aligned with the learning the guided tour in VR. In the ‘you do it alone phase’,
format (2D vs. 3D viewing). However, it is noteworthy students worked in pairs to enact the auditory system:
that the lack of effects related to testing device suggest one student “held” an imaginary brain and the other
participants could demonstrate their knowledge sim- used their fingers to draw the pathways and point out
ilarly using the novel Looking Glass as with familiar the structures, which were listed on a slide to remind
paper/pen testing. students where to “stop” on their imaginary tour. Next,
one pair volunteered to demonstrate their imaginary
Experience questionnaire tour, which transitioned focus back to the front of the
classroom and fostered peer learning. Finally, the in-
As in Exp. 1, average enjoyment was significantly structor moved on to new material. This approach also
greater for VR than PC (t(28) = 4.08, p < .001, d = .76) leveraged the pre-training principle for effective mul-
(Figure 4B). As in Exp 1B, ease of use was also sig- timedia learning, by which people learn more deeply
nificantly greater for VR lessons than PC lessons from multimedia lessons when they know the names
(t(28) = 3.32, p = .002, d = .62).5 and characteristics of main concepts before beginning
In summary, Exp. 2 replicated Exp. 1, even though the lesson (Mayer, 2009).
testing was conducted in a different format (i.e., draw- At the end of the semester (Week 14), we conducted
ing in 3D using stereoscopic depth rather than drawing a voluntary survey in class to evaluate how the VR
on paper). Thus, aligning the assessment to 2D vs 3D lessons contributed to achieving course learning out-
viewing had no significant effect on performance. comes. Students were informed that this study was
separate from their course work and the instructor
Classroom Implementation would not know who participated (a different member
of the study team administered the survey).
Given that we developed these lessons to assist under-
graduate students learning functional neuroanatomy of Methods
the brain, we implemented and evaluated our lessons
in an undergraduate course, Psychology of Perception Students were told participation in the evaluation was
(UW–Madison, Spring 2019). Our goals were to (a) voluntary and not part of their coursework (n = 53
gather indirect measures of learning, which reflected chose to participate). Participants were given a survey
students’ self-perception of the efficacy of the Virtual that first asked them to circle “yes” or “no” to indi-
Brain lessons for learning the material and (b) obtain cate if they experienced each of the VR lessons used
feedback on which aspects of the lessons contributed to in class several weeks prior. If participants answered
their learning and what aspects could be more useful. yes, they were asked to rate how much they thought
With 25 Oculus Go VR headsets, approximately 80 the VR lesson helped advance their progress on three
students completed each 5-minute lesson within 20 learning outcomes: (a) Describe the key brain regions
5 The experience questionnaire data set includes 29/48 participants because several participants did not realize the items were split over
two screens and thus did not complete the task, and the experimenters unfortunately did not notice until later.
11The UW Virtual Brain Project • February 2021 • Preprint
involved in processing visual/auditory information edge about perception. Further work is needed to
and the pathways that connect them (System Pathways), disentangle these possibilities.
(b) Explain how sensory input from the world stimu- We also compared learning outcomes using pair-
lates the visual/auditory system (Sensory Input), and wise t-tests (Holm-corrected). Ratings were higher
(c) Describe how the way information that is processed for system pathways, the key learning outcome for
in the visual/auditory system supports the general Virtual Brain lessons, compared with sensory input
purposes of the system (System Purpose). Although (t(78) = 5.05, p < .001, d = .80) and system purpose
all three learning outcomes were relevant to the mate- (t(78) = 4.42, p < .001, d = .70). There was no sig-
rial, one was most specific to the VR lesson (Systems nificant difference between sensory input and system
Pathways). We were interested in whether students’ purpose (t(78) = −.57, p = .57, d = −.09). Given that
progress ratings on this outcome would be greater than the learning outcome factor did not interact with sen-
the other outcomes. sory system (reported above), we can conclude that the
Participants responded using a 5-point scale by se- higher ratings for system pathways carried through
lecting: “No apparent progress” , “Slight progress”, both lessons, and was not significantly affected by
"Moderate progress”, “Substantial Progress”, or “Ex- whether the lesson was done earlier or later in the
ceptional progress” (coded as 1-5). There were also semester.
two free-response questions: (1) What aspects of the The results of this assessment are limited in that
Virtual Brain activities contributed to your learning? they are based on indirect student self-reports rather
and (2) What would make the Virtual Brain activities than external, direct measures of learning gains. It
more useful for your learning? is possible that students’ reports could be attributed
to the novelty of VR in the classroom rather than the
Results and Discussion learning per se. However, novelty alone can not ex-
plain the differences seen between perceptual systems
Two coders independently recorded the ratings and and between learning outcomes, especially because the
transcribed the free-response answers. Discrepancies lesson that was rated higher (auditory system) was
were resolved by a third coder. The data can be found completed after learners had already experienced VR
at https://github.com/SchlossVRL/UW-Virtual-Brain- earlier in the semester and was therefore less novel.
Project.
Free-response feedback
Learning outcome ratings
To organize the free responses, one coder reviewed the
We analyzed data from participants that experienced transcribed responses and identified themes for each
both lessons (n = 40) so we could directly compare question based on common repeating or related key
the visual and auditory systems. On average, students words. She and two additional coders then completed
reported that VR lessons helped them make moder- a cursory thematic analysis by sorting responses into
ate to substantial progress on all learning outcomes those themes. In order for a response to be counted for
(Figure 5A). A repeated-measures ANOVA comparing a theme, at least two coders had to be in agreement.
2 perceptual systems (visual vs. auditory) × 3 learn- Figures 5B and 5C show the frequency of responses
ing outcomes (sensory input vs. system purpose vs. across themes for each question. We focus our dis-
system pathways) revealed main effects of learning cussion on themes that emerged among at least one
outcome (F (1, 78) = 16.14, p < .001, η 2p = .293) and per- quarter of the responses (the top two themes for each
ceptual system (F (1, 39) = 10.70, p = .002, η 2p = .215), question in Figures 5B-C).
with no interaction (F < 1). The main effect of system In response to what aspects of the Virtual Brain
indicated students reported more progress from the activities contributed to learning, 50/53 participants
auditory system lesson than the visual system lesson. responded (2 blank, 1 “NA”). Students (16) reported
This may have been because the auditory lesson was benefits of seeing the pathways, structures, and their
embedded in pre-VR/post-VR activities, using gradual connections. Some elaborated that this helped them
release of instruction (Bransford et al., 2000), whereas visualize the systems later while studying. In another
the visual system was not. However, given that the theme, students (15) mentioned that they were visual
auditory system lesson was used later in the semester, learners and/or that the lessons helped them visual-
we cannot rule out alternative explanations based on ize the material. In response to what would make
timing. By the time students experienced the Virtual the Virtual Brain activities more useful for learning,
Auditory System, they may have developed greater fa- 37/53 responded (9 blank, 7 “NA”/“nothing”). One
miliarity/comfort with VR and greater general knowl- theme centered on the amount of information with sug-
12The UW Virtual Brain Project • February 2021 • Preprint
Figure 5: Student evaluations of the Virtual Brain lessons following the classroom implementation. (A) Mean self-report
ratings for how the Virtual Visual System (light gray) and Auditory System (dark gray) affected progress on three learning
outcomes, ranging from no apparent progress (no app.) to moderate progress (mod.) to exceptional progress (except.). Error
bars represent standard errors of the means. (B) Frequency of free-responses sorted into each theme relating to what aspects of
the Virtual Brain contributed to learning. (C) Frequency of free-responses sorted into each theme relating to what would make
the activities more useful for learning. “Other” includes comments not directly related to the Virtual Brain and comments
that were unclear. ∗ ∗ ∗ p < .001
gestions for more details or examples in and outside that connect them), and (c) VR would be more effec-
the VR lessons (10). Another theme addressed imple- tive for achieving experience-based learning outcomes
mentation in the classroom, with recommendations for (i.e., enjoyment and ease of use). We assessed content
additional time exploring the lessons, more space in learning using a drawing/labeling task on paper (2D
the classroom, and greater clarification of the device drawing) in Experiment 1 and using a Looking Glass
controls (12). autostereoscopic display (3D drawing) in Experiment
In summary, student evaluations suggested the Vir- 2.
tual Brain lessons are valuable tools for learning about Supporting our first hypothesis, participants
system pathways in the classroom. Student evaluations showed significant content-based learning for both de-
also provided useful feedback for improving imple- vices. Against our second hypothesis, we found no
mentation. significant differences between PC and VR devices for
content-based learning outcomes. This result could
General Discussion not be explained by (mis)alignment of teaching and
testing methods as results did not differ when test-
In this study we developed and evaluated guided tours ing was done in 2D (Experiment 1) or 3D (Experiment
through 3D narrated diagrams of the human brain. 2). Supporting our third hypothesis, VR far exceeded
The lessons teach learners about functional anatomy PC viewing for achieving experience-based learning
in the visual and auditory systems. These lessons outcomes in both experiments. Thus, our UW Virtual
can be experienced on different devices, including a Brain Project lessons were effective in teaching func-
desktop PC or a VR head-mounted display (following tional neuroanatomy. Although knowledge about func-
guidelines for cross-platform access in Concannon et al. tional neuroanatomy was similarly accessible across
(2019)). We tested three hypotheses: (a) participants devices, VR was more enjoyable and easier to use. In
would learn from lessons presented on both PC and designing our lessons, we also aimed to prevent mo-
VR devices (pre-test vs. post-test scores), (b) VR would tion sickness. Responses to the SSQ for all experiments
be more effective for achieving content based learn- suggests these efforts were effective, as mean responses
ing outcomes (i.e., describe key brain regions involved were between none and slight for all symptoms, and
in processing sensory information and the pathways were never reported as severe.
13You can also read