Third Quarter 2021 Earnings Presentation - November 9, 2021
←
→
Page content transcription
If your browser does not render page correctly, please read the page content below

Third Quarter 2021 Earnings Presentation
November 9, 2021

Disclaimer

This presentation contains forward-looking statements within the meaning of the “safe harbor” provisions of the Private Securities Litigation Reform Act of 1995, including but not
limited to statements regarding Sovos Brands’ market opportunity, anticipated growth, and future financial performance, including management’s outlook for the fiscal year
ending December 25, 2021 and longer-term. These forward-looking statements are based on Sovos Brands’ current assumptions, expectations and beliefs and are subject to
substantial risks, uncertainties, assumptions, and changes in circumstances that may cause Sovos Brands’ actual results, performance, or achievements to differ materially from those
expressed or implied in any forward-looking statement.

The risks and uncertainties referred to above include, but are not limited to: competition in the packaged food industry and our product categories; the COVID-19 pandemic and
associated effects; our inability to identify, consummate or integrate new acquisitions or realize the projected benefits of acquisitions; our inability to effectively manage our
growth; our inability to successfully introduce new products or failure of recently launched products to meet expectations or remain on-shelf; our inability to expand household
penetration and successfully market our products; erosion of the reputation of one or more of our brands; issues with the major retailers, wholesalers, distributors and mass
merchants on which we rely, including if they give higher priority to other brands or products, perform poorly or declare bankruptcy; our vulnerability to decreases in the supply of
and increases in the price of raw materials and labor, manufacturing, distribution and other costs, and our inability to offset increasing costs through cost savings initiatives or
pricing; our vulnerability to the impact of severe weather conditions, natural disasters and other natural events on our manufacturing facilities, co-packers or raw material supplies;
failure by us or third-party co-packers or suppliers of raw materials to comply with food safety, environmental or other laws or regulations, or new laws or regulations; our
dependence on third-party distributors and third-party co-packers, including one co-packer for the substantial majority of our Rao’s Homemade sauce products; failure to protect,
or litigation involving, our tradenames or trademarks and other rights; our level of indebtedness and our duty to comply with covenants under each of our credit facilities; and the
interests of our majority stockholder may differ from those of public stockholders. These risks and uncertainties are more fully described in Sovos Brands’ filings with the SEC. Sovos
Brands operates in a very competitive and rapidly changing environment. New risks emerge from time to time. It is not possible for management to predict all risks, nor can Sovos
Brands assess the impact of all factors on its business or the extent to which any factor, or combination of factors, may cause actual results to differ materially from those contained
in any forward-looking statements Sovos Brands may make.

In light of these risks, uncertainties and assumptions, Sovos Brands cannot guarantee that future results, levels of activity, performance, achievements, or events and circumstances
reflected in the forward-looking statements will occur. Forward-looking statements represent managements’ beliefs and assumptions only as of the date of this presentation. Sovos
Brands disclaims any obligation to update forward-looking statements except as required by law.

SOVOS™, SOVOS BRANDS™, RAO'S®, RAO'S HOMEMADE®, NOOSA®, BIRCH BENDERS® and MICHAEL ANGELO'S® are
trademarks of Sovos Brands and its subsidiaries.

                                                                                                                                                                                           1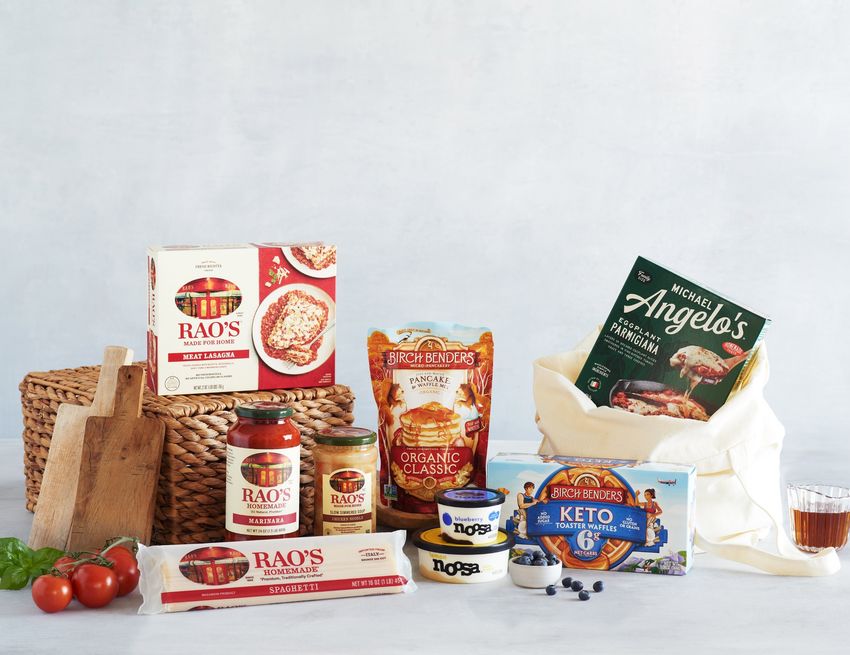
Non-GAAP Financial Information

Sovos Brands, Inc.’s results are determined in accordance with generally accepted accounting principles in the United States (“GAAP”). This presentation contains certain financial
performance measures that are not determined in accordance with GAAP. Management believes these non-GAAP measures provide additional useful information to assess the
financial and operational performance of the Company. These non-GAAP financial measures are presented for supplemental informational purposes only, have important
limitations as analytical tools, should not be considered a substitute for financial information presented in accordance with GAAP and may be different from similarly titled non-
GAAP measures used by other companies. Reconciliations of these non-GAAP financial measures to their most directly comparable GAAP financial measures are included in the
Appendix to this presentation. For more information regarding the Sovos Brands’ use of non-GAAP measures, please today’s earnings release and our filings with the SEC.

                                                                                                                                                                                      2
Today’s Presenters

                     Todd Lachman
                     President & Chief Executive Officer

                                  Chris Hall
                                  Chief Financial Officer

                                                            3
Dedicated to bringing today's

     consumers simple,       great-
 tasting food that fits the way
   they live. Portfolio of   unique
      brands that have exciting
                                      Delicious Food for Joyful Living
growth potential, combining
     industry expertise with fresh
thinking to bring our products into   Products That People Love
      more homes across America

                                      One-of-a-Kind Brands

                                      Passionate for Our People

                                                                         4
Portfolio of One-of-a-Kind Brands in Large, Disruptable Categories

           Rich Heritage                            Italian Roots                    Aussie Born, Colorado Bred             Better-For-You Indulgence
 In 1991, Frank Pellegrino Sr., third-    Recipes inspired by Nonna Foti who         Australian culture and Colorado      Bringing food freedom to consumers
  generation Rao’s family, launched                 grew up in Sicily               freshness to make one of the best          in guilt-inducing categories
 first Rao’s Homemade Pasta Sauce                                                             tasting yogurts

        Real, Slow Cooked                       The Power of “No”                     High-Quality Ingredients                 Clean-Label, Delicious
 Simmered slowly and made in small        Michael Angelo’s says “no” to fillers,   High-quality ingredients with creamy   Delicious, clean-label, and functional
   batches with fine ingredients, like   low-cost replacers, and preservatives,      texture, and pure North American       products in high-guilt categories
 olive oil, hand-picked tomatoes from     using high-quality ingredients such as       honey processed in our facility     made with whole wheat, almond
          Italy, and fresh basil                   fresh ricotta cheese            located on Morning Fresh Dairy Farm          flours and cassava starch

       Elevated Homemade                    Homemade Taste in a Box                           Made Fresh                       Meant for All to Enjoy
   Brings authentic Italian cuisine to    Premium, authentic and homemade            Made with whole milk from cows       For the organic, keto, paleo, plant-
            home kitchens                    alternative in the frozen aisle            never treated with rBST           based, and everyday Joe consumer

                                                                                                                                                                   5
One of the Most Exciting Food Companies in the Packaged Food Sector

                                                                                                                         Rare Combination of                                                                                          Massive Whitespace
         High-Growth, Disruptive Brands
                                                                                                                     Double-Digit Growth, Scale and                                                                                   Opportunity Through
            Driving Outperformance
                                                                                                                        Robust Cash Generation                                                                                  Distribution and HH Penetration

                         Fastest growing                                                                                $695mm                                            +25%                                                                             ≤10%
                                                                                                                      LTM Sept-21 brand                               YoY LTM Sept-21
                    food company of scale in the                            U.S.1                                                                                                                                                   household penetration across each brand7
                                                                                                                          net sales4                                      growth4

                                         ~25pp                                                                                                      16.3%                                                                                            ~$53bn TAM
                     outperformance compared to our                                                                                              LTM Sept-21                                                                                across current and future potential
                          categories combined2                                                                                               adj. EBITDA margin5                                                                                    product categories8

                               Leading NPS                                                                                                           >90%                                                                                          M&A platform
                                                                                                                                                LTM Sept-21
                          scores across our                categories3                                                                                                                                                                    with a proven integration playbook
                                                                                                                                        free cash flow conversion6

Source: SPINS, IRI, Third Party A&U Study. 1 U.S. multi-outlet (“MULO”) retail and natural channel information from SPINS for the 52 weeks ended July 11, 2021 as compared to the 52 weeks ended December 28, 2019 and includes food companies with
over $500 million in retail sales in the 52 weeks ended July 11, 2021 in the frozen, grocery, produce and refrigerated departments, and excludes beverage companies. 2 IRI (MULO), total Sovos dollar sales YoY growth compared to total categories YoY
growth for 52 weeks ended 06/13/2021 denoted in percentage points, combined categories include the pasta and pizza sauce, ready-to-serve soup, dry pasta, frozen dinner, baking mix (inclusive of pancake and waffle mix), frosting, frozen waffle,
syrup, and yogurt categories. 3 Third-Party A&U studies and taste tests. 4 Brand net sales, includes Birch Benders’ net sales for the FY periods 2018, 2019 and 2020 and noosa’s net sales for the FY period 2018, see Appendix for “Brand Net Sales
Reconciliation”. 5 Adjusted EBITDA margin is calculated by dividing Adjusted EBITDA by GAAP net sales for the applicable period, see Appendix for “Adjusted EBITDA Reconciliation”. 6 Free cash flow defined as (Adj. EBITDA – Purchases of property and
equipment) and free cash flow conversion defined as (Adj. EBITDA – Purchases of property and equipment) / Adj. EBITDA. 7 IRI (MULO) for 52 weeks ended 06/13/2021 for noosa, Michael Angelo’s and Birch Benders; IRI (MULO) for 52 weeks ended                                    6
10.03.2021 for Rao’s. 8 U.S. multi-outlet retail and natural channel information from SPINS, excludes both the double impact of the frozen entrée category captured in Rao’s existing TAM and Michael Angelo’s existing TAM and the double impact of the
spoonable yogurt category captured in Birch Benders’ future potential TAM and noosa’s existing TAM.
Pioneering a New Approach to Packaged Food
A purposefully-built food platform and growth accelerator…
Brands Team
Category disruptors with long- Hand-selected management team
term growth potential Centered around a focused
Underpenetrated brands with portfolio
premium positioning Nimble and growth-oriented
Food 2.0
Products M&A
Clean label, high-quality ingredients Repeatable M&A playbook
Wins on taste and consumer preference Capitalizing on growth and margin
accretive opportunities
Infrastructure CPG Capabilities
Scalable for future M&A Advantaged go-to-market platform
Not beholden to legacy assets Proven R&D and innovation capabilities
… with scale and profitability early in our journey
7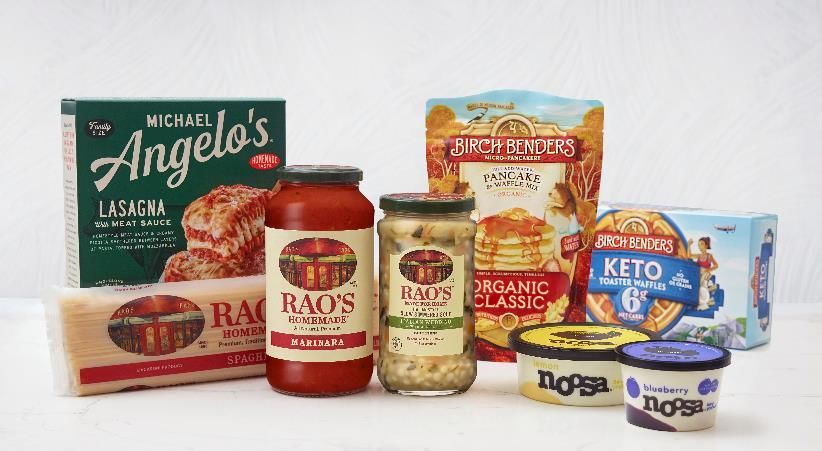
Our Brands Share Common Attributes, Target the Same Consumers and Use
a Shared Playbook for Growth
Shared
Shared Brand Shared Shared Playbook Infrastructure &
Attributes Consumer Base for Growth Robust
Capabilities
Delicious with high-quality Young and family-oriented Household penetration as Scaled selling organization
ingredients consumers foundation with strong customer
relationships
Premium brands with authentic Passionate about taste Increased distribution Category-disrupting
heritages and quality innovation capabilities
Enhanced brand awareness
Leading brand affinity Value clean ingredients Ability to rapidly extract
synergies post-acquisitions
New category innovation to
Category disruptors Higher relative basket sizes increase TAM Growth-oriented supply chain
organization
TAM whitespace Strong brand loyalty M&A and rapid integration
Comprehensive shared
services organization
8
Rao’s Anchors Our Diversified Revenue Mix, Driving Consistent Performance

                                                                                               8%

                                                                                                                                                                                                       Portfolio of diverse brands across
                                                               11%
        Breakdown                                                                                                                                                                                      center-of-store categories
        by Brand1                                                                                $695mm
                                                                                             LTM Sept-21 organic                                      56%
                                                                                               brand net sales

                                                                                                                                                                                                          Exposure to all day parts and
                                                             25%
                                                                                                                                                                                                          multiple meal occasions

                                                                                 Pancake & Waffle Mix
                                                                                         7%
                                                                                                                                                                                                       Capabilities across three
                                                    Frozen Entrées &
                                                        Waffles
                                                                                                                                                                                                       temperature states
                                                         17%
                                                                                                                                                    Sauce
          Breakdown                                                                              $695mm                                             49%
          by                                                                                  LTM Sept-21organic                                                                                         Platform designed to capture
                                                                                                brand net sales
          Category1                                                                                                                                                                                      synergies as we scale and add
                                                                     Yogurt
                                                                                                                                                                                                         new brands
                                                                      24%

                                                                                                      Soup/Pasta
                                                                                                         3%

Note: Brand net sales includes Birch Benders’ net sales for the FY periods 2018, 2019 and 2020 and noosa’s net sales for the FY period 2018, see Appendix for “Brand Net Sales Reconciliation”. Frozen Entrées & Waffles includes MA and Rao’s   9
Frozen Entrees and BB Frozen Waffles; Pancake & Waffle Mix includes Cups, Syrup and Baking Mix / Frosting
1 Breakdown by Brand / Category as a % of Gross Sales.
We Have Experienced Rapid Growth
Organic Brand Net Sales and GAAP Net Sales ($mm)1
Fastest growing food
company of scale in the U.S.2
$695 +25%3 Rao’s sauce market share reached all-
$609 time high of 13.2%3
+44% noosa outperformed the yogurt
$422 category in unit sales for last 34
+13%
$374
months4
$692 +37%3
$560 Proven track record of
+44%
$388 accelerating growth
+91%
$203
Ample whitespace ahead to
2018 2019 2020 LTM Sept-21 sustain growth
Organic Brand Net Sales Growth1 Sustained growth trajectory
GAAP Net Sales (Excluding Acquisitions) Growth into 2021 post-COVID environment
Organic Brand Net Sales1
GAAP Net Sales (Excluding Acquisitions)
1 Brand net sales includes Birch Benders’ net sales for the FY periods 2018, 2019 and 2020 and noosa’s net sales for the FY period 2018, see Appendix for “Brand Net Sales Reconciliation”. 2 U.S. multi-outlet (“MULO”) retail and natural channel
information from SPINS for the 52 weeks ended July 11, 2021 as compared to the 52 weeks ended December 28, 2019 and includes food companies with over $500 million in retail sales in the 52 weeks ended July 11, 2021 in the frozen, grocery, 10
produce and refrigerated departments, and excludes beverage companies. 3 LTM Sept 2021 YoY growth compared to LTM Sept 2020. 3 IRI (MULO) L13W ended 10/03/2021. 4 YoY growth from the 4 weeks ended 03/24/2019 to the 4 weeks
ended 10/03/2021 according to IRI (MULO).Financials
113Q 2021 Results
Net Sales Adjusted EBITDA1
$178.7 $25.8
$136.9 $19.7
3Q20 3Q21 3Q20 3Q21
+31% +31%
Strong growth in shipments for Rao’s and noosa Adj. EBITDA margin of 14.4% consistent with last
year despite inflationary pressure
2021 Includes ~$14M sales from acquisition of
Birch Benders in 4Q20 Higher logistics costs and inflation in 3Q 201
Brand net sales +17% y/y Incremental costs to expedite product supply for
strong demand during unprecedented port
congestion offset by lower operating expenses
1 Adjusted EBITDA and Adjusted EPS are non-GAAP Measures. See appendix for a reconciliation of non-GAAP measures to most directly comparable GAAP measures. 12FY 2021 Outlook
$710-$715M
Net sales
$113-$115M
Adjusted EBITDA1
~16%
Adjusted EBITDA margin1
• Q4 2021 includes full absorption of public company costs
• Q4 2021 gross margin improves from Q3 2021 levels; with gross margin in 2022
expected to grow due to pricing and productivity actions
• Long term debt reduced in Q4 2021 by post-IPO proceeds of ~$299 million
• Shares outstanding ~101 million in Q4 2021
1 Adjusted EBITDA and Adjusted EBITDA margins are non-GAAP Measures. Sovos Brands cannot provide a reconciliation between its forecasted adjusted EBITDA and a forecasted net income without unreasonable effort due to the inherent difficulty of
forecasting and providing reliable estimates for certain items. These items may reside outside the Company’s control and vary greatly between periods and could significantly impact future financial results. 13Appendix
14CONDENSED CONSOLIDATED STATEMENTS OF OPERATIONS
(amounts in thousands, except for per share data)
(Unaudited)
15
1 Adjusted EBITDA margin is calculated by dividing Adjusted EBITDA by GAAP net sales for the applicable period, see Appendix for “Adjusted EBITDA Reconciliation”CONDENSED CONSOLIDATED STATEMENTS OF OPERATIONS
(amounts in thousands, except for per share data)
(Unaudited)
16CONDENSED CONSOLIDATED STATEMENTS OF OPERATIONS
(amounts in thousands, except for per share data)
(Unaudited)
17RECONCILIATION OF NON-GAAP FINANCIAL MEASURES
(amounts in thousands, except for per share data)
(Unaudited)
13 Weeks Ended 39 Weeks Ended
September 25, September 26, September 25, September 26,
(In thousands) 2021 2020 2021 2020
Net income (loss) $ (4,614) $ 2,236 $ 5,759 $ 11,304
Interest 12,547 4,293 24,613 14,912
Income tax (expense) benefit (3,497) 226 (8,213) (4,698)
Depreciation and amortization 9,494 8,287 28,302 24,747
EBITDA 20,924 14,590 66,887 55,661
Transaction and integration costs(1) 468 3,894 3,978 7,276
Initial public offering readiness(2) 3,117 576 5,176 730
Non-cash stock-based compensation(3) 979 483 2,084 1,456
Supply chain optimization(4) — (3) — 989
Non-recurring costs(5) 287 145 10,529 865
Adjusted EBITDA $ 25,775 $ 19,685 $ 88,654 $ 66,977
EBITDA margin 11.7 % 10.7 % 12.6 % 14.0 %
Adjusted EBITDA margin 14.4 % 14.4 % 16.7 % 16.8 %
(1) Consists of transaction costs and certain integration costs associated with the Birch Benders Acquisition as well as costs associated with incomplete potential acquisitions and substantial one-time costs
related to a large, uncompleted transaction. For the 13 weeks and 39 weeks ended September 25, 2021, $298 and $298, respectively, are included in cost of sales, and $170 and $3,680, respectively, are
included in total operating expenses. For the 13 weeks and 39 weeks ended September 26, 2020, these costs are included in total operating expenses.
(2) Consists of costs associated with preparing for an IPO, primarily comprised of professional fees. For all periods presented, these costs are included in total operating expenses.
(3) Consists of non-cash equity-based compensation expense associated with the grant of equity-based compensation provided to officers, directors and employees. For all periods presented, these costs
are included in total operating expenses.
(4) Consists of expenses for professional fees related to supply chain manufacturing optimization and costs associated with SKU rationalization and certain other strategic initiatives. For the 13 weeks and
39 weeks ended September 25, 2021, all costs are included in total operating expenses. For the 13 weeks and 39 weeks ended September 26, 2020, $0 and $586, respectively, are included in cost of sales,
and ($3) and $403, respectively, are included in total operating expenses.
(5) Consists of costs related to loss on extinguishment of debt, costs associated with the dividend, an ERP implementation related to integrating acquisitions, employee separation costs, and legal
settlement and other costs related to the exit of facilities. For all periods presented, these costs are included in total operating expenses
18
1 Adjusted EBITDA margin is calculated by dividing Adjusted EBITDA by GAAP net sales for the applicable period, see Appendix for “Adjusted EBITDA Reconciliation”RECONCILIATION OF NON-GAAP FINANCIAL MEASURES
(amounts in thousands, except for per share data)
(Unaudited)
13 Weeks Ended 39 Weeks Ended
September September September September
(In thousands) 25, 2021 26, 2020 25, 2021 26, 2020
Selling, general and administrative $ 31,189 $ 33,311 $ $ 91,367 $ 83,510
Depreciation and amortization 7,236 6,051 21,631 17,923
Loss on extinguishment of debt - — 9,717 —
Total operating expenses 38,425 39,362 122,715 101,433
Transaction and integration costs(1) (170) (3,894) (3,680) (7,276)
Initial public offering readiness(2) (3,117) (576) (5,176) (730)
Non-cash equity-based compensation(3) (979) (483) (2,084) (1,456)
Supply chain optimization(4) — 3 - (403)
Non-recurring costs(5) (287) (145) (10,529) (865)
Total adjusted operating expenses $ 33,872 $ 34,267 $ 101,246 $ 90,703
(1) Consists of transaction costs and certain integration costs associated with the Birch Benders Acquisition, as well as costs associated with incomplete potential acquisitions and substantial one-time
costs related to a large, uncompleted transaction. For the 13 weeks and 39 weeks ended September 25, 2021, $298 and $298, respectively, are included in cost of sales, and $170 and $3,680,
respectively, are included in total operating expenses. For the 13 weeks and 39 weeks ended September 26, 2020, these costs are included in total operating expenses.
(2) Consists of costs associated with preparing for an IPO, primarily comprised of professional fees. For all periods presented, these costs are included in total operating expenses.
(3) Consists of non-cash equity-based compensation expense associated with the grant of equity-based compensation provided to officers, directors and employees. For all periods presented, these
costs are included in total operating expenses.
(4) Consists of expenses for professional fees related to supply chain manufacturing optimization and costs associated with SKU rationalization and certain other strategic initiatives. For the 13 weeks and
39 weeks ended September 25, 2021, all costs are included in total operating expenses. For the 13 weeks and 39 weeks ended September 26,2020, $0 and $586, respectively, are included in cost of sales,
and ($3) and $403, respectively, are included in total operating expenses.
(5) Consists of costs related to loss on extinguishment of debt, costs associated with the dividend, an ERP implementation related to integrating acquisitions, employee separation costs, and legal
settlement and other costs related to the exit of facilities. For all periods presented, these costs are included in total operating expenses.
19RECONCILIATION OF NON-GAAP FINANCIAL MEASURES
(amounts in thousands, except for per share data)
(Unaudited)
(1) Consists of transaction costs and certain integration costs associated with the Birch Benders Acquisition as well as costs associated with incomplete potential acquisitions and substantial one-time costs
related to a large uncompleted transaction. For the 13 weeks and 39 weeks ended September 25, 2021, $298 and $298, respectively, are included in cost of sales, and $170 and $3,680, respectively, are
included in total operating expenses. For the 13 weeks and 39 weeks ended September 26, 2020, these costs are included in total operating expenses.
(2) Consists of costs associated with preparing for an IPO, primarily comprised of professional fees. For all periods presented, these costs are included in total operating expenses.
(3) Consists of non-cash equity-based compensation expense associated with the grant of equity-based compensation provided to officers, directors and employees. For all periods presented, these costs are
included in total operating expenses.
(4) Consists of expenses for professional fees related to supply chain manufacturing optimization and costs associated with SKU rationalization and certain other rationalization initiatives. For the 13 weeks and
39 weeks ended September 25, 2021, these costs are included in total operating expenses. For the 13 weeks and 39 weeks ended September 26, 2020, $0 and $586, respectively, are included in cost of sales,
and ($3) and $403, respectively, are included in total operating expenses.
(5) Consists of costs related to loss on extinguishment of debt, costs associated with the dividend, an ERP implementation related to integrating acquisitions, employee separation costs, and legal settlement
and other costs related to the exit of facilities. For all periods presented, these costs are included in total operating expenses.
(6) Amortization costs associated with acquired trade names and customer lists.
(7) Tax effect was calculated using the Company's adjusted annual effective tax rate.
(8) Represents the removal for remeasurement of deferred taxes related to intangibles for changes in deferred rate and the removal of the tax effect of non-deductible transaction costs.
20RECONCILIATION OF NON-GAAP FINANCIAL MEASURES
(amounts in thousands, except for per share data)
(Unaudited)
(1) Consists of transaction costs and certain integration costs associated with the Birch Benders Acquisition as well as costs associated with incomplete potential acquisitions and substantial one-time costs
related to a large, uncompleted transaction.
(2) Consists of costs associated with preparing for an IPO, primarily comprised of professional fees.
(3) Consists of non-cash equity-based compensation expense associated with the grant of equity-based compensation provided to officers, directors and employees.
(4) Consists of expenses for professional fees related to supply-chain manufacturing optimization and costs associated with SKU rationalization and certain other strategic initiatives.
(5) Consists of costs related to loss on extinguishment of debt, costs associated with the dividend, an ERP implementation related to integrating acquisitions, employee separation costs, and legal settlement
and other costs related to the exit of facilities.
EBITDA margin and Adjusted EBITDA margin are calculated by dividing EBITDA and Adjusted EBITDA by net sales for the applicable period. 21
Free cash flow defined as Adj. EBITDA – Purchases of property and equipment
Free cash flow conversion defined as (Adj. EBITDA – Purchases of property and equipment) / Adj. EBITDAYou can also read