Three state majority vote model on small world networks - Nature
←
→
Page content transcription
If your browser does not render page correctly, please read the page content below
www.nature.com/scientificreports
OPEN Three‑state majority‑vote model
on small‑world networks
Bernardo J. Zubillaga1*, André L. M. Vilela1,2, Minggang Wang3,4, Ruijin Du5,
Gaogao Dong5 & H. Eugene Stanley1
In this work, we study the opinion dynamics of the three-state majority-vote model on small-world
networks of social interactions. In the majority-vote dynamics, an individual adopts the opinion of
the majority of its neighbors with probability 1-q, and a different opinion with chance q, where q
stands for the noise parameter. The noise q acts as a social temperature, inducing dissent among
individual opinions. With probability p, we rewire the connections of the two-dimensional square
lattice network, allowing long-range interactions in the society, thus yielding the small-world property
present in many different real-world systems. We investigate the degree distribution, average
clustering coefficient and average shortest path length to characterize the topology of the rewired
networks of social interactions. By employing Monte Carlo simulations, we investigate the second-
order phase transition of the three-state majority-vote dynamics, and obtain the critical noise qc , as
well as the standard critical exponents β/ν , γ /ν , and 1/ν for several values of the rewiring probability
p. We conclude that the rewiring of the lattice enhances the social order in the system and drives
the model to different universality classes from that of the three-state majority-vote model in two-
dimensional square lattices.
Over the past few decades, there has been widespread interest in the implementation of tools and methods of
statistical mechanics for the study of the behavior and dynamics of social systems; in particular, dynamics of
opinion formation1–21. Statistical physics studies the complex behavior of macroscopic systems in terms of the
basic interaction laws between their many fundamental components. Such complexity shows the emergence of
collective effects in the system which are not reducible to the behavior of any individual component or agent.
Microscopic models of opinion formation do not intend to mimic human opinion formation dynamics in a
completely rigorous way. Instead, they reduce such processes to rather simple interaction laws between the
components with very few parameters aiming to understand the possible fundamental mechanisms at play that
give rise to macroscopic c omplexity17,18,22.
The dynamics of opinion formation in societies ensue not only from rational thought of individuals, but also
from emotional behaviors which are a reflection of the rich social psychology of the influences and interactions
between individuals. An example of such a phenomenon is herding, whereby individuals tend to follow the
opinion or behavior of their n eighbors16,23–25. Herding is understood to play a key role in human behavior and
in the animal kingdom, from collective behaviors of flocks of birds and schools of fish to riots, strikes, sport-
ing events and opinion formation in social contexts, such as the collective irrational behavior of investors in a
financial market who follow the trends of their neighbors and have a propensity to overreact to the arrival of
news when buying or s elling26.
The majority-vote model is a widely studied agent-based model of opinion formation in statistical
mechanics12,13,27–32. The three-state version of the model assumes that individuals are nodes placed in a social
network in any one of three possible states or opinions, interacting with their nearest neighbors, exerting influ-
ence on them and being influenced by them in return. In this model, the agent will agree with the majority state
of its neighbors with probability 1 − q, or dissent from it with probability q, also known as the noise parameter.
The noise parameter is a measure of the social temperature of the system, thus inducing the different opinion
clusters. The three-state majority-vote model (MVM3) exhibits a second-order phase transition in a square lat-
tice network with critical noise parameter qc ≈ 0.118 and with standard critical exponents β/ν, γ /ν and 1/ν12–14.
1
Center for Polymer Studies and Department of Physics, Boston University, Boston 02115, USA. 2Física de
Materiais, Universidade de Pernambuco, Recife, Pernambuco 50100‑010, Brazil. 3School of Mathematical Science,
Nanjing Normal University, Nanjing 210042, Jiangsu, People’s Republic of China. 4Department of Mathematics,
Nanjing Normal University Taizhou College, Taizhou 225300, Jiangsu, People’s Republic of China. 5Center of Energy
Development and Environmental Protection, Jiangsu University, Zhenjiang 212013, Jiangsu, People’s Republic of
China. *email: berzub@bu.edu
Scientific Reports | (2022) 12:282 | https://doi.org/10.1038/s41598-021-03467-6 1
Vol.:(0123456789)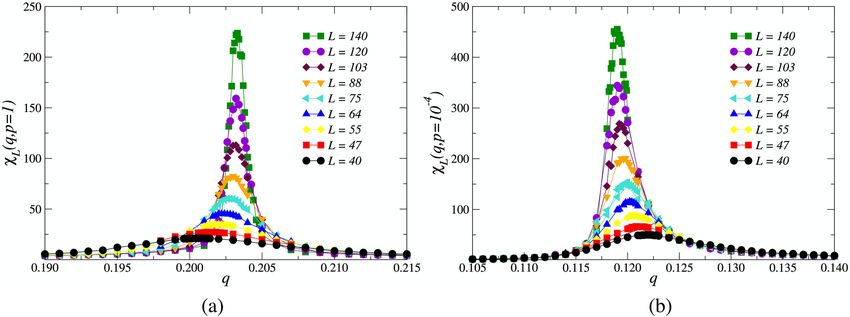
www.nature.com/scientificreports/
Figure 1. Illustration of the rewiring prescription for the construction of small-world networks. The network
starts as a regular lattice shown in (a). One obtains (b) after the random rewiring of the first link. In (c) we
illustrate the final result once the rewiring scheme is complete.
With the ever-increasing computational power, different variations of the majority-vote model have been
considered, including agent differentiation and diffusion, three-state model generalizations and complex noise
distributions15,33,34. Also, the recent development of complex network science as a statistical-mechanical frame-
work for the study of real networks has also been a contributing factor in the study of complex systems and their
dynamics35–38.
The original three-state majority-vote model was studied by Tomé on square lattices with periodic boundary
conditions12,13. Since then, three-state majority-vote dynamics have been studied on non-trivial topologies. For
example, the contributions of Melo, Pereira and Moreira extended the study of the dynamics to the topology of
random graphs14. Vilela et al. delved into the study of the model on scale-free networks, namely Barabási-Albert
networks, and three dimensional regular lattices39. Both investigations on the three-state majority-vote model
conclude that the critical noise required to extinguish consensus increases with the average degree of the network.
In this context, we investigate the dynamics of the three-state majority-vote model on small-world networks.
This network enables us to highlight the effects of link disorder, while it keeps the total numbers of nodes and
links fixed. Under the small-world link structure, the average degree of the network is a conserved quantity, in
contrast with average degree dependence of the majority-vote dynamics investigated on previous works. We focus
on exposing the effects of a random link-rewiring scheme on the second-order phase transitions in the system.
Additionally, this work also provides a sense of closure to the study of the three-state majority-vote dynamics
on complex networks mainly investigated.
The small-world effect is the empirical observation that the majority of the pairs of nodes in a great number
of real networks appear to be connected by paths of short lengths, even though the sizes of the complex net-
works are typically very large. More concretely, in a small-world network with N nodes, the average distance ℓ
between two randomly chosen nodes scales as ℓ ∼ log N 38. This property of complex networks was given fame
and renown thanks to social psychologist Stanley Milgram’s six degrees of separation experiment40–42. Empirical
studies of epidemiology and pandemics reveal that the small-world property became possible with long-range
and inexpensive transportation on railroads, airlines and ocean l iners43. Systems such as the World Wide Web,
the Internet and social networks exhibit the small-world property.
The Watts-Strogatz model is a network construction algorithm capable of generating graphs which exhibit
the small-world property, with short average path lengths and high clustering coefficients35,36,38. The algorithm
randomly rewires links in a regular network with probability p, which is a tunable parameter, thereby being
capable of interpolating between regular lattices and disordered graphs.
In order to explore the small-world effect on the phase transitions of the three-state majority-vote model,
we construct the networks with a two-dimensional square lattice subject to a rewiring scheme, whereby we
randomly rewire the links in this lattice with probability p, in similarity with the Watts-Strogatz model. We use
Monte Carlo simulations and finite-size scaling techniques to calculate the critical noise parameter qc , and to
obtain the order-disorder phase diagram of the system. We also perform Monte Carlo simulations to estimate
the standard critical exponents β/ν , γ /ν , and 1/ν for the rewiring probabilities p considered.
This paper is organized as follows. In Sect. "Square lattices and small‑world networks",we describe the random
link-rewiring prescription for the construction of small-world networks starting from a square lattice. We also
investigate the main topological features of these networks, as revealed by degree distributions, average clustering
coefficients and average shortest path lengths. In Sect. "The model", we describe the model and the dynamics
of the social agents, as well as the macroscopic observables of interest to study the phase transitions. In Sect.
"Numerical results and discussion", we present the numerical results of the Monte-Carlo simulations, including
the phase diagram of the system and finite-size scaling results. In Sect. "Concluding remarks" we present our
final remarks and conclusions.
Square lattices and small‑world networks
We consider the three-state majority-vote model in a small-world network, in which each node in the network
represents an individual and the links represent nearest-neighbor interactions between pairs of nodes.
In this work, the construction of the structures of small-world networks follows a link-rewiring scheme,
illustrated in Fig. 1. We assemble a two-dimensional square lattice with L nodes per side and periodic boundary
conditions, for a total of N = L × L agents or individuals. We consider each node in the network sequentially
and, for a given node, i, the links that connect it to its neighbors to the right and to the bottom are rewired with
Scientific Reports | (2022) 12:282 | https://doi.org/10.1038/s41598-021-03467-6 2
Vol:.(1234567890)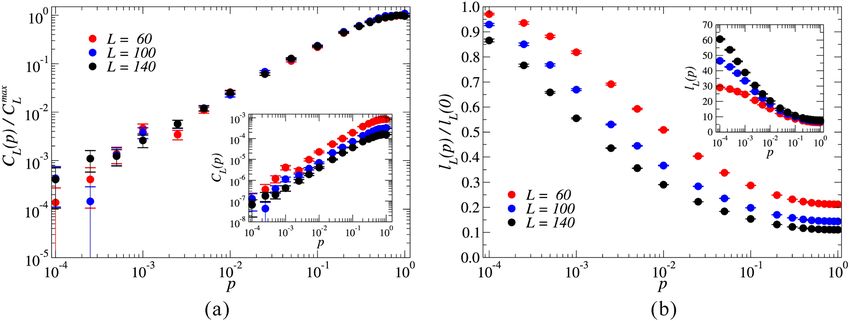
www.nature.com/scientificreports/
0
10
p = 0.00 p = 0.01
-2
10
-4
10
-6
10
P(k) 10
0
p = 0.10 p = 1.00
-2
10
-4
10
-6
10
0 2 4 6 8 10 12 14 16 0 2 4 6 8 10 12 14 16
k
Figure 2. Degree distributions P(k) of complex networks built according to the rewiring scheme for four values
of the rewiring probability, p = 0, 0.01, 0.1, 1 (shown in black, red, green and yellow, respectively). Each sub-
figure in the panel corresponds to a fixed value of p averaged over a total of 1000 different networks, starting
from initial two-dimensional square lattices of size L = 140 for a total of N = 19600 nodes per network.
probability p to some other nodes in the network chosen at random. This scheme is forbidden from rewiring
the link to another of the original nearest neighbors of node i from the initial square lattice. Double connections
between the same pairs of nodes are also forbidden. In this way, after repeating the procedure over the N nodes,
the network is built with the small-world property enabled. It is known that even a minimal number of rewir-
ings, denoted by small values of p, is enough to produce the small-world property, shortening the diameter of
the network appreciably. In contrast, for p = 1, one obtains topologies that have maximum disorder. Therefore,
p is a parameter that controls the topology of the network, interpolating from a square lattice ( p = 0) to a small-
world network, to a maximally disordered network ( p = 1), as it increases.
The size of the giant component of the small-world networks built according to the link-rewiring scheme is
exactly equal to the size of the whole network for all values of p, including p = 1. In this context, the rewiring
scheme produces networks with only a single component for every value of p explored. The investigation of
the numbers of components in the networks and of their respective sizes revealed that there was not a single
instance of the realization of the disorder, p = 0, amongst the tens of thousands of networks built, that produced
multiple disconnected components or isolated nodes. In other words, the network remains cohesively as a single
component as the links are rewired.
The effect of changing the rewiring probability p on the topology of the network can be partially illustrated
by investigating the degree distribution of the network. Figure 2 presents the degree distribution of the networks
built according to the random rewiring prescription described earlier. In the p = 0 limit, the degree distribu-
tion is a Kronecker delta function centered around k = 4, as expected for a two-dimensional regular lattice with
periodic boundary conditions. Increasing the value of p has the effect of widening the distribution as some nodes
gain connections and others lose them via random rewiring, thereby decreasing the diameter of the network
and producing the small-world effect. For p = 1, we rewire all the links of the original square lattice. Note that
the peak of the distribution remains centered around k = 4 . Since no links are being added or removed from
the network during the rewiring procedure, the total number of links in the network is conserved. Therefore,
the average of the degree distribution is also fixed at �k� = 4, irrespective of p.
In this work, we rewire a square lattice network to yield the small-world structure. Given the differences
between the square lattice and the ring-like regular networks in which the Watts-Strogatz algorithm is initi-
ated, a substantive contrast is observed in the behavior of the clustering coefficient. Indeed, using the Watts-
Strogatz method, the average clustering coefficient is a monotonically decreasing function of the link-rewiring
probability38. For the networks explored in this investigation, the local clustering coefficient is zero for all nodes
when p = 0, since the network is a square lattice with periodic boundary conditions. As p increases, we expect
the increasing disorder to enhance the community structure between the neighbors of an individual node in the
network44. We illustrate this behavior in Fig. 3a, where we plot the average clustering coefficient CL (p), which
increases with p for the values of L explored in this work. The curves are normalized relative to the maximum
average clustering coefficient measured CLmax = max p CL (p) for each value of L. The average clustering coefficient
CL (p) is the arithmetic average of all the local clustering coefficients. Each data point averages over 1000 different
networks built in accordance with the square lattice link-rewiring scheme.
Scientific Reports | (2022) 12:282 | https://doi.org/10.1038/s41598-021-03467-6 3
Vol.:(0123456789)
www.nature.com/scientificreports/

                                           Figure 3.  (a) Average clustering coefficient CL (p) of networks with L = 60, 100, 140, built according to the
                                           link-rewiring scheme as a function of p. Each data point averages over 1000 different networks. The rates of
                                           growth of the CL (p) seem to be universal and consistent, irrespective of the values of L explored in this work, as
                                           denoted by the collapse of the curves of CL (p)/CLmax . (b) Average shortest path length ℓL (p) of networks with
                                           L = 60, 100, 140 built according to the square lattice link-rewiring scheme as a function of p. Each data point
                                           averages over 100 different networks.

                                                In Fig. 3b, we show the effect of the square lattice link-rewiring scheme on the average shortest path length
                                           ℓL (p). The curves are normalized relative to ℓL (0). For a given pair of nodes (i, j) in the network, the trajectory
                                           with minimal path lengths (dij ) connecting i and j is considered. The average shortest path length ℓL (p) is com-
                                           puted as the arithmetic average of all such shortest path lengths dij between all of the N(N − 1)/2 pairs of nodes
                                           (i, j) in the network. As expected, the networks are susceptible to the increase of p, showing that even a small
                                           fraction of links rewired is sufficient to effectively shrink the network’s diameter. Indeed, rewiring only 1% of the
                                           links in the networks with L = 140, for instance, is enough to drop ℓ to approximately 30% of the value it would
                                           have in the case of the square lattice. These networks settle, at maximum rewiring p = 1, at a final average shortest
                                           path length that is roughly 10% that of the square lattice p = 0 case. This shows the emergence of the small-world
                                           effect in the networks considered in this work as topological disorder is increased by random link-rewiring.

                                           The model
                                           With the network of social interactions successfully built, we execute the dynamics of the three-state majority-
                                           vote model. In this model, each agent’s opinion is represented by a node and it assumes any one of three available
                                           states σ ∈ {1, 2, 3} at any instant in time. These states represent three possible opinions on a given social subject
                                           or referendum. For example, in a financial context, such states could represent a desire to purchase a unit of an
                                           asset, to sell a unit of an asset or to remain neutral/inactive. It may also represent a citizen’s vote in an election
                                           where there are three available political options: left-wing, right-wing or centre.
                                               The update of an opinion follows a probabilistic prescription. The state of each individual tends to follow the
                                           local majority, i.e., there is a tendency to agree with the opinion of the majority of its nearest neighbors with prob-
                                           ability 1 − q, or to dissent from it with probability q. Consider agent i in the event of a single majority state of its
                                           neighbors. The agent i may adopt it with probability 1 − q, whilst each of the two local minority opinions may be
                                           adopted by i with probability q/2. In the event of a tie between two local majority states, agent i shall assume any
                                           of those two opinions with probability (1 − q)/2 each, and the opinion of the local minority with probability q.
                                               Let ki,σ represent the number of nearest neighbors of agent i that find themselves in state σ ∈ {1, 2, 3}, with
                                           ki,1 + ki,2 + ki,3 = ki , where ki stands for the degree of agent i. For square lattice networks with nearest-neighbor
                                           interactions, p = 0 and ki = 4 for all i ≤ N . The aforementioned rules for the update of the state of agent i fol-
                                           lowing the three-state majority-vote dynamics with noise q, for any network, can be summarized thus:
                                                                                    P(1|ki,1 > ki,2 ; ki,3 ) = 1 − q,
                                                                                    P(1|ki,1 = ki,2 > ki,3 ) = (1 − q)/2,
                                                                                    P(1|ki,1 < ki,2 = ki,3 ) = q,                                               (1)
                                                                                    P(1|ki,1 ; ki,2 < ki,3 ) = q/2,
                                                                                    P(1|ki,1 = ki,2 = ki,3 ) = 1/3.
                                           The probabilities for the remaining two states (2 and 3) follow easily from the symmetry operations of the C3ν
                                           group. It is worth noticing that the condition P(1|{ki }) + P(2|{ki }) + P(3|{ki }) = 1 holds for any configuration
                                           {ki } ≡ {ki,1 ; ki,2 ; ki,3 } of the connected neighbors, as it should, for the update probabilities to be conserved. The
                                           model is defined for values of the noise parameter in the range 0 ≤ q ≤ 2/3, since it may increase from zero to
                                           the amount corresponding to the situation in which each opinion is equally probable 1 − q = q/2.

          Scientific Reports |   (2022) 12:282 |                 https://doi.org/10.1038/s41598-021-03467-6                                                       4

Vol:.(1234567890)
www.nature.com/scientificreports/
Numerical quantities. We quantify the degree of opinion order of these social systems in terms of an order
parameter. Following the analogy with magnetic systems, we shall adopt the magnitude of the average magneti-
zation m, defined in analogy with the three-state Potts m
odel45. The instantaneous magnetization
consists in a
vector with components: mσ for σ ∈ {1, 2, 3}. Its magnitude is thus given by m = m21 + m22 + m23 , and its
components are defined as:
3 Nσ 1
mσ = − , (2)
2 N 3
where Nσ is the number of agents in state σ and N = L2 is the total number of nodes in the small-world net-
work. With this definition, it can be shown that the components of the magnetization are not independent of
one another. In fact, it holds that m1 + m2 + m3 = 0. Also, the magnitude of the instantaneous magnetization
of the system becomes m = 0 in the fully disordered phase, i.e, when all three states are equally populated
( Nσ /N = 1/3). The fully ordered phase exhibits m = 1, where only one state is populated, e.g., N1 /N = 1 and
the remaining two are vacant N2 /N = N3 /N = 0.
The order parameter proper, given by the average magnetization of the system, is therefore computed as
ML (q, p) = ��m�t �c , (3)
where ...
t denotes time averages taken in the stationary regime of the system, and ...
c denotes configurational
averages.
We shall also be interested in quantifying the magnitude of the fluctuations of the order parameter of the
system. For this purpose, we define the magnetic susceptibility of the system as a measure of the variance of the
order parameter in analogy with Ising-like magnetic systems
χL (q, p) = L2 [��m2 �t �c − ��m�t �2c ]. (4)
As is the case near the critical points of magnetic systems, we expect the susceptibility to peak and attain its
maximum value in the vicinity of qc . Indeed, in the thermodynamic limit L → ∞, the magnetic susceptibility
would exhibit singular behavior manifested as a divergence at qc.
We also evaluate the fourth-order Binder cumulant as a measure of the kurtosis of the order parameter
ML (q, p) of the system, defined as follows
��m4 �t �c
UL (q, p) = 1 − . (5)
3��m2 �t �c 2
This quantity tends to 2/3 deep in the ordered phase of the system and it decreases to zero well into the disordered
phase. It can be shown that, for sufficiently large system sizes, the Binder cumulants are rather insensitive to the
system size, and their curves cross each other at the same point qc , regardless of L, thus providing an estimate of
the critical point in the thermodynamic limit ( L → ∞).
It has been shown numerically that the three-state majority-vote model exhibits a second-order phase transi-
tion in a square lattice network ( p = 0), with a critical noise parameter of qc ≈ 0.118 and with critical exponent
values given by β/ν = 0.134 ± 0.005, γ /ν = 1.74 ± 0.02, in accordance with the three-state Potts model, for
which β/ν = 2/15, γ /ν = 26/15 and ν = 5/612–14.
Numerical results and discussion
We perform Monte Carlo simulations on small-world networks built on underlying two-dimensional square
lattices with linear sizes ranging from L = 40 to 140. In this work, a Monte Carlo Step (MCS) is defined as unit
of time in our simulations, corresponding to a total of N = L2 attempts of changing the opinion states of the
agents in the network. We prepare the initial configuration by setting the opinion state of all agents to σ = 1.
To allow the system to thermalize and reach a steady state in a given simulation, we skip the first 5 × 10⁴ MCSs,
after which we evaluate time averages over a window of another 2 × 10⁵ MCSs. We repeat the simulations for up
to 200 different samples for the calculation of the configurational averages.
In Fig. 4, we show the dependence of the average magnetization ML for several values of the rewiring prob-
ability p and L = 140. The curves of the order parameter ML suggest the presence of spontaneous magnetization
for low q, where ML ∼ O(1). We note that ML ∼ 0 when increasing q above some critical value, which depends
on p. Figure 4 also exhibits the existence of second-order phase transitions occurring between ordered and a
disordered states. From this figure, we conclude that the presence of long range interactions promote consensus
for the three-state majority vote model, since the noise value that induces a vanishing magnetization increases
with the rewiring probability p.
In Fig. 5, we show the curve of the magnetic susceptibility χL obtained from Eq. (4) versus the noise param-
eter q. The data from χL provide further evidence for the phase transitions on the three-state social system. The
maxima of these curves indicates the approximate location of the critical noises qc for each value of the rewiring
probability p for a system of size L = 140. We observe that these critical noise values depend on the system size
L; thus, we name them pseudocritical points, denoted by qc (L). Further analysis on the size dependence provide
a precise evaluation for qc = qc (L) with L → ∞, which does not depend on the system size.
We observe a substantial topological phenomenon for the scaling law of the magnetic susceptibility of the
Eq. (8). The locations of the magnetic susceptibility peaks, denoted by the pseudocritical points qc (L), tend to
move horizontally as we vary p. For higher values of the rewiring probability p, the locations qc (L) of the peaks
Scientific Reports | (2022) 12:282 | https://doi.org/10.1038/s41598-021-03467-6 5
Vol.:(0123456789)www.nature.com/scientificreports/
1.0
p = 0.0000
p = 0.0005
0.8 p = 0.001
p = 0.010
p = 0.025
0.6 p = 0.05
ML(q,p)
p = 0.10
p = 0.15
p = 0.20
0.4 p = 0.30
p = 0.50
p = 0.70
0.2 p = 1.00
0.0
0.00 0.05 0.10 0.15 0.20 0.25
q
Figure 4. Average magnetization ML (q, p) as a function of the noise parameter q for several values of the
rewiring probability p and L = 140. For each value of p, ML ∼ O(1) for q < qc (L) and ML ∼ 0 for q > qc (L).
The error bars are smaller than the symbol size, and the lines are just a guide to the eyes.
3
10
p = 0.0000
p = 0.0005
p = 0.001
p = 0.010
2 p = 0.025
10 p = 0.05
p = 0.10
χL(q,p)
p = 0.15
p = 0.20
p = 0.30
1 p = 0.50
10 p = 0.70
p = 1.00
0
10
0.10 0.12 0.14 0.16 0.18 0.20 0.22 0.24 0.26
q
Figure 5. Magnetic susceptibility χL (q, p) as a function of the noise parameter q for several values of the
rewiring probability p and L = 140. The locations of the maximum values of χL indicate the approximate critical
noise qc parameters for each value of p. The error bars are smaller than the symbol size, and the lines are just a
guide to the eyes.
shift to higher values of q as L increases, eventually settling at the actual critical noise qc in the thermodynamic
limit L → ∞. However, for low values of the rewiring probability p, the locations qc (L) of the peaks shift to lower
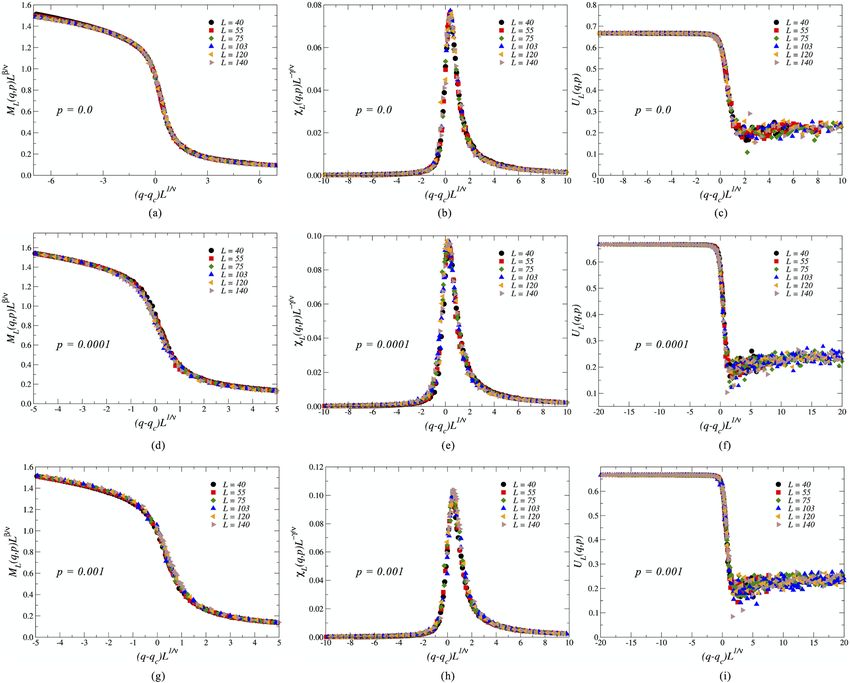
values of q as L increases. In Fig. 6, we illustrate this effect on the peaks of χL (q, p) for two values of p.
The reason behind this interesting effect is tied to the nature of the small-world network construction pro-
cess used, i.e., the link-rewiring scheme. The small-world effect increases with increasing p, and the diameter
of the network shrinks with increasing probability of link rewiring. This effect becomes stronger still and more
pronounced with increasing linear system size L, since, effectively, the diameter of the network (and the average
geodesic distance between nodes) decreases relative to the size of the network N as L increases. Therefore, as
shown in Fig. 6a, this causes the pseudocritical points qc (L) to shift to higher values of q when the topological
disorder of the network p is large, making the ordered phase of the system more stable with increasing system
size. The counterpart to this situation has a similar explanation. When p is small, the small-world property of the
network is weak. Thus, the square lattice structure dominates the critical behavior of the social network. In this
Scientific Reports | (2022) 12:282 | https://doi.org/10.1038/s41598-021-03467-6 6
Vol:.(1234567890)www.nature.com/scientificreports/
Figure 6. Magnetic susceptibility peaks for different system sizes and (a) p = 1 and (b) p = 10−4. For large
values of p, the pseudocritical points qc (L) shift to higher values of q with increasing system size L. For low
values of p, the the peaks of the susceptibility, and thus the pseudocritical points, shift to lower values of q with
increasing L.
0.75
0.50
p = 0.0000
p = 0.0005
0.25 p = 0.001
p = 0.010
p = 0.025
UL(q,p)
0.00
p = 0.05
p = 0.10
-0.25 p = 0.15
p = 0.20
-0.50 p = 0.30
p = 0.50
p = 0.70
-0.75 p = 1.00
-1.00
0.06 0.08 0.10 0.12 0.14 0.16 0.18 0.20 0.22 0.24 0.26
q
Figure 7. Binder fourth-order cumulant’s UL (q, p) dependence on the noise parameter q for several values of
the rewiring probability p and L = 140. UL (q, p) moves to the right as the rewiring probability p increases, in
agreement with ML (q, p) and χL (q, p). The error bars are smaller than the symbol size, and the lines are just a
guide to the eyes.
context, the pseudocritical points decrease with the increase of the linear system size L as expected. Therefore,
as Fig. 6b illustrates, the susceptibility peaks shift to smaller values of q with increasing system size. In Fig. 9c
we show the line fits to the data for ln χL at qc versus ln L , where the slopes for each line provide an estimate for
the critical exponent γ /ν of the model.
In Fig. 7 we illustrate the Binder cumulant UL of the system for several values of the rewiring probability p.
The curves of fourth-order Binder cumulants UL similarly suggest the existence of a phase transition, given their
visible drop from the value of UL = 2/3 around the locations of the critical noise values previously observed in
Figs. 4 and 5. This qualitative picture of the behavior of the pseudocritical points qc (L) indicates that the critical
noise parameter qc is an increasing function of the rewiring probability of the small-world networks p.
The Binder cumulant defined in Eq. (5) does not depend on the system size L at the critical point of the system
qc for any value of the rewiring probability p. We explore this property to estimate the critical noise parameter for
each p in the thermodynamic limit, qc (p), as the points where the fourth-order Binder cumulants UL for different
Scientific Reports | (2022) 12:282 | https://doi.org/10.1038/s41598-021-03467-6 7
Vol.:(0123456789)www.nature.com/scientificreports/
Figure 8. (a) Fourth-order Binder cumulant UL as a function of the noise parameter q for L = 60, 80, 100, 120
and 140. The lines are cubic polynomial fits to the data, yielding for p = 0.0001 a critical noise
qc = 0.1181 ± 0.0002. In the inset we show an overview for UL and the lines are guides for the eye. (b) Phase
diagram of the three-state (two-state) majority-vote model in small-world networks (open symbols). The points
represent the critical noise parameters qc as function of the rewiring probability p. The error bars are smaller
than the symbols, and the lines are guides to the eye.
sizes L intercept each other. In Fig. 8a, we present the Binder cumulant versus the noise parameter q for the rewir-
ing probability p = 0.0001, and L = 60, 80, 100, 120, and 140. Here, we estimate qc = 0.1181 ± 0.0002. We repeat
the evaluation of qc (p) for several values of the rewiring probability p, thus enabling the construction of the phase
diagram of Fig. 8b. In this phase diagram, we exhibit the order-disorder transition for the three-state majority-
vote model (closed symbols) and the phase diagram for the two-state version (open symbols)34,44, for comparison
purposes. The ordered phase lives below the curves for each system, for which there is spontaneous magnetization
and symmetry-breaking. Conversely, the region of points that lie above the curve correspond to the disordered
and symmetric phase of the system, where the average magnetization is zero. The phase diagram clearly presents
the observation made earlier that the critical noise parameter qc is a monotonically increasing function of the
rewiring probability p, with asymptotic behavior in the critical noise parameter in the q → 0 and q → 2/3 limits.
The previous set of results suggests that increasing the rewiring probability, thereby reducing the diameter
and average path distance of the network, enhances the long range ordering effect on the opinions. Moreover,
it is clear that, for small values of p, a small increase in the rewiring probability increases the critical noise sub-
stantially and, for large values of p, it quickly saturates as the networks become more random and the decrease of
the average path length is no longer appreciable. Therefore, increasing the randomness in the network topology
makes the ordered phase more resilient against thermal noise.
We remark that the small-world topology developed in this investigation allows us to highlight the contribu-
tion of long-range interactions to the robustness of the ordered phase in the three-state majority-vote dynamics
for a fixed average degree �k� = 4. Complementary studies suggest that the order in this particular model can
also be improved by increasing the average connectivity k
of an agent14,39.
Phase transitions on small‑world networks. To obtain the three standard critical exponents that char-
acterize the phase transitions of the model, we note that in the region of criticality q − qc ≃ 0, the pseudocritical
noise qc (L), the average magnetization ML, the magnetic susceptibility χL and the Binder cumulant UL satisfy the
following finite-size scaling relations:
qc (L) = qc + bL−1/ν , (6)
ML (q, p) = L−β/ν M(εL 1/ν
), (7)
1/ν ),
χL (q, p) = Lγ /ν χ(εL (8)
UL (q, p) = U(εL 1/ν
), (9)
where b is a constant, ε = q − qc is the distance to the critical noise, and M , χ and U
are universal scaling func-
tions that depend on the scaled variable x = εL1/ν.
Using Eq. (6), we estimate the critical exponent 1/ν exploring the pseudocritical noise dependence on the
system size L. In Fig. 9a we plot the logarithm of the distance between the pseudocritical point and the critical
noise |qc (L) − qc | versus the logarithm of L. The slopes of the linear fits to the data provide numerical estimates
for the critical exponent 1/ν for each rewiring probability p. In this figure, we use the function n(p), defined in
Table 1 to separate the curves corresponding to different values of p for the sake of visual clarity. We perform
Scientific Reports | (2022) 12:282 | https://doi.org/10.1038/s41598-021-03467-6 8
Vol:.(1234567890)www.nature.com/scientificreports/
Figure 9. Plot of (a) the distance ln |qc (L) − qc | between the pseudocritical points and the critical point qc , (b)
the magnitude of the magnetization ln ML, and (c) the magnetic susceptibility ln χL as functions of the of ln L
for different rewiring probabilities p. The slopes of (a–c) yield estimates for the critical exponents 1/ν, β/ν, and
γ /ν, respectively. The function n(p), defined in Table 1 is used to separate the curves corresponding to different
values of p for the sake of visual clarity.
p 0 10−4 10−3 10−2 10−1 5 × 10⁻¹ 1
n(p) 0 1 2 3 4 5 6
Table 1. Definition of the function n(p).
p qc β/ν γ /ν 1/ν deff
0 0.1180(2) 0.136(3) 1.76(2) 1.25(5) 2.03(2)
0.0001 0.1181(2) 0.152(7) 1.70(3) 1.28(2) 2.00(3)
0.001 0.1201(3) 0.16(1) 1.69(4) 1.28(1) 2.01(5)
0.01 0.1297(2) 0.24(2) 1.63(5) 1.05(5) 2.12(8)
0.1 0.1624(1) 0.24(1) 1.89(4) 1.58(1) 2.37(6)
0.5 0.1986(1) 0.31(2) 1.91(3) 1.97(5) 2.53(8)
1 0.2035(3) 0.25(1) 1.90(3) 2.04(8) 2.42(6)
Table 2. Table of critical noise parameters qc , their correspondent critical exponents β/ν, γ /ν, and 1/ν, and
the effective dimension of the system deff for the three-state majority-vote model on small-world networks for
different rewiring probabilities p.
a similar analysis using Eqs. (7) and (8) to obtain the critical exponents β/ν and γ /ν , associated to the order
parameter and to the magnetic susceptibility, respectively. In Fig. 9b,c we show the log-log plots of ln ML and
ln χL as a function of the logarithm of the system size ln L for different rewiring probabilities p, where the slopes
of each line fits to the scaled data, and provide numerical estimates for the critical exponents of the model.
In Table 2 we provide the estimates for the critical exponents 1/ν , β/ν and γ /ν of the three-state majority-
vote model on small-world networks. We also present the value of the effective dimension of the system for each
value of p, calculated as deff = 2β/ν + γ /ν , in accordance with the hyperscaling relation for critical systems for
p in the small-world regime. The case for p = 0 corresponds to the regular square lattice, where the numerical
results for both the critical noise parameter and the critical exponents agree with the numerical calculations
provided by previous investigations, consistent with the universality class of the three-state Potts model on the
square lattice12,13,45. As seen in the table, the values of deff suggest that the effective dimensions of the small-world
system are close, as expected, to d = 2.
We remark that when p increases away from the small-world region, where p ≥ 0.1, the system goes through
different topological regimes, as discussed in Fig. 6, and the values of the critical exponents are quite challenging
to calculate. However, it is well known that the effective dimension for complex networks does not necessarily
equal the space dimension on which they are inserted34,46–49.
The estimations of the values of these critical exponents serve as a guideline for plotting the scaling func-
tions ML (q, p)Lβ/ν , χL (q, p)L−γ /ν , and UL (q, p) versus the rescaled noise parameter of the system, |q − qc |L1/ν .
These plots reveal the respective data collapse of the functions corresponding to different system sizes into the
expected universal scaling functions M , χ and U
when using the exponents from Table 2. In Fig. 10, we present
data collapses for the p values in regular and small-world regime p = 0, p = 10−4 , and p = 10−3, respectively.
As seen in the figures, changing the rewiring probability p exhibits similar behavior for the data collapse of each
quantity, regarded that we use the suitable exponents from Table 2 for each rewiring probability p. The universal
behavior for each rescaled function, where different system sizes all collapse in one line, indicates that the critical
exponents obtained for the system present reasonable precision in the small-world regime, where 0 < p < 0.0138.
Scientific Reports | (2022) 12:282 | https://doi.org/10.1038/s41598-021-03467-6 9
Vol.:(0123456789)www.nature.com/scientificreports/
Figure 10. Data collapse into universal scaling functions for the average magnetization ML, the magnetic
susceptibility χL, and for the fourth-order Binder cumulant UL for regular square lattices, i. e., p = 0, and for
small-world interactions with rewiring probability p = 10−4 and p = 10−3.
We conclude that the disorder promoted by long-range small-world interactions on square lattices strongly
improves the magnetic order, remaining more robust under the social temperature parameter q. The rewiring
probability also changes the critical behavior of the three-state majority-vote model, while leaving the average
connectivity �k� = 4 unchanged.
Concluding remarks
We investigate the statistical mechanics of the three-state majority-vote model on small-world networks. Similar
to the isotropic two-state version, the opinion variable of an individual σ may assume only one of three discrete
values, such as σ = 1, 2, 3. In this model, an individual tends to adopt the opinion of the majority of its neighbors
with probability (1 − q), and a different opinion with a probability q. Here, q stands for the noise parameter of
the model and it induces the social disorder. From the generalized update rules for an opinion given by Eqs.
(1), the three-state majority-vote model it is placed within the framework of previous studies on other complex
network structures, as the square l attice12,13,32, random graphs14, and Barabási-Albert (scale-free) n
etworks39.
Small-world networks are built starting with two dimensional square lattices whose links are rewired with
probability p, with double links forbidden. We explore the main topological characteristics of these networks
by means of degree distributions, clustering coefficient and average path length calculations, which reveal the
role of disorder in the shrinking of the networks. We show that the average clustering coefficient CL (p) reaches a
maximum for p ∼ O(1), and the average shortest path length ℓL (p) decreases in the presence of rewired links as
expected. These results indicate the emergence of the small-world effect in the networks considered in this work.
Monte Carlo simulations and finite-size scaling analysis reveal that the system exhibits second-order phase
transitions, spontaneous symmetry breaking and long-range correlations. The critical noise parameter, qc (p) is
a monotonically increasing function of p, thereby suggesting that randomness in the topology of the network
makes the ordered opinion phase more resilient against social thermal fluctuations induced by q. We estimate
Scientific Reports | (2022) 12:282 | https://doi.org/10.1038/s41598-021-03467-6 10
Vol:.(1234567890)www.nature.com/scientificreports/
the critical exponents for different values of the rewiring probability p, and confirm them by means of the data-
collapse of the average magnetization, magnetic susceptibility, and fourth-order Binder cumulant into their
universal scaling functions. For p = 0, the two-dimensional regular lattice with periodic boundary conditions
obtains and the critical exponent values measured are in agreement with numerical calculations in the literature,
consistent with the three-state Potts model. However, in the presence of topological disorder p > 0, the results
suggest that the critical exponents depend on the value of the rewiring probability p; thus indicating they belong
to different universality classes.
The numerical results suggest that the link-rewiring scheme and the ensuing topological disorder effects
slightly increase the effective critical dimension of the system above d = 2, a manifestation of the fact that the
network changes its length scales due to the small-world property. This result agrees with previous studies, where
the effective dimension of the complex networks, in general, does not agree with the spatial dimension of the
embedding lattice.
Received: 16 July 2021; Accepted: 17 November 2021
References
1. Mantegna, R. N. & Stanley, H. E. An Introduction to Econophysics: Correlations and Complexity in Finance (Cambridge University
Press, Cambridge, 2000).
2. Bouchaud, J. P. & Potters, M. Theory of Financial Risk and Derivative Pricing. From Statistical Physics to Risk Management 2nd edn.
(Cambridge University Press, Cambridge, 2003).
3. Voit, J. The Statistical Mechanics of Financial Markets third edn. (Springer-Verlag, 2005).
4. Bornholdt, S. Expectation in bubbles in a spin model of markets: Intermittency from frustration across scales. Int. J. Mod. Phys. C
12, 667–674 (2001).
5. Takaishi, T. Simulations of financial markets in a Potts-like model. Int. J. Mod. Phys. C 16, 1311–1317 (2005).
6. Sznajd-Weron, K. & Weron, R. A simple model of price formation. Int. J. Mod. Phys. C 13, 115–123 (2002).
7. Sznajd-Weron, K. & Weron, R. Who is left, who is right?. Phys. A 351, 593–604 (2005).
8. Krawiecki, A., Holyst, J. A. & Helbing, D. Volatility clustering and scaling for financial time series due to attractor bubbling. Phys.
Rev. Lett. 89, 158701 (2002).
9. Bartolozzi, M., Leinweber, D. B. & Thomas, A. W. Stochastic opinion formation in scale-free networks. Phys. Rev. E 72, 046113
(2005).
10. Vilela, A. L. M., Wang, C., Nelson, K. P. & Stanley, H. E. Majority-vote model for financial markets. Phys. A 515, 762–770 (2019).
11. Tomé, T., de Oliveira, M. J. & Santos, M. A. Non-equilibrium Ising model with competing Glauber dynamics. J. Phys. A: Math.
Gen. 24, 3677 (1999).
12. Brunstein, A. & Tomé, T. Universal behavior in an irreversibe model with C3v symmetry. Phys. Rev. E 60, 3666–3669 (1999).
13. Tomé, T. & Petri, A. Cumulants of the three-state potts model and of nonequilibrium models with C3v symmetry. J. Phys. A: Math.
Gen. 35, 5379–5390 (2002).
14. Melo, D. F. F., Pereira, L. F. C. & Moreira, F. G. B. The phase diagram and critical behavior of the three-state majority-vote model.
J. Stat. Mech. Theory Exp. 2, P11032 (2010).
15. Vilela, A. L. M. & Stanley, H. E. Effect of strong opinions on the dynamics of the majority-vote model. Sci. Rep. 8, 8709 (2018).
16. Raafat, R. M., Chater, N. & Frith, C. Herding in humans. Trends Cogn. Sci. 13, 420–428 (2009).
17. Galam, S. Sociophysics: A Physicist’s Modeling of Psycho-political Phenomena (Springer-Verlag, New York, 2012).
18. Galam, S. Sociophysics: A review of Galam models. Int. J. Mod. Phys. C 19, 409–440 (2008).
19. Cheon, T. & Galam, S. Dynamical galam model. Phys. Lett. A 382, 1896–1896 (2018).
20. Zehmakan, A. N. & Galam, S. Rumor spreading: A trigger for proliferation or fading away. Chaos 2, 073122 (2020).
21. Zubillaga, B. J., Vilela, A. L. M., Wang, C., Nelson, K. P. & Stanley, H. E. A three-state opinion formation model for financial markets.
Phys. A 588, 126527 (2022).
22. Sornette, D. Critical Phenomena in Natural Sciences: Chaos, Fractals, Selforganization and Disorder: Concepts and Tools 2nd edn.
(Springer, Berlin, 2006).
23. Hong, H., Kubik, J. D. & Stein, J. C. Thy neighbor’s portfolio: word-of-mouth effects in the holdings of trades of money managers.
J. Financ. LX, 2801–2824 (2005).
24. Ball, P. The physical modelling of society: A historical perspective. Phys. A 314, 1–14 (2002).
25. Quetelet, A. Recherches sur le penchant au crime aux différens ages. Nouveaux mémoires de l’Académie Royale des Science et de
Belles-Lettres de Bruxelles (1835).
26. Shiller, R. J. Irrational Exuberance: Revised and Expanded 3rd edn. (Princeton University Press, Princeton, 2015).
27. de Oliveira, M. J. Isotropic majority-vote model on a square lattice. J. Stat. Phys. 66, 273–281 (1992).
28. Lima, F. W. S. Majority-vote on directed Barabási-Albert networks. Int. J. Mod. Phys. C 17, 1257–1265 (2006).
29. Lima, F. W. S. Majority-vote on undirected Barabási-Albert networks. Commun. Comput. Phys. 2, 358–366 (2007).
30. Luz, E. M. S. & Lima, F. W. S. Majority-vote on directed small-world networks. Int. J. Mod. Phys. C 18, 1251–1261 (2007).
31. Lima, F. W. S., Sousa, A. O. & Sumuor, M. A. Majority-vote on directed Erdös-Rényi random graphs. Phys. A 387, 3503–3510
(2008).
32. Lima, F. W. S. Three-state majority-vote model on square lattice. Phys. A 391, 1753–1758 (2012).
33. Vilela, A. L. M. & Moreira, F. G. B. Majority-vote model with different agents. Phys. A 388, 4171–4178 (2009).
34. Vilela, A. L. M. & de Souza, A. J. F. Majority-vote model with a bimodal distribution of noises in small-world networks. Phys. A
488, 216–223 (2017).
35. Barabási, A. L. & Albert, R. Statistical mechanics of complex networks. Rev. Mod. Phys. 74, 47–97 (2002).
36. Newman, M. E. J. The structure and function of complex networks. Soc. Ind. Appl. Math. Rev. 45, 167–256 (2003).
37. Watts, D. J. & Strogatz, H. S. Collective dynamics of ‘small-world’ networks. Nature 393, 440–442 (1998).
38. Strogatz, S. H. Exploring complex networks. Nature 410, 268–276 (2001).
39. Vilela, A. L. M. et al. Three-state majority-vote model on scale-free networks and the unitary relation for critical exponents. Sci.
Rep. 10, 2 (2020).
40. Pool, Id. S. & Kochen, M. Contacts and influence. Soc. Netw. 1, 5–51 (1978).
41. Travers, J. & Milgram, S. An experimental study of the small world problem. Sociometry 32, 425–443 (1969).
42. Milgram, S. The small-world problem.. Psychol. Today 1, 61–67 (1967).
43. Marvel, S. A., Martin, T., Doering, C. R., Lusseau, D. & Newman, M. E. J. The small-world effect is a modern phenomenon. arXiv:
1310.2636 [physics.soc-ph] (2013).
Scientific Reports | (2022) 12:282 | https://doi.org/10.1038/s41598-021-03467-6 11
Vol.:(0123456789)www.nature.com/scientificreports/
44. Campos, P. R. A., de Oliveira, V. M. & Moreira, F. G. B. Small-world effects in the majority-vote model. Phys. Rev. E 67, 026104
(2003).
45. Wu, F. Y. The Potts model. Rev. Mod. Phys. 54, 235–268 (1982).
46. Daqing, S., Kosmidis, K., Bunde, A. & Havlin, S. Dimension of spatially embedded networks. Nat. Phys. 7, 481–484 (2011).
47. Moukarzel, C. Effective dimensions in networks with long-range connections. Phys. A 356, 157–161 (2005).
48. Hong, H., Ha, M. & Park, H. Finite-size scaling in complex networks. Phys. Rev. Lett. 98, 2 (2007).
49. Chatelain, C. Hyperscaling violation in the 2d 8-state Potts model with long-range correlated disorder. Europhys. Lett. 102, 66007
(2013).
Acknowledgements
The authors acknowledge financial support from Brazilian institutions and funding agencies UPE (PFA2019,
PIAEXT2019), FACEPE (APQ-0565-1.05/14, APQ-0707-1.05/14), CAPES, CNPq. The Boston University Center
for Polymer Studies is supported by NSF Grants PHY-1505000, CMMI-1125290, and CHE-1213217, by DTRA
Grant HDTRA1-14-1-0017, and by DOE Contract DE-AC07-05Id14517.
Author contributions
In this work, all authors contributed with the writing of the manuscript. A.L.M.V. conceived the project and
performed the simulations. B.J.Z. also performed the simulations and prepared the figures. All authors contrib-
uted to the final version of this work.
Competing interests
The authors declare no competing interests.
Additional information
Correspondence and requests for materials should be addressed to B.J.Z.
Reprints and permissions information is available at www.nature.com/reprints.
Publisher’s note Springer Nature remains neutral with regard to jurisdictional claims in published maps and
institutional affiliations.
Open Access This article is licensed under a Creative Commons Attribution 4.0 International
License, which permits use, sharing, adaptation, distribution and reproduction in any medium or
format, as long as you give appropriate credit to the original author(s) and the source, provide a link to the
Creative Commons licence, and indicate if changes were made. The images or other third party material in this
article are included in the article’s Creative Commons licence, unless indicated otherwise in a credit line to the
material. If material is not included in the article’s Creative Commons licence and your intended use is not
permitted by statutory regulation or exceeds the permitted use, you will need to obtain permission directly from
the copyright holder. To view a copy of this licence, visit http://creativecommons.org/licenses/by/4.0/.
© The Author(s) 2022
Scientific Reports | (2022) 12:282 | https://doi.org/10.1038/s41598-021-03467-6 12
Vol:.(1234567890)You can also read