TOWARDS SUSTAINABLE CENSUS INDEPENDENT POP-ULATION ESTIMATION IN MOZAMBIQUE - ResearchGate
←
→
Page content transcription
If your browser does not render page correctly, please read the page content below
Published as a workshop paper at AI for Public Health, ICLR 2021

                                         T OWARDS S USTAINABLE C ENSUS I NDEPENDENT P OP -
                                         ULATION E STIMATION IN M OZAMBIQUE

                                          Isaac Neal1 , Sohan Seth1 ∗, Gary Watmough1 , Mamadou Saliou Diallo2
                                          University of Edinburgh1 and UNICEF2
                                          {ineal,sseth,gary.watmough}@ed.ac.uk, mamsdiallo@unicef.org

                                                                                      A BSTRACT
arXiv:2104.12696v1 [cs.LG] 26 Apr 2021

                                                  Reliable and frequent population estimation is key for making policies around
                                                  vaccination and planning infrastructure delivery. Since censuses lack the spatio-
                                                  temporal resolution required for these tasks, census-independent approaches, us-
                                                  ing remote sensing and microcensus data, have become popular. We estimate
                                                  intercensal population count in two pilot districts in Mozambique. To encour-
                                                  age sustainability, we assess the feasibility of using publicly available datasets to
                                                  estimate population. We also explore transfer learning with existing annotated
                                                  datasets for predicting building footprints, and training with additional ‘dot’ an-
                                                  notations from regions of interest to enhance these estimations. We observe that
                                                  population predictions improve when using footprint area estimated with this ap-
                                                  proach versus only publicly available features.

                                         1   I NTRODUCTION

                                         Accurate fine scale population estimates serve as a fundamental tool for policymakers. Many deci-
                                         sions involving access to services, distribution of vaccines and disaster relief, tracking of migration,
                                         and more are informed based on the most up to date population estimates for a region. Where
                                         these estimates are of insufficient resolution — either spatially or temporally — optimal decision
                                         making becomes difficult. Thus, there is a need for accurate and sustainable fine scale estimates of
                                         population globally, particularly in response to the COVID-19 pandemic, which requires efficient
                                         distribution of vaccines to vulnerable people, see e.g., Wang et al. (2020).
                                         Over time, census data loses its resolution, both temporal and spatial, making it difficult to inform
                                         decision making for many of the problems mentioned above. Censuses are conducted infrequently,
                                         typically decennially, and due to privacy constraints, census data is typically unavailable to the
                                         wider community at the smallest administrative levels (Wardrop et al., 2018). Furthermore, census
                                         data can be inaccurate or incomplete due to budget limitations, lack of training, and socio-political
                                         circumstances (Wardrop et al., 2018), and may quickly become outdated due to conflicts, rapid
                                         migration or urban development, and disasters (Engstrom et al., 2020).
                                         Census-independent population estimation (or bottom-up estimation) uses updated demographic in-
                                         formation in periodic household surveys, or microcensuses, and detailed visual information offered
                                         by remote sensing technology to predict intercensal population density in non-surveyed areas. This
                                         approach could improve both temporal and spatial resolution of census data, since remote sensing
                                         data is available on a regular basis with sufficient resolution to estimate population at a fine scale. A
                                         summary of recent works in this area is provided in Table 1.
                                         In this paper, we present ongoing work on bottom-up population estimation in Mozambique with a
                                         focus on sustainability. The goal is to establish a pipeline that can be maintained and used by non-
                                         experts over a long period, that relies on existing tools and datasets as much as possible, and requires
                                         minimal human supervision, e.g., in terms of annotation. We assess the feasibility of this approach,
                                         and find that building footprint area is a crucial attribute for estimating population. Moreover, build-
                                         ing footprint area estimates using existing deep architecture and transfer learning are improved if
                                         additional annotated data is used from the region of interest (ROI). For greater sustainability, we
                                         suggest using easier ‘dot’ annotation (Lempitsky & Zisserman, 2010) for buildings from the ROI
                                         rather than more time-consuming polygon annotation which requires more human supervision.

                                                                                            1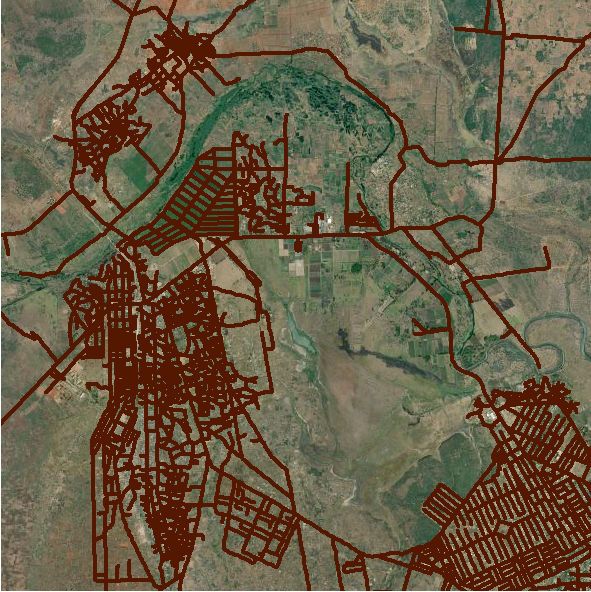
Published as a workshop paper at AI for Public Health, ICLR 2021
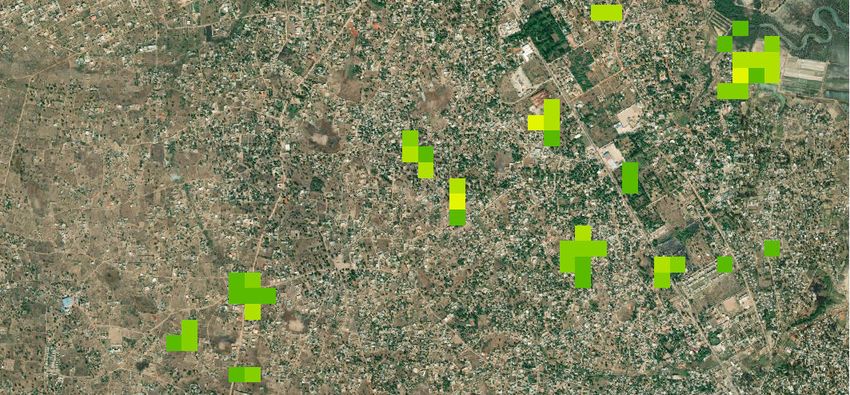
Figure 1: A) Regions of Mozambique (red) where microcensus was conducted, B) Distribution of
gridded microcensus data in Boanne (BOA), C) Remote sensing data sources, D) Polygon building
annotation from SpaceNet (100 m tiles), E) Dot building annotation from Mozambique (100 m tiles).
2 DATA AND P ROCESSING
Microcensus: UNICEF funded a microcensus in 2019 conducted by SpaceSUR and GroundWork
over two ROIs in Mozambique: Boanne (BOA) and Magude (MGD) (see Fig. 1A). The survey
was conducted at a household level and households were exhaustively sampled over several primary
sampling units (PSUs). We aggregated the household survey data to a 100 m grid to generate the
response variable for predicting gridded population from remote sensing data (see Fig. 1B).
Remote Sensing: A variety of remote sensing imagery and derived data were used to model popu-
lation count. The data sources are summarized in Table 2. Example images of each data source are
shown in Fig. 1C. The 50 cm high-resolution satellite imagery (Vivid from Maxar) was a mosaic of
WorldView-2 images, mostly from 2018 and 2019 (83% and 17% for BOA and 43% and 33% for
MGD, remainder from 2011 to 2020). The night time lights (NTL) data was average intensity for
the year 2019. The land cover classification was reclassified to condense forest types to open forest
and closed forest. We ignored no class, closed forest, herbaceous wasteland, moss, bare, snow,
water, and sea as they did not appear in our survey tiles. This left 5 classes. All raster data was
reprojected to the 100 m survey grid for each ROI. Three types of resampling were used for differ-
ent data-sources: average resampling for continuous data, nearest-neighbor resampling for coarser
resolution categorical data, and any resampling (i.e. 1 if any underlying tile is 1 and otherwise 0) for
finer resolution binary data.
Distance to Road Calculation: We rasterized the OSM road shapefiles to produce a Boolean raster
indicating the presence of road in each grid tile, and calculated the Euclidean distance from each
tile to the nearest tile with road as distance to road. We treated all road annotations from the OSM
dataset the same, yielding one value for distance to road for each grid tile.
Building Footprint Identification We used a U-Net architecture (Ronneberger et al., 2015) with
a VGG16 encoder (Simonyan & Zisserman, 2015) pre-trained on weights from ImageNet (Rus-
sakovsky et al., 2015) to segment an image into building and non-building areas. BFIa) We pre-
trained the building footprint segmentation model on annotated satellite imagery from the SpaceNet
challenge (Van Etten et al., 2019). We used the processed AOI 1 dataset from SpaceNet v1, which
contains a large quantity of satellite imagery from Brazil with polygon building annotations. The
dataset differs from our ROIs in Mozambique in several ways: SpaceNet tiles have more urban ar-
eas, a wetter climate, and different building colouration (see Figs. 1D-E). These factors hindered
transfer learning between the tasks, and justified fine-tuning on a dataset from Mozambique. BFIb)
We fine-tuned the model on ‘dot’ annotated buildings covering an area of 10 km2 (i.e., 1,000 grid
2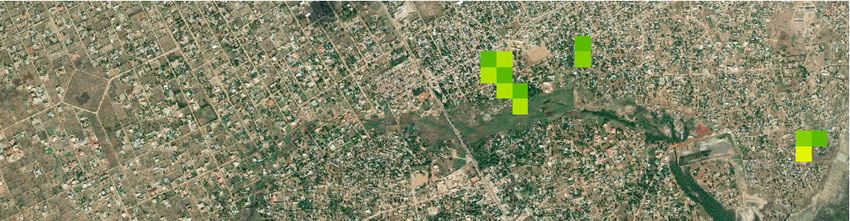
Published as a workshop paper at AI for Public Health, ICLR 2021

           Table 1: Summary of recent literature on topic of bottom up population estimation
                                                   .
                        Weber et al. (2018)     Engstrom et al. (2020)            Hillson et al. (2019)    Leasure et al. (2020)
Region of Interest      Nigeria                 Sri Lanka                         Bo, Sierra Leone         Nigeria
                                                                                                           0.5m (Maxar), 100 m
                                                10 m (Polygon data)
                                                                                                           (WorldPop), various
Input Resolution        0.5 m (Maxar)           12-30 m (Urban Footprint)         30 m (Landsat)
                                                                                                           (OSM school density,
                                                750 m (Night time Lights)
                                                                                                           household size)
Output Resolution       90 m                    Village level                     City district level      100 m
                                                Free (public data)                                         Free (OSM, WorldPop)
Input Data Cost         High (Maxar data)                                         Free (public data)
                                                High (Maxar data)                                          High (Maxar data)
Performance
Validation              eTally data             Train/test split                  LOOCV                    Train/test split
M E APE                 -                       28                                11                       -
R2                      0.98                    0.58                              -                        0.26

                        NOTE: LOOCV = leave one out cross validation, M E APE= median absolute percent error

           Table 2: Remote sensing data sources, their characteristics and features extracted.

                                                                                         Publicly avail.           Features
  Data                    Resolution        Year       Frequency       Prerequisite
                                                                                           (source)            Extracted (Count)
  Vivid Imagery              0.5 m        Various           4d              N/A           No (Maxar)           Building area (1)
                                                                                          Yes (NASA/           10 bands, NDVI,
  Landsat 8                    30 m         2019            8d              N/A
                                                                                            USGS)                NDWI (12)
                                                                         High res.
  High Resolution                                                                              Yes
                               30 m         2015           N/A         imagery and                              Binary Map (1)
  Settlement Layer                                                                          (CIESIN)
                                                                        census data
  Land cover
                            100 m           2019         Annual           Various           Yes (ESA)               LCC (5)
  classification
                                                                                               Yes
  Night-time lights         750 m           2019            1d              N/A                                  Radiance (1)
                                                                                             (NOAA)
                                                                        Volunteer                                  Distance to
  Road Data                 Vector        Various          N/A                             Yes (OSM)
                                                                        annotation                                  road (1)

 NOTE: Although WorldView-2 imagery may be available every 4 days, we only had access to Vivid data from Maxar collected from various
 years. The number in parenthesis in the final column shows the number of derived features from that dataset.

tiles to reduce manual annotation) from the ROIs (outside surveyed areas to avoid data leakage).
These annotations are a subset of those produced through a mixture of automatic estimation and
manual curation in previous work by SpaceSUR. The ‘dot’ annotation was converted to raster class
labels by rasterizing a circle around each point with the average area of buildings in the respective
ROI. Dot annotation was preferred over polygon annotations to avail sustainability since the former
is less time-intensive than the latter. This approach might not infer the exact boundary of a building
but is only an intermediate step to population estimation.
Context Variable We introduced the notion of context to our model by calculating the average
of each extracted feature (except distance to road) in the tiles surrounding the tile of interest (two
surrounding contexts, 8 tiles and 24 tiles), and using these values as additional features in the model.
In doing so, we aimed to provide the model with an understanding of the features on coarser scales.
Non-representative Tiles Upon investigating the data, we concluded that, due to the retrospective
nature of the data, several tiles at the boundary of the PSUs only covered a PSU partially, and
several surveyed areas had developed either before or after our high resolution satellite imagery was
captured. This meant that the tiles often contained non-surveyed buildings or missing buildings, and
therefore, our gridded data contained both developed tiles (i.e., with a large number of buildings)
labeled as low population, and undeveloped tiles labeled as high population. Although it is possible
to either automatically detect these ‘outlier’ tiles during training or use a robust loss function that
is insensitive to them, it is not possible to validate a model on non-representative data. Therefore,
we manually excluded these grid tiles from the data by comparing the surveyed buildings (GPS
locations available in the microcensus) with those appearing in the Vivid imagery.

                                                                   3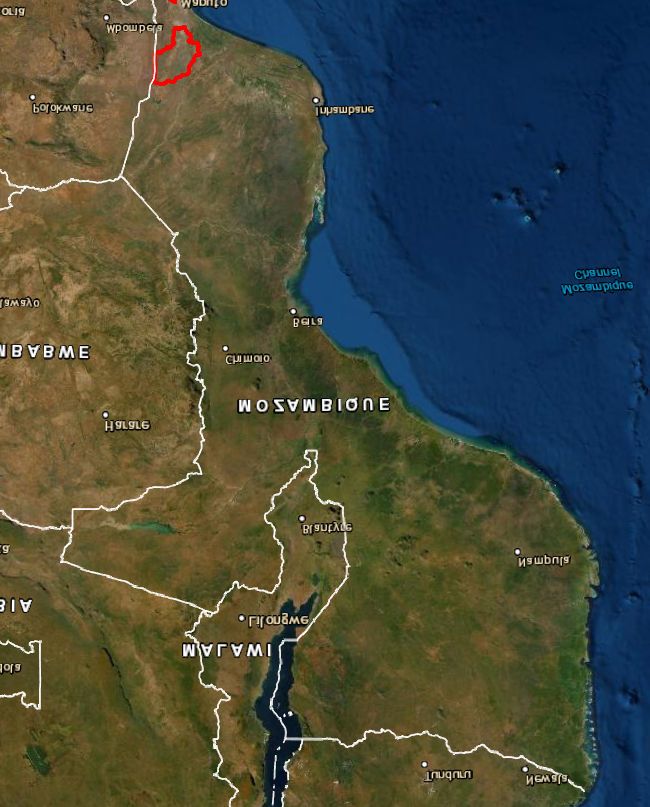
Published as a workshop paper at AI for Public Health, ICLR 2021

3      R ESULTS AND D ISCUSSION

Dataset We have 199 survey grid tiles and 61 predictor variables (see Table 2). Cross-validation
Due to the limited quantity of data, we evaluated our population model through 4-fold cross valida-
tion. The data is split spatially into four approximately equal sized subsets (for each ROI separately),
and we reported the error metrics over pooled prediction from the four validation folds. Model Due
to the limited availability of data, we fit a single linear model with Huber loss function and `1
regularization (Yi & Huang, 2017) for both districts to model the log of population count given a
combination of public features and BFIa or BFIb. We chose the model hyperparameters using 3-fold
cross-validation over the training set for each fold of our
                                                          Pspatial crossP validation. Evaluation Met-
rics We chose several evaluation metrics, i.e., R2 = 1− i (yi − ŷ)2 / i (yi − ȳ)2 , median absolute
error M E AE = median |yi − ŷi |, median absolute percentage error M E APE = median |yi − ŷi |/yi ,
adjusted median absolute percentage error A M E APE = medianP        |yi − ŷi |/(yP
                                                                                   i + 10) (toPavoid divi-
sion by zero), and aggregated percentage error AGG PE(A) = | i∈A yi − i∈A ŷi |/ i∈A yi (to
capture error at a ROI level). Null model The null model predicted the population as the mean of
the training set irrespective of the feature values. Results We observe that the model can effectively
predict population, and outperforms the null model. The model performs the best with either public
and fine-tuned building footprints (BFIb) as features, or only BFIb as features, and the performances
are similar. A loss in accuracy is incurred when using either public only or public and pre-trained
building footprints (BFIa) as features, however, the accuracy is still acceptable (M E AE is 3.8 versus
7.5 in null model). The model performed the worst when using only pre-trained building footprints
(BFIa) as features, indicating that fine-tuning improves performance substantially.
             Table 3: Summary of model performance
                                                                                                             80         best fit
                                                                                                                        identity
                                                                                      Predicted population
                            2
    Features used       R        M E APE       A M E APE       M E AE        AGG PE                                     boa
    Public              0.05        51.8%             0.23        3.84        25.4%                          60         mgd
    BFIa               -0.08        59.9%             0.25        4.02        32.1%
    BFIb                0.54        39.2%             0.20        3.41        14.9%
    Public + BFIa       0.05        50.1%             0.23        3.97        27.3%                          40
    Public + BFIb       0.53        42.1%             0.19        3.45        13.2%

    Null Model         -0.12      76.45%              0.41        7.57        1.68%
                                                                                                             20

                                                                                                             0
     See Evaluation Metrics above for metric definitions. BFIa and BFIb are                                       0    20     40   60   80
     pre-trained and fine-tuned building area estimates respectively. Predicted vs.
     observed plot (right) summarizes the results for Public + BFIb.                                                  Observed population
We are currently addressing the following improvements to the model: Buildings under construc-
tion Our building segmentation model often identifies buildings that are under construction or build-
ings that are in ruin (e.g., historical buildings from colonial era with roof caved in). Since building
footprint is an important feature in predicting population this can introduce bias in the outcome.
We are improving the building segmentation model to help reduce this bias. Non-residential build-
ings Our building segmentation model does not discriminate between non-residential buildings (e.g.,
grain storage or schools) and residential buildings. We are addressing this by computing individual
footprints prior to total area and discounting buildings that are too large or too small to likely be
inhabited. Distance to road We treat all road types to be the same. We are extending this approach
to give a more informative set of distance variables (e.g. distance to major highway) for different
road types. We also intend to calculate road density to compare usefulness. Sustainability Sustain-
ability is an issue in most bottom-up estimation techniques in the literature. The causes for this are
twofold: the high cost of conducting population surveys, and limitations inherent to the machine
learning methodology that might require expert annotation. Our results show that population can be
estimated with limited survey data and ‘dot’ annotations. We are addressing this further by explor-
ing ways to reduce dot annotation required. External validation and transferability It is difficult
to externally validate the existing population estimation approaches or to compare them. This is be-
cause existing methods have been applied on different countries and a standard microcensus dataset
does not exist for comparison. Furthermore, when microcensus data does exist it is difficult to access
satellite images with the same spatial, temporal and radiometric characteristics using the Vivid data
product. We are addressing this through conducting fresh microcensus surveys in Mozambique.

                                                                         4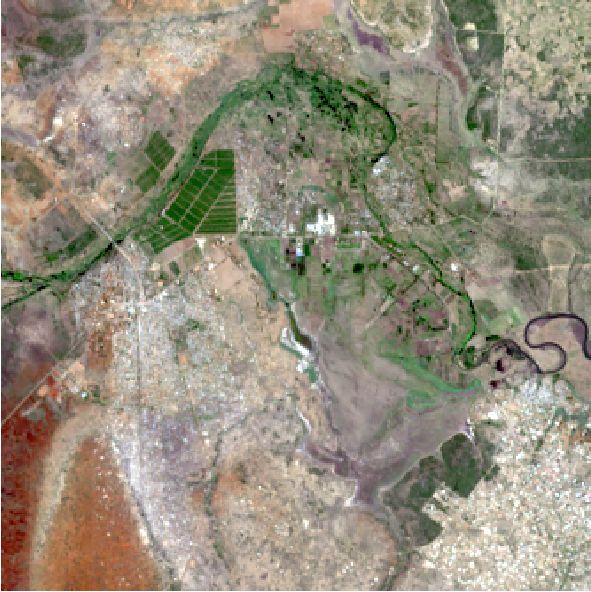
Published as a workshop paper at AI for Public Health, ICLR 2021

ACKNOWLEDGMENTS
The project was funded by the Data for Children Collaborative with UNICEF. The authors thank
Pablo Martı́n Amieva (SpaceSUR) for his valuable insights on the project.

R EFERENCES
Ryan Engstrom, David Newhouse, and Vidhya Soundararajan. Estimating small-area population
  density in Sri Lanka using surveys and Geo-spatial data. PLOS ONE, 15(8):e0237063, August
  2020. doi: 10.1371/journal.pone.0237063.
Roger Hillson, Austin Coates, Joel D. Alejandre, Kathryn H. Jacobsen, Rashid Ansumana, Alfred S.
  Bockarie, Umaru Bangura, Joseph M. Lamin, and David A. Stenger. Estimating the size of urban
  populations using landsat images: a case study of bo, sierra leone, west africa. International
  Journal of Health Geographics, 18(1):16, July 2019. doi: 10.1186/s12942-019-0180-1.
Douglas R. Leasure, Warren C. Jochem, Eric M. Weber, Vincent Seaman, and Andrew J. Tatem.
  National population mapping from sparse survey data: A hierarchical bayesian modeling frame-
  work to account for uncertainty. Proceedings of the National Academy of Sciences, 117(39):
  24173–24179, September 2020. doi: 10.1073/pnas.1913050117.
Victor Lempitsky and Andrew Zisserman. Learning to count objects in images. In Proceedings of the
  23rd International Conference on Neural Information Processing Systems - Volume 1, NIPS’10,
  pp. 1324–1332, 2010.
Olaf Ronneberger, Philipp Fischer, and Thomas Brox. U-Net: Convolutional Networks for
  Biomedical Image Segmentation. In Nassir Navab, Joachim Hornegger, William M. Wells,
  and Alejandro F. Frangi (eds.), Medical Image Computing and Computer-Assisted Interven-
  tion, volume 9351, pp. 234–241. Springer International Publishing, Cham, May 2015. doi:
  10.1007/978-3-319-24574-4 28. Series Title: Lecture Notes in Computer Science.
Olga Russakovsky, Jia Deng, Hao Su, Jonathan Krause, Sanjeev Satheesh, Sean Ma, Zhiheng
  Huang, Andrej Karpathy, Aditya Khosla, Michael Bernstein, Alexander C. Berg, and Li Fei-Fei.
  ImageNet Large Scale Visual Recognition Challenge. International Journal of Computer Vision
  (IJCV), 115(3):211–252, 2015. doi: 10.1007/s11263-015-0816-y.
Karen Simonyan and Andrew Zisserman. Very deep convolutional networks for large-scale image
  recognition. In Yoshua Bengio and Yann LeCun (eds.), 3rd International Conference on Learning
  Representations, ICLR 2015, San Diego, CA, USA, Conference Track Proceedings, May 2015.
Adam Van Etten, Dave Lindenbaum, and Todd M. Bacastow. SpaceNet: A remote sensing dataset
  and challenge series. 2019.
Wei Wang, Qianhui Wu, Juan Yang, Kaige Dong, Xinghui Chen, Xufang Bai, Xinhua Chen, Zhiyuan
 Chen, Cécile Viboud, Marco Ajelli, and Hongjie Yu. Global, regional, and national estimates of
 target population sizes for covid-19 vaccination: descriptive study. BMJ, pp. m4704, December
 2020. doi: 10.1136/bmj.m4704.
Nicola Wardrop, Warren Jochem, Tomas Bird, Heather Chamberlain, Donna Clarke, David Kerr,
  Linus Bengtsson, Sabrina Juran, Vincent Seaman, and Andrew Tatem. Spatially disaggregated
  population estimates in the absence of national population and housing census data. Proceedings
  of the National Academy of Sciences, 115(14):3529–3537, March 2018.
Eric M Weber, Vincent Y Seaman, Robert N Stewart, Tomas J Bird, Andrew J Tatem, Jacob J Mc-
  Kee, Budhendra L Bhaduri, Jessica J Moehl, and Andrew E Reith. Census-independent population
  mapping in northern nigeria. Remote sensing of environment, 204:786–798, January 2018.
Congrui Yi and Jian Huang. Semismooth Newton Coordinate Descent Algorithm for Elastic-Net Pe-
  nalized Huber Loss Regression and Quantile Regression. Journal of Computational and Graphi-
  cal Statistics, 26(3):547–557, July 2017. doi: 10.1080/10618600.2016.1256816.

                                               5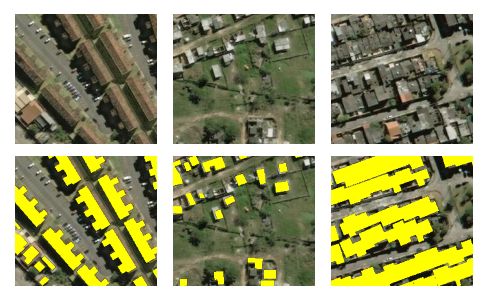


You can also read