Tuning the reactivity of carbon surfaces with oxygen-containing functional groups
←
→
Page content transcription
If your browser does not render page correctly, please read the page content below
Article                                                                                                   https://doi.org/10.1038/s41467-023-37962-3

                                    Tuning the reactivity of carbon surfaces with
                                    oxygen-containing functional groups

                                    Received: 14 February 2023                          Jiahua Zhou1,2,6, Piaoping Yang1,2,6, Pavel A. Kots 1, Maximilian Cohen1,
                                                                                        Ying Chen 3, Caitlin M. Quinn 4, Matheus Dorneles de Mello 2,5,
                                    Accepted: 7 April 2023
                                                                                        J. Anibal Boscoboinik2,5, Wendy J. Shaw 3, Stavros Caratzoulas 2,
                                                                                        Weiqing Zheng 2 & Dionisios G. Vlachos 1,2

                                        Check for updates
                                                                                        Oxygen-containing carbons are promising supports and metal-free catalysts
                                                                                        for many reactions. However, distinguishing the role of various oxygen func-
                  1234567890():,;
1234567890():,;

                                                                                        tional groups and quantifying and tuning each functionality is still difficult.
                                                                                        Here we investigate the role of Brønsted acidic oxygen-containing functional
                                                                                        groups by synthesizing a diverse library of materials. By combining acid-
                                                                                        catalyzed elimination probe chemistry, comprehensive surface characteriza-
                                                                                        tions, 15N isotopically labeled acetonitrile adsorption coupled with magic-angle
                                                                                        spinning nuclear magnetic resonance, machine learning, and density-
                                                                                        functional theory calculations, we demonstrate that phenolic is the main acid
                                                                                        site in gas-phase chemistries and unexpectedly carboxylic groups are much
                                                                                        less acidic than phenolic groups in the graphitized mesoporous carbon due to
                                                                                        electron density delocalization induced by the aromatic rings of graphitic
                                                                                        carbon. The methodology can identify acidic sites in oxygenated carbon
                                                                                        materials in solid acid catalyst-driven chemistry.

                                    Owing to their low cost, light-weight, high surface area, high thermal         etc14–16., or base sites. The relative activity of each type of site is
                                    conductivity, and readily modified structure and surface chemistries,           unknown.
                                    carbon-based catalysts are routinely used for energy storage, sen-                   Developing OCFGs composition-function relationships remains
                                    sors, electrocatalysis, and heterogeneous catalysis1–3. Pure carbon            elusive due to having many different sites and limitations on char-
                                    with a uniform sp2-hybridized structure is not suitable for catalysis.         acterization stemming from challenges in using ultraviolet and visible
                                    Functionalization with heteroatoms4,5, including N, O, P, etc.,                light-based spectroscopic techniques on carbon17. Specifically, Fourier
                                    makes carbon a prominent support and a metal-free catalyst. The                transform infrared spectroscopy (FTIR), often used to distinguish sites
                                    microenvironment of carbon atoms4,6–8 strongly impacts the inter-              based on the vibrational frequency of the chemical bonds, is inap-
                                    action between reactants, intermediates, and products with                     plicable, as IR photons are almost completely absorbed by carbons.
                                    catalysts9,10. Undoubtedly, oxygen-containing functional groups                While diffuse reflectance IR spectroscopy (DRIFTS) can be applied,
                                    (OCFGs) are widely investigated in many applications10–12. It has been         obtaining IR extinction coefficients is challenging18,19. Temperature-
                                    suggested that the composition in acidic OCFGs (–OH, –COOH, lac-               programmed decomposition mass spectrometry (TPDE-MS) can
                                    tone, carboxylic anhydrides) affects the metal particle size distribu-         detect OCFGs over a temperature range (500 to 1200 K). Yet, surface
                                    tion by serving as coordination sites for metal cations, greatly               functionalities may undergo consecutive transformations giving gas-
                                    dispersing metal particles13. Furthermore, several OCFGs can serve as          phase products formed in situ during TPDE rather than being in the
                                    Brønsted acid sites (BAS), e.g., for dehydration, cellulose hydrolysis,        initial carbon structure20–22. Raman spectroscopy is promising to

                                    1
                                     Department of Chemical and Biomolecular Engineering, University of Delaware, Newark, DE 19716, USA. 2Catalysis Center for Energy Innovation, University of
                                    Delaware, Newark, DE 19716, USA. 3Pacific Northwest National Laboratory, Richland, WA 99352, USA. 4Department of Chemistry and Biochemistry, University
                                    of Delaware, Newark, DE 19716, USA. 5Center for Functional Nanomaterials, Brookhaven National Laboratory, Upton, NY 11973, USA. 6These authors con-
                                    tributed equally: Jiahua Zhou, Piaoping Yang.   e-mail: weiqing@udel.edu; vlachos@udel.edu

                                    Nature Communications | (2023)14:2293                                                                                                                    1
Article https://doi.org/10.1038/s41467-023-37962-3
detect the crystal and molecular structure and very sensitive to the and extremely more active than –COOH (carboxylic group). By intro-
structural disorder of carbon but cannot distinguish OCFGs23. Boehm ducing 15N isotopically labeled acetonitrile adsorbed magic-angle
titration24,25 assumes bases of different strength react with a specific spinning nuclear magnetic resonance (MAS NMR) as a general acid
type of OCFGs but is challenged when distinct chemical functions site identification method for carbons, and comprehensive density
possess similar pKa values. Furthermore, it cannot distinguish aprotic functional theory (DFT) calculations, we demonstrate that the higher
acidic groups (lactones, carboxylic anhydrides) that can hydrolyze into activity of –OH stems from the carbon microenvironment and speci-
–OH or –COOH in water or acid/base solutions and does not account fically the electron density delocalization caused by aromaticity and
for the porosity and material hydrophilicity/hydrophobicity (in the the number of benzene rings conjugated with the conjugate base of
liquid phase)16,17,25. High-resolution X-ray photoelectron spectroscopy the acid site.
(XPS) is sensitive to the elemental composition and the relative carbon
fraction in various oxidation states. Blume et al.26,27 reported high- Results
quality fits of the C 1s spectra. However, some binding energy signals Identification and quantification of oxygen-containing func-
unavoidably overlap partially due to similar oxygen chemical states in tional groups (OCFGs)
various OCFGs within only a 5 eV energy range. For example, lactones Graphitized mesoporous carbon (GMC) was chosen on account of its
and carboxylic groups containing O = C–O cannot be unambiguously highly graphitic composition (Supplementary Fig. S1), low fraction of
identified through peak fitting. The –OH can be hydroxyl (associated surface functional groups, heteroatoms, and limited density of
with alkyl rings) or phenolic (associated with benzene rings), but it is imperfections, such as twists, non-aromatics, links, and vacancies.
challenging to distinguish the two. Therefore, it is essential to develop Nitric acid oxidation involves oxidative ions (e.g., H3O+, NO3-, NO2+,
general techniques to understand the role of oxygen functionalities in arising from self-dehydration) that attack the aromatic rings, change
such complex materials as carbons. the conjugate carbon atoms (Fig. 1a), and introduce vacancies, defects,
Here we investigate the chemical functionality of carbons by and edge planes. Collectively, nitric acid oxidation forms basic and
synthesizing a diverse library of materials with varying oxygen func- acidic groups (carbonyls, carboxylic, phenolic groups, etc.)31. The
tionalities. We combine multimodal techniques, namely ex situ and oxidized materials were subsequently annealed and are hereafter
in situ XPS and TPDE-MS, gas-phase elimination probe reactions (tert- denoted as GMCs-ox (a h)-b °C (acid treatment for hours and annealed
butanol and isopropanol dehydration)28, and machine learning (ML) at temperature b; see Methods). Figure 1b shows that the intensity ratio
tools (regression, partial least squares, etc.)29,30 to elucidate the pro- of the D-band to G-band (ID/IG) of the oxidized GMCs-ox is lower than
tonated acidic OCFGs (–OH, –COOH) serving as Brønsted acid sites. the as-received-GMCs, revealing conversion of the graphitized carbon
Unexpectedly, we find that –OH (phenolic group) is the dominant site to defects during treatment (conditions in Supplementary Table 1).
a C6, O2, O6
Ar-Carboxyl (G4) Furan (G6) Phenolic (G3)
C4, O3 C3, O4
C3, O4
Hydroxyl (G3)
C5, O1
Quinone (G2)
C1 In-plane sp2 bond stretching
C3, O5
Ether (G7) Lactol (G8)
C3, C6, O2, O4, O5
Pyrone (G1) Lactone (G9) C6, O2, O5
C5, O2
O2, O5
Isolated
R-Carboxyl (G4) Carbonyl
C2 Breathing mode allowed C6, O2, O6 (G5)
in the presence of defects Anhydride (G10) C6, O2, O5
b GMCs-as received
GMCs-oxygenated
c C 1s scan
C1
sp2 (C=C)
C 1s d O 1s scan
O1
C=O
O 1s
C2
sp3 (C-C) O2
C=O
Intensity (arb. units)
Intensity (arb. units)
Intensity (arb. units)
G C3 O3
C-O (phenolic,etc.) C-O-C
O4
C4
C-O (furan, etc.) C-OH
O6
D
O5
C5 C-O-C
C=O O6
C6
C-OH
COO (COOH, etc.) O7 538 536 534 532 530 528
H 2O
ID/IG = 0.58 π-π* satellite
C7
background O4
C8
π-π* satellite C1 O 1s fit O5 O3
O2
background
O6
C 1s fit O7 O1
ID/IG = 0.71 GMCs-ox(24h)-400°C
C8 C7 C6 C5 C4C3C2 GMCs-ox(24h)-200°C
800 1000 1200 1400 1600 1800 2000 294 292 290 288 286 284 282 280 538 536 534 532 530 528
-1
Raman Shift (cm ) Binding Energy (eV) Binding Energy (eV)
Fig. 1 | Carbon surface microenvironment. a Graphitic model structures and received sample. c C 1 s peak fitting of GMCs-ox (24 h)−400 °C and d O 1s peak
oxygen-containing functional groups (OCFGs): green and blue shadings indicate fitting for GMCs-ox (24 h)−200 °C (inset enlarged view of Fig. 1d) for showcasing
acidic and basic OCFGs, respectively. b Raman spectra of as-received GMC and the approach.
GMC-ox (oxygen-functionalized) normalized to the D-band intensity of the GMC-as
Nature Communications | (2023)14:2293 2Article https://doi.org/10.1038/s41467-023-37962-3
Both XPS analysis and CHNS measurement (Supplementary Table 1) carboxylic groups (group O6) almost fully disappear, in line with the
indicate the introduction of oxygen into the carbon without other MS profiles. The protonated groups O4 and O6 are completely elimi-
heteroatom contamination e.g., nitrogen, (Supplementary Fig. 1a, nated when annealed at 800 °C (Fig. 2b, top) due to their lower thermal
Table 2, Fig. 3). The elemental composition can be determined from stability than species in group O2 and O3. These findings agree with
the C 1s and O 1s core-level spectra with sensitivity factors from the MS data. In summary, we conclude that the MS data and the fittings of
Kratos library20 (Supplementary Table 1). Figure 1c, d exhibits the the O 1s difference spectra furnish comprehensive data for quantifying
representative and stable C 1s and O 1s fitting models26,32 of two sam- the OCFGs from the XPS fitting model we use in the present work.
ples, with detailed fitting basis and assignments, fitting parameters, Figure 2c, d shows the distribution of sp2 vs. sp3-hybridized carbon and
and Monte Carlo error analysis in Supplementary Note 1. The quanti- OCFGs in the oxidation and annealing steps and provides mechanistic
fication of the species from the C 1s spectra (Supplementary Fig. 4a, c; understanding during the treatments. Notably, after six hours of nitric
Fig. 5) is disturbed by the asymmetric structure of the graphitic carbon acid treatment, the graphitic (sp2-hybridized) carbon has decreased
peak (group C1, Imax = 284.4 eV) up to high binding energies. Differ- significantly, indicating structure damage at early times, giving rise to
ences in OCFGs (range higher than 285 eV) can still be observed by sp3 carbon20. At longer oxidation times, the sp2 and sp3 carbons change
subtracting the GMCs-ox C 1s spectra from the as-received GMCs more gradually. The oxygenated groups more likely form early on at
(Supplementary Fig. S4). Minor errors in the subtraction of the gra- the more reactive sp3 carbons of pentagons or heptagons. Consistent
phitic peak result in a large error due to the small OCFGs fractions, with the MS profiles, the density of protonated O4 and O6 groups is
highlighting one of the challenges in data analysis33. Although assign- anticorrelated with the annealing temperature but positively corre-
ing the chemical bonds contributing to the O 1s core-level spectrum lated with the oxidation time. Clearly, the acidic groups (phenolic,
(Fig. 1d) is less straightforward34–36, the differences in spectra among carboxylic, anhydride, lactone, etc.) are predominantly obtained by
samples are again statistically significant (Supplementary Fig. 3b, d). low-temperature liquid-phase oxidation. In contrast, the basic groups
Below, we use spectra differences as part of our approach. The various (ketones, quinones, and isolated carbonyl groups) form primarily
carbon Ci (species from C 1s fitting) and oxygen Oi (species from O 1s upon annealing in an inert gas at temperatures > 400 °C. These
fitting) groups depicted in Fig. 1a that are quantified from the XPS data, expected findings can guide future materials synthesis. Overall, var-
e.g., C3, C6, or O4, do not in most cases correspond to a single func- ious oxygenated groups are simultaneously introduced upon acid
tional group and thus to a single active site, but rather to a collection of treatment and further adjusted with thermal treatment.
a few of them. Conversely, individual oxygen species may appear in
several XPS groups, correlating XPS groups. These correlations com- Correlating alcohol dehydration with multiple-acid active
plicate the data analysis and development of structure-reactivity centers
relations. For example, standard principal component analysis of the Expectedly, the acidic and basic OCFGs give the material acid-base
groups affecting the reaction rate gives unphysical results. It is thus bifunctional properties37,38. The base properties result probably from
crucial to account for these correlations to reveal the actual the adsorbed O− and O2− species or pyrone-like structures39, whereas
active sites. the acid properties stem from protonated species including carboxylic
To unequivocally unravel the distribution of groups, we combine (–COOH) and phenolic/hydroxyl groups (−OH). Other OCFGs with
XPS with TPDE-MS (Fig. 2a) of the CO, CO2, H2O released upon heating complicated structures, such as lactones, are non-catalytic. Water or an
the samples (previously annealed at various temperatures). Compar- acidic/basic environment can hydrolyze some of these OCFGs into
ison of the pristine and annealed samples reveals important mechan- protonated groups (for example, carboxylic anhydrides form two
istic information on the stability of the various groups. As shown in carboxylic groups and lactones generate one carboxylic and a neigh-
Fig. 2a, the broad CO2 peak in the pristine GMCs-ox (48 h) sample from boring phenolic group, respectively)16. This interconversion of groups,
150 to 400 °C with a maximum around 250 °C is attributed to the potentially during reaction, can complicate the development of
decomposition of carboxylic groups (group O6)37. The shoulder at structure-reactivity relations as the number and type of sites may
400–600 °C stems from the decomposition of carboxylic anhydride occur at time scales comparable to those of chemical reactions
and lactones (groups in O2 and O5), which are more stable than the (see below).
carboxylic groups (group O6). The H2O peak at 250 °C is attributed to To reveal the Brønsted acidic nature of OCFGs, we employed tert-
the dehydration of phenolic/hydroxyl groups (group O4) or the for- butanol (t-BuOH) dehydration to isobutene as a probe acid-catalyzed
mation of carboxylic anhydrides from the condensation of neighbor- reaction28,40,41. Figure 3a depicts time-on-stream (TOS) data for the as-
ing carboxylic groups (group O6). Notably, the significant peak at received and the four oxidized carbons, illustrating the initial rate
600–650 °C in the CO profile arises predominantly from the degra- (circles on the y-axis). The rate varies slowly with TOS. The practically
dation of phenolic or ethers from the C–O bond (groups in O3, O4, O5; zero dehydration rate over the as-received GMC (Fig. 3a, bottom)
Fig. 1a). Peaks higher than 650 °C are ascribed to C = O from ether, indicates minimal acidity. In stark contrast, samples with abundant
ketone, or quinone groups (groups in O1, O2, O5). acidic OCFGs (Fig. 2c) exhibit high initial dehydration rate (Fig. 3a,
Figure 2b displays the fittings of the O 1s difference spectra of middle and top). However, the initial dehydration rate does not scale
samples annealed at various temperatures. The data are correlated linearly with the oxygen content (Fig. 3b). Specifically, samples with
with the H2O, CO2, and CO MS profiles. The difference spectra between similar oxygen content can show profoundly different initial rates by
GMCs-ox (48 h)−200 °C and GMCs-ox (48 h)−400 °C can be fitted with an order of magnitude (see data with O between 1 and 4 mmol/gcat.;
four peaks (Fig. 2b, bottom). The 531.2 eV is assigned to the C = O gray ellipse). A similar rate is obtained using materials with an oxygen
double bond of (group O2) ketones, lactones, anhydrides, etc.; the content varying significantly from 1 to 3 mmol/gcat. (Bottom data in
531.9 eV to the C–O–C in furans or keto-enolic tautomers of group O3; Fig. 3b; blue ellipse). Consequently, the variation in type, strength, and
the 532.7 eV to the phenolic group (group O4), and the 534.2 eV to the carbon hybridization makes it challenging to correlate the Brønsted
carboxylic group (group O6). Consistent with the TPDE profile of the acid active sites to the dehydration rate.
pristine GMCs-ox (48 h) and GMCs-ox (48 h)−400 °C, the carboxylic It is challenging to unravel the contribution of the dominant
group (group O6) is mainly removed, and the phenolic group (group OCFGs (individual groups, Fig. 1a, Fig. 3g) to the alcohol dehydration
O4) is partially condensed upon annealing at 400 °C. In addition, the (Fig. 3a, b) due to the overlap of binding energies among functional
phenolic/hydroxyl species (group O4) in the difference spectra of groups in the XPS spectra. The C 1s and O 1s core-level XPS spectra
GMCs-ox (48 h)−400 °C and GMCs-ox (48 h)−600 °C (Fig. 2b, middle) fitting provides information about multiple groups at once, as shown
are largely decomposed upon annealing at 600 °C. In contrast, in Fig. 1a. We employ stoichiometric relationships between the XPS
Nature Communications | (2023)14:2293 3Article https://doi.org/10.1038/s41467-023-37962-3 Fig. 2 | Carbon hybridization and OCFGs at various conditions. a TPDE-MS (hatched areas including the fit). Concentration of carbon and functional groups profiles of CO, CO2, and H2O for GMCs-ox (48 h)-fresh, GMCs-ox (48 h)-b °C, from C 1s and O 1s fittings during pretreatment at c various oxidation times, and (b = 400, 600, and 800 °C). b O 1s ranges of XPS spectra and difference spectra d annealing temperatures after oxidation for 48 h. fitting groups of the fresh sample (C3-C6 (j = 1–4) and O1-O6 (j = 5–10)) correlation between G3 and G5. Likewise, the ordinary least squares and the intrinsic oxygen functional groups (Gi (i = 1–10)) to quantify regression of the dehydration rate with Gi (Fig. 3d) also suggests that the latter and build OCFGs-reactivity relations (See Supplementary G3 is the dominant active site, further confirmed by the partial least Note 3). Before decoupling the OCFGs into individual groups (Gi), we regression (Supplementary Fig. S8). The 95% credible intervals of the correct the surface oxygen content obtained from XPS with bulk G3 (hydroxyl/phenolic) site, showing the lowest root-mean-squared content measured by CHNS (Supplementary Note 2). We then inves- error (RMSE) range (Bayesian analysis, Supplementary Fig. S9) without tigate the OCFGs-reactivity relationship using elementary machine overlapping with any alternative candidates and the best linear learning tools including correlation matrix, ordinary least squares regression statistically, deduce it as the optimal active site. regression, and partial least regression. To eliminate the dynamic To better understand the dynamics of surface species upon change of the OCFGs during reaction, we consider the initial reaction thermal treatment and exposure to H2O, we employ 2-propanol (IPA) rate and the group concentration obtained from the fresh samples for as the probe molecule and the typical acid-catalyzed dehydration37 to these data analyses. The correlation matrix indicates that three acid propylene on acid sites and dehydrogenation to acetone catalyzed by groups, namely G3 (phenolic/hydroxyl), G4 (carboxylic), and G10 acid-base pairs (Fig. 3e). At 250 °C, over the oxidized GMCs, 2-propanol (carboxylic anhydride), positively impact the dehydration activity. G3 undergoes almost exclusively dehydration to propylene and non- exhibits the strongest positive correlation (0.93) with the dehydration dehydrogenation product (acetone) was detected, indicating a surface rate (Fig. 3c). In contrast, the basic groups, except for G5 (isolated free of Lewis acid42, acid-base pairs and metal sites43,44. As shown in carbonyl), correlate weakly with the reaction rate. The strong positive Fig. 3e, the steamed catalyst is less active than the fresh one but more effect of G5 on the reaction rate could merely be the result of the active than the annealed catalyst, suggesting that the fast deactivation Nature Communications | (2023)14:2293 4
Article                                                                                                              https://doi.org/10.1038/s41467-023-37962-3

Fig. 3 | Probe reaction and key reactivity descriptors. a tert-butanol dehydration      initial rate with treatment conditions). Pretreatment conditions: annealing for 1 h;
rate on oxidized samples. Reaction conditions: 140 °C, 4 mol% t-BuOH, 10 mg cat-        steaming for 1 h with 0.1 bar steaming; carrier gas of 100 mL/min N2/He or N2/water
alyst. The initial rates are estimated using a 3rd-order polynomial fit and extra-       mixture. Reaction conditions: 250 °C, 4 mol% 2-propanol, 100 mL/min N2/2-pro-
polated to zero reaction time. b Correlation between oxygen content and initial         panol mixture, 50 mg catalyst. f Dynamics of active sites during reaction at 140 °C
rate. c Correlation matrix, showing the correlation coefficients between descriptor      (inset: scheme of hydrolysis of non-protonated acidic groups). Reaction conditions:
pairs. The purple and gray colors indicate a strong positive and negative correlation   140 °C, 4 mol% t-BuOH, 10 mg catalyst, carrier gas 100 mL/min water/N2 mixture.
between factors. d R square of scatter plot of the initial rate against the con-        g Structure models of individual groups: green and blue shadings indicate acidic
centration of OCFGs. e Dynamics of active sites with pretreatment conditions (inset     and basic OCFGs, respectively.

is due to the loss of active sites (thermally desorbed and coking)                      140 °C influence the dehydration rate slightly, suggesting minor and
(in situ XPS, Supplementary Figs. 10–12; ex situ XPS, Supplementary                     very slow hydrolysis of anhydride at low reaction temperature
Figs. 14, 15; TPDE-MS, Supplementary Fig. 16); and the in situ formation                (140 °C). Therefore, we exclude the unprotonated acidic groups (G10,
of protonated carboxylic group (G4) (from hydrolysis of carboxylic                      carboxylic anhydride) from the active sites contributing to the initial
anhydrides by steaming in 0.1 bar H2O at 250 °C) compensates for the                    dehydration reactivity at 140 °C.
deactivation resulting from thermal decomposition (air free XPS of                           With the number of active centers (G3, −OH; G4, −COOH) quan-
steamed sample, Supplementary Fig. 17). To eliminate the complica-                      tified and the exclusion of the G10 as possible active center, we con-
tion from the in situ formed –COOH (from hydrolysis of carboxylic                       struct a two-parameter kinetic model and three one-parameter models
anhydride) causing difficulties in obtaining intrinsic activity of active                to estimate the TOF of t-BuOH dehydration on each active site.
species, we investigate the dynamics of active sites with various reac-                 (See details in Supplementary Note 4.) Due to the dynamic change of
tion conditions in t-BuOH dehydration (Fig. 3f). Water co-feed from the                 the OCFGs during reaction (Supplementary Figs. 14, 15), we correlate
beginning (Fig. 3f) gives intuitively a decreased initial dehydration rate              the overall t-BuOH initial dehydration rate with the number of –OH
due to enhancement of the reverse, equilibrium-limited dehydration                      and/or –COOH in the four models (Supplementary Table 20). The two-
reaction28. Water co-feed in the middle (Fig. 3f) of the reaction slightly              parameter kinetic model (model A) estimated that the TOF of –OH
dropped the reactivity compared with the one cofeeding water from                       (phenolic/hydroxyl) groups is higher than that of –COOH (Supple-
the beginning, suggesting the minor compensating effect of water. 1 h                   mentary Table 20); notably, the TOF of –COOH could be lower, even
steaming and annealing pretreatments (Fig. 3f) over the catalyst at                     zero, due to the confidence interval including zero (Supplementary

Nature Communications | (2023)14:2293                                                                                                                                     5
Article https://doi.org/10.1038/s41467-023-37962-3
Table 21, model A), further suggesting that –OH (phenolic/hydroxyl) neighboring aromatic rings of the support more extensively than
groups are more active than –COOH groups. Furthermore, model C, –COO–. Thus, the relative acidity of the –OH and –COOH groups is
which assumes –OH is the unique active site, exhibits the best essentially determined by the support. The deprotonation energies
regression, further indicating –OH is more active than –COOH for (DPE) of the two sites seem to be aligned with these observations as the
alcohol dehydration. This is a counterintuitive result; aliphatic alcohols DPE of –OH is smaller than that of –COOH by 0.16 eV. The effect of
are known to be less acidic than their corresponding acids. We delocalization on the Brønsted acidic character of the hydroxyl is also
examine the physical basis and the dehydration mechanism using evident in the varying DPE with the number of the fused aromatic rings
calculations and introduce NMR for acid site characterization of in the following pairs: phenol, benzoic acid; 1-naphthol, 1-naphthoic
carbons next. acid; 1-anthrol, 1-anthracenecarboxylic acid; 1-pyrenol,
1-pyrenecarboxylic acid; and 1-coronenol, coronene-1-carboxylic acid.
Mechanistic study and acid site verification Figure. S21 in the Supporting Information illustrates the transition
To understand the reasons behind the higher activity of –OH, we from phenol being less acidic than benzoic acid to 1-coronenol being
performed DFT calculations for the dehydration of 2-propanol over more acidic than coronene-1-carboxylic acid.
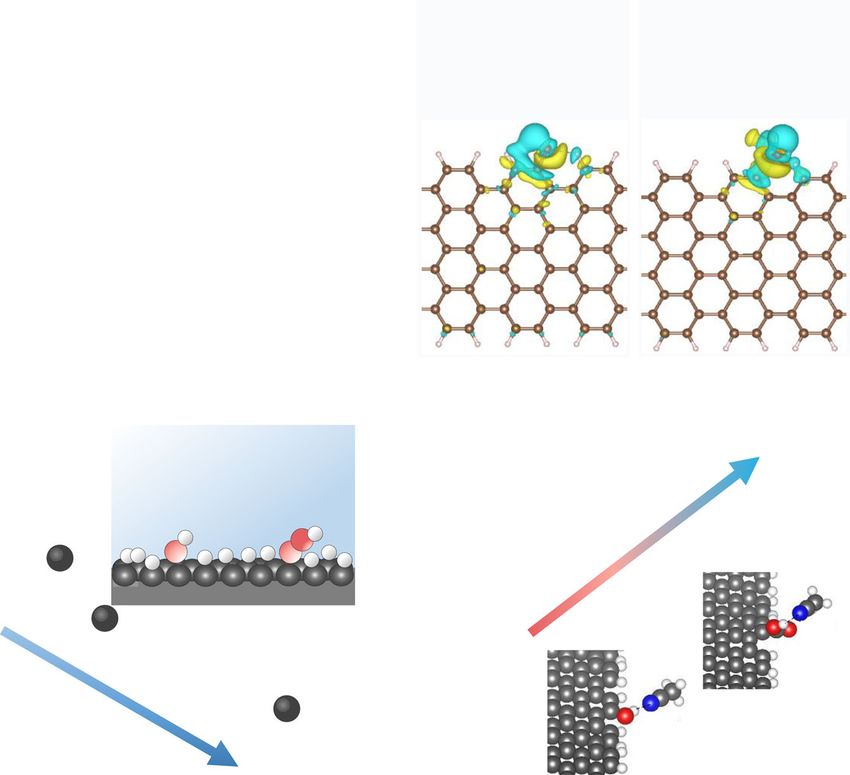
–OH (phenolic) and –COOH associated with benzene rings. We To assess the DFT calculations and provide further evidence of the
demonstrated that most of the –OH were in the form of phenolics acid sites, we have used 15N MAS NMR of absorbed acetonitrile (ACN, a
(–OH associated with benzene rings) and –COOH are showed as the weak base) from the gas or liquid phase to distinguish the acidity
Ar–COOH (–COOH associated with benzene rings) due to the non- strength of –OH (phenolic/hydroxyl) and –COOH (Ar/R-carboxylic)
reduction preparation and treatment atmosphere. The active sites, due to the high sensitivity of magnetic shielding to the local electronic
–OH and –COOH, were grafted onto terminal sites of the armchair and environment of the observed nucleus. 15N MAS NMR spectra of ACN
zigzag graphene ribbons; the optimized geometries of the four models chemisorption from the gas phase at very low surface coverage show
are shown in Fig. S18. The Brønsted acid-catalyzed dehydration of IPA peaks of ACN strongly bonded to acid sites (Supplementary Fig. 22).
is well understood, and our calculations did not reveal any deviations The chemical shift of the acidic OCFGs is lower than the as-received
from the E1 mechanism (Fig. 4a, b). After binding, the IPA hydroxyl GMCs. Figure 4f depicts the correlation between the 15N chemical shift
accepts a proton from the Brønsted site (–OH or –COOH). A water and the –OH/–COOH concentration ratio based on XPS analysis.
molecule is eliminated, and the resulting intermediate carbocation is Notably, the chemical shift of δiso (15N) decreases with increasing –OH/
stabilized by the conjugate base (–O− or –COO−). We considered the –COOH ratio (quantified by XPS), suggesting the average –OH in this
ensuing β-elimination to propylene both in the presence and absence carbon material has stronger Brønsted acidity than the average
of the produced water molecule at the catalyst surface. The free energy –COOH. Due to the high mobility of ACN, even at low coverage, and
profiles for the overall reaction on the two sites are compared in acid site heterogeneity, the experimentally measured value of δiso (15N)
Fig. 4c. Two observations are in order: (a) dehydration on the –OH site is effectively a superposition of ACN at different binding locations
requires 0.3 eV less activation energy than on the –COOH site, (–OH and –COOH). To confirm this, ACN was deposited from liquid
revealing that the former is a stronger Brønsted acid, in agreement phase at surface coverage above monolayer with gradual desorption
with our experimental data; (b) the β-elimination is slightly more facile (15N NMR result, Supplementary Note 5, Figs. 23, 24). 15N MAS NMR
on the –O− group than on the –COO− group by 0.12 eV in the presence reveals four different peaks. Based on the relative desorption rate, the
of the water molecule but the order is reversed when the water peaks were assigned to liquid phase ACN, strongly/loosely physically
molecule is not at the surface. The latter has no kinetic implications, absorbed ACN, ACN absorbed on weak acid sites, and ACN absorbed
however, because clearly the water elimination (first step) is rate lim- on strong acid sites. However, it is impossible to distinguish the exact
iting. Additionally, we note that both intermediates (AH_C3H8O* and position of –OH and –COOH, even in spectra measured at low tem-
A_C3H7_H2O*) in the first step are less stable on the –OH site than on the peratures (−25 to −75 °C), due to the complex carbon microenviron-
–COOH site but the stability of transition states (TS1) exhibits an ment around acid sites. It was reported that the main interaction of the
opposite trend. This can be understood by the differences in hydrogen probe molecule (15N ACN) with the hydroxy (in zeolite) is via a N···H–O
bonding on the two sites. Specifically, IPA bound to the –COOH site type hydrogen bond to the Brønsted proton. Until recently, the iso-
participates in two hydrogen bonds, –H2O2···O1H1– and –H1O1···O3– tropic shift of nitrilic nitrogen atoms (δiso 15N) was believed to be a
(Supplementary Fig. 20a) but only in one hydrogen bond, descriptor of the BAS acidity strength; 15N chemical shifts to a lower
–H2O2···O1H1–, when it is bound to the –OH site (Supplementary frequency (decrease in ppm) correspond to strong BAS45–47. The che-
Fig. 20b). This explains the difference in stability of the intermediates mical shift can be reflected in the N···H bond length; a stronger N···H
prior to reaction. The corresponding transition states, however, are bond (i.e., a shorter the r (N···H)) shields nitrogen more, and shifts the
stabilized by only one hydrogen bond each (O2-O1, Supplementary electron density toward the nitrogen atom, resulting in the 15N che-
Fig. 20c, d). On the –OH site, the H-bond is stronger than on the mical shift to lower frequency45. Consistently, the theoretical chemical
–COOH site as the respective O2-O1 H-bond lengths are 2.534 and shift of 15N over –OH is 260.43 ppm, which is smaller than on –COOH
2.646 Å. After protonation and C–O bond cleavage, which proceed in a (264.79 ppm). The calculated N···H bond length shown in Fig. 4g fur-
concerted manner (Supplementary Fig. 20e, f), the O2-O1 bond on the ther verifies the lower chemical shift of –OH than –COOH. Thus, 15N
–OH site is longer than on the –COOH site (2.863 Å vs. 2.798 Å), leading NMR of absorbed ACN can be effectively applied to estimate the
to a less stable intermediate. average surface acidity of –COOH and –OH, despite ambiguities con-
At first sight, the conclusion that we have a stronger Brønsted acid cerning the exact position of each site type (phenolic –OH or Ar/
in –OH than in –COOH might be surprising. However, consideration of R–COOH), which is further proved by ACN absorbed at low and high
the bond structure around the grafting sites can readily explain it. The coverages.
conjugate base of –COOH prefers to delocalize its excess charge over
its two oxo groups. On the other hand, the conjugate base of –OH can Discussion
delocalize electron density over a network of conjugated double Oxygenated carbon materials as metal-free catalysts have been
bonds furnished by the aromatic rings of the support and, as a result, is demonstrated in many vital applications, but the catalytic activities
more stabilized, resulting in the hydroxyl’s stronger acidic character. of the functional groups have remained elusive. The combination of
That this is indeed the case can be seen in Fig. 4d, where we plot the XPS and TPDE-MS, computational modeling, machine learning (data
excess electron densities of the two conjugate bases. It is evident that analysis) and the dehydration probe reactions can reveal the acidic
–O– delocalizes its electron density over the carbon atoms of the OCFGs. Our study further demonstrates that the acidic groups
Nature Communications | (2023)14:2293 6Article https://doi.org/10.1038/s41467-023-37962-3 Fig. 4 | Reaction pathways of IPA dehydration on the on acidic OCFGs and excess charge. e 15N chemical shifts (from gas-phase absorbed 15N ACN) against strength of acidity. IPA dehydration pathways at a –OH and b –COOH. –OH/–COOH concentration ratio. f Theoretical isotropic 15N chemical shifts of c Corresponding Gibbs free energy profiles at 523 K (Brønsted acid site and con- C ≡ 15N···H for –OH and –COOH vs. H···N bond length. jugate base denoted by AH and A, respectively). d Delocalization of conjugate base (hydroxyl/phenolic, Ar/R-carboxylic, anhydride groups) can sig- reactions, we have developed a methodology for analyzing complex nificantly be modulated by changing the pretreatment conditions systems. Combining probe reactions and multimodal characteriza- (thermal treatment, steaming at various temperatures). The non- tions, we identified the acidic groups and mathematically quantified protonated acidic anhydride can be hydrolyzed to form in situ pro- the active species on carbon surfaces. The methodology for site tonated groups in gas-phase reactions at high steaming tempera- characterization can be applied to more complex reactions that tures (250 °C) but slower at low temperatures (140 °C). The –OH involve carbon as a support. Overall, the analytical approaches and (phenolic/hydroxyl) and –COOH (Ar/R-carboxylic) are the dominant findings presented here can be extended to other carbon-based acid acidic active sites. Strikingly, the higher activity of –OH (phenolic) site-driven heterogeneous catalysis and materials containing other than –COOH (Ar-carboxylic) is evidenced by DFT calculations, NMR heteroatoms. characterization, and deprotonation energies. While OCFGs are simply classified as acidic and basic, the reactivity of OCFGs can Methods counterintuitively change profoundly by the carbon microenviron- Preparation of functionalized carbon materials ment because of the electron density delocalization resulting from Graphitized mesoporous carbon (GMC) (Sigma-Aldrich, 99% trace metal basis) was first treated with concentrated nitric acid Nature Communications | (2023)14:2293 7
Article                                                                                               https://doi.org/10.1038/s41467-023-37962-3

(Sigma-Aldrich, 70%, purified by redistillation, ≥ 99.999% trace metals    dehydration reaction used in the in situ XPS studies, the samples were
basis) under vigorous magnetic stirring at 130 °C for varying time. The   exposed to 1 torr isopropyl alcohol (IPA) at 250 °C for 100 min.
ratio of nitric acid to carbon was set as 150 mL to 6 g to keep the             All XPS spectra were processed using the CASA XPS version 2.3.22
concentration of HNO3 constant. After treatment, the solution was         PR1.0 by using a Shirley background, and the C 1s features were cali-
cooled to room temperature, centrifugated, and washed with deio-          brated based on the sp2 peak at 284.4 eV referenced to the highly
nized water until the pH reaches 7. Then the carbon samples were          oriented pyrolytic graphite (HOPG) peak and fitted with an asymmetric
dried at 110 °C for 24 h. Finally, the samples were annealed in a tube    line shape with the Doniach–Sunjic (DS line-shape) model48. The rest of
furnace at different temperatures for 1 h under Helium with a 100 mL/     OCFGs in the C 1s region were constrained with symmetric line-shape
min flow rate and a heating ramping of 1.5 °C/min. The samples are         (Gaussian–Lorentzian mixture) and the same full-width half-maximum
labeled as GMCs-ox (a h)-b °C, with a and b corresponding to the HNO3     (FWHM) based on the structure and graphitization of carbon
treatment time (a = 6 h, 12 h, 24 h, 48 h) and annealing temperature      materials26,27 (detailed fitting procedure is summarized in Supple-
(b = 200 °C, 400 °C, 600 °C, 800 °C), respectively.                       mentary Note 1). To obtain high-quality fits, we adjusted the relative
                                                                          sensitivity factors (RSF) in the component until the effective RSF was
Raman characterization                                                    equal to unity. The spectra were fitted with a mixed Lorentzian-
The Raman spectra were taken on the HORIBA Raman Spectrometers            Gaussian function.
and Microscopes equipped with a green line solid-state laser with               The fraction of carbon atoms with sp2-hybridization (%) was cal-
532 nm laser source. The N.D. filter fixed at 5% of the laser power. The    culated based on XPS analysis (Eq. 1)
spectra were acquired on different spots and then an average was
taken. The Raman spectra analysis was performed using the LabSpace                                           %C × %sp2
                                                                                               Csp2 ð%Þ =                 area ratio from C 1s fitting         ð1Þ
6 Spectroscopy Software.                                                                                                   100

Specific surface area (BET) measurement                                           Here %C is the percent of the atomic carbon and %sp2 area ratio from C
                                                                                                                         2
The textual properties of the oxygenated carbon samples were mea-         1s fitting is the percent of the peak area of sp from the C 1s deconvo-
sured by N2-adsorption using a Micrometritics Tristar II 3000 Analyzer    lution result.
at 77 K. The pore size distribution was determined by the                        The fraction of OCFGs (%) was calculated from the XPS data (Eq. 2)
Barrett–Joyner–Halenda (BJH) method, and the specific surface area
was calculated from the isotherms using the Brunauer–Emmett–Teller                                    %C ðor OÞ × %OCFGsarea ratio from C 1s or O 1s fitting
                                                                                        OCFGs ð%Þ =                                                            ð2Þ
(BET) method.                                                                                                                100

Temperature-programmed decomposition (TPDE-MS)                                Here %O is the percent of oxygen and %OCFGs area ratio from C 1s or O 1s
The TPDE-MS experiments of the oxidized GMCs materials were car-               is the percent of the peak area of the oxygen functional groups
                                                                          fitting
ried out in an inhouse-built fixed bed reactor operating at near           from C 1s and O 1s deconvolution.
atmospheric pressure in helium. Typically, 50 mg of the catalyst with a       The determination of xj (molar concentration of OCFGs types
particle size range of 40-60 mesh was loaded into a quartz tube and       normalized to catalyst weight, molCj/gcat or molO/gcat) from the XPS
dehydrated at 80 °C for 30 min in the flow of 50 mL/min He. Subse-         peak ratios is based on (Eq. 3):
quently, the sample was heated to 800 °C (10 °C/min), during which
effluent was monitored using the mass spectrometry (MS, Omnistar,                       x j = XPSpeakratio =carbonðor oxygenÞ molar mass
Pfeiffer). The following AMUs were used for analysis: H2O (m/z = 18),                                × carbon ðor oxygenÞ mass weight
CO2 (m/z = 44), CO (m/z = 28), and He (m/z = 4).                                                                                                               ð3Þ
                                                                                                       mol C typej mol C total g C total
                                                                                                     =             ×           ×
                                                                                                       mol C total   g C total   g cat
Elemental analysis
Elemental analyses (CHNS) were performed with an Elementar Vario               To convert atomic percent from XPS to weight percent, we use
Cube CHNS, equipped with the thermal conductivity detector, and the       (Eq. 4):
C, H, S traps for separation in the Advanced Materials Characteriza-
tions Lab at the University of Delaware. The sample combustion tem-                                                 O% ðatomic percentÞ × 16
                                                                                      O% ðweight percentÞ =                                                    ð4Þ
perature can be heated up to 1200 °C. The precision is ~1% for                                                       ð1O%Þ × 12 + O% × 16
homogeneous samples.
                                                                               The quantification of C, O content was obtained from the core-
X-ray photoelectron spectroscopy                                          level C 1s and O 1s spectra, with the relative sensitivity factors C 1s
Ex situ XPS measurements were conducted in a thermo-fisher Kα              0.296 and O 1s 0.711, respectively. The calculations are based on the
(1486.6 eV) + X-ray photoelectron spectrometer equipped with a            following equation (Eq. 5)
monochromatic aluminum Kα X-ray source (300−400 nm). The scan-
ning parameters are 0.1 eV for the survey and detailed scanning. The                                          ni I i =Si
                                                                                                                =                                              ð5Þ
powdered catalyst sample was pressed on a Cu foil to prevent con-                                             nj I j =Sj
tamination from other carbon resources.
     The near ambient pressure XPS (NAP-XPS) experiments were                  The calculation of the OCFGs concentration is mainly based on
conducted at the Center for Functional Nanomaterials (CFN), Broo-         the assumption that oxygen is distributed uniformly throughout the
khaven National Laboratory (BNL). The carbon materials were scanned       spherical carbon.
with a lab-based SPECS Surface Nano Analysis spectrometer. The
                                                                          15
instrument was equipped with a SPECS Phoibos analyzer and a                N solid-state MAS NMR spectroscopy
monochromated Al (1486.6 eV) photon source. The sample powders            Gas-phase absorption procedure: prior to the adsorption of the
were pressed to a cleaned thin Cu foil and transferred into the vacuum    probe molecule (15N labeled acetonitrile, ACN, Cambridge Isotope
chamber. C 1s and O 1s survey spectra were collected during all pro-      Laboratories, Andover, MA), a desirable amount of catalyst was first
cedures. The oxidized GMCs samples in UHV were treated in the pre-        placed in a fixed-bed reactor at near ambient pressure. The sample
paration chamber of the XPS setup at various temperatures. For the        was first degassed at 100 °C in argon (Ar, 99.999% purity) for 1 h. The

Nature Communications | (2023)14:2293                                                                                                                           8
Article https://doi.org/10.1038/s41467-023-37962-3
samples then were treated with the mixture of 15N labeled acetonitrile dehydration rate. These various elementary machine learning were
and Ar was injected by a syringe pump, and the flow rate was con- carried out using Python software.
trolled at 50 mL/min. The treatment was performed at room tem-
perature (RT, 25 °C) and then completed when the concentration of DFT calculations
15
N ACN reached an equilibrium (~60 min). The tail gas in the whole Spin-polarized DFT calculations were performed using the Vienna ab
process was analyzed online continuously by gas chromatography initio software package (VASP, version 5.4.1)49. The electron
(GC, Agilent 7890 A) equipped with a flame ionization detector. The exchange and correlation effects were described by
sealed reactor was transferred into an N2-filled glovebox. The treated Perdew–Burke–Erzenhof (PBE) exchange-correlation functional50.
sample was then packed and sealed in a 3.2-mm zirconia NMR rotor The core electrons were represented with the projector augmented
inside the glove box. 15N and 1H one-dimensional spectra were col- wave (PAW)51 method and a plane-wave cutoff of 500 eV was used for
lected on a 14.1T Bruker Avance III spectrometer with a 3.2 mm HCN the valence electrons. Van der Waals interactions were considered via
probe, spinning at 12–14 kHz MAS. The sample temperature was dispersion-corrected density functional theory calculation (DFT-
maintained at 25 °C. All spectra were acquired with 15N direct polar- D3)52 in the simulations. The Gaussian smearing method with a
ization, a 5.1 µs 90° pulse, and a 5 s recycle delay. 5120–15360 scans smearing width of 0.05 eV was employed. The pristine graphene
were acquired per sample. For 1H NMR spectra, a 180°−90° sequence ribbon with armchair edges contained 54 C atoms and 12 H atoms,
with a 10 ms interpulse delay was used to reduce the background while the one with zigzag edges consisted of 60 C atoms and 12 H
signal. All 1H spectra were acquired with a 3.4 µs 90° pulse, 512 scans, atoms. The vacuum space in the z-direction was set to 25 Å and the in-
and a 3 s recycle delay. plane vacuum between ribbons was set to at least 15 Å. Brillouin zone
Liquid-phase absorption procedure: 20 µL of 15N-enriched ACN was sampled with a (1 × 3 × 1) k-point and (3 × 1 × 1) k-point grid for
was added to 80 mg of carbon materials, mixed, then sealed for 1 h at the armchair edge model and the zigzag edge model, respectively. All
room temperature. The mixture was open to glove box at room geometry optimizations were performed using the conjugate gra-
temperature for 5, 15, and 60 min before packed into NMR rotors for dient algorithm. The atomic force convergence of 0.02 eV/Å and the
15
N ACN evaporation. Single-pulse 15N MAS NMR experiments of energy tolerance of 10−6 eV were employed. The total energies of the
liquid-phase absorbed ACN were performed on a Varian-DDR 20.0T gases were calculated in boxes of 20 Å × 21 Å × 22 Å using gamma
NMR spectrometer (with a 15N Larmor frequency of 86.12 MHz) using point. To obtain thermal corrections of electronic energies at 523 K,
a commercial 3.2 mm pencil-type probe with a rotor spinning rate of the vibrational frequencies were computed within the harmonic
10–20 kHz. The typical parameters for acquiring quantitative 15N oscillator approximation via diagonalization of the Hessian matrix
spectra were: pulse width = 2 μs with a tip angle of 30 degree, recycle using the central difference approximation with a displacement of
delay time = 10 s (an array of recycle delay varying from 5 s to 60 s 0.015 Å. Transition states were computed using nudged elastic band
confirmed that 10 s is sufficient for reaching equilibrium state and dimer calculations53 and confirmed by vibrational frequency
between each scan), spectrum width = 34.7 kHz, acquisition time = calculations. Thermochemical parameters of gaseous species were
100 ms, number of scans = 1200–4000, and temperature range = taken from the Burcat database54. The free energies of surface spe-
−100 °C to 25 °C (low temperature was controlled using a liquid cies were corrected using the python Multiscale Thermodynamic
nitrogen tank). Toolbox (pMuTT)55.
The deprotonation energy (DPE) was defined as the energy
Probe reactions required to separate the proton from the acid group, as shown below
The probe reactions were carried out in a quartz reactor with an (Eq. 7):
internal diameter of 9 mm. The catalyst bed was fixed by two inert
quartz beds (30-40 mesh) and was placed in the isothermal zone of a DPE = E H + + E A E AH ð7Þ
furnace. A thermocouple, covered by a thin quartz tube, was placed in
the middle of the reactor to infer the catalyst bed temperature. Mass where EH+, EA−, and EAH represent the energies of the proton, conjugate
flow controllers (Brooks) controlled the flow rates; Nitrogen (N2) base group, and acid group. The cluster models with 66 C atoms and
(>99.999%) was used as the carrier gas for purging tert-butanol into the 22 H atoms (before substitution with –OH and –COOH) were employed
reactor, and helium (He) (>99.999%) served as the balance gas. The for DPE calculations. The calculations for charged states were per-
total flow rate of the gas mixture was 100 mL/min. formed by applying a neutralizing uniform background charge
The probe reactant was introduced to the reactor through a gas distribution56.
saturator with controlled temperature. The alcohol flow rate was For NMR calculations, a cutoff energy of 600 eV was used and an
adjusted through the flow rates of N2 and He and the bubbler’s tem- electronic step convergence criterion was set to 10−9 eV.
perature. All pipelines were heated to >150 °C by heating tapes to
prevent alcohol condensation. The reaction products were analyzed Data availability
using gas chromatography (Agilent 7890 A) equipped with a Plot-Q The data to support the findings of this study are provided in
column and a flame ionization detector (FID). The catalyst was pre- the Supplementary Information and paper or from the corresponding
treated in a mixture of N2 (50 mL/min) and He (50 mL/min) at 140 °C author upon request. The DFT-structure coordinates and data that
for 1 h before purging alcohol into the reactor. The initial dehydration support the plots in this paper are available on Mendeley
rate was calculated by extrapolating the data to zero time (Eq. 6). Data57. Source data are provided with this paper.
ninitialtBuOH × Y ield iso-butene
Code availability
Dehydration rate = ð6Þ All source data are provided with this paper. All relevant data are
time × mcat
available on Mendeley Data57. No specialized, home written software
was used for this work.
Machine learning (ML) References
Non-negative Least square regression (NNLS) and partial least squares 1. Benzigar, M. R. et al. Recent advances in functionalized micro and
(PLS) were applied to simplify the complexity of the high- mesoporous carbon materials: synthesis and applications. Chem.
dimensionality data and relate the multiple types of OCFGs with the Soc. Rev. 47, 2680–2721 (2018).
Nature Communications | (2023)14:2293 9Article https://doi.org/10.1038/s41467-023-37962-3
2. Saidi, M. et al. Upgrading of lignin-derived bio-oils by catalytic 24. Goertzen, S. L., Thériault, K. D., Oickle, A. M., Tarasuk, A. C. &
hydrodeoxygenation. Energy Environ. Sci. 7, 103–129 (2014). Andreas, H. A. Standardization of the Boehm titration. Part I. CO2
3. Sudarsanam, P. et al. Functionalised heterogeneous catalysts for expulsion and endpoint determination. Carbon 48,
sustainable biomass valorisation. Chem. Soc. Rev. 47, 1252–1261 (2010).
8349–8402 (2018). 25. Zhang, Z. & Flaherty, D. W. Modified potentiometric titration
4. Li, T., Li, H. & Li, C. Progress in effects of microenvironment of method to distinguish and quantify oxygenated functional groups
carbon-based catalysts on hydrodeoxygenation of biomass. on carbon materials by pKa and chemical reactivity. Carbon 166,
ChemCatChem 13, 1074–1088 (2021). 436–445 (2020).
5. Liu, L., Zhu, Y. P., Su, M. & Yuan, Z. Y. Metal‐free carbonaceous 26. Blume, R. et al. Characterizing graphitic carbon with X-ray photo-
materials as promising heterogeneous catalysts. ChemCatChem 7, electron spectroscopy: a step-by-step approach. ChemCatChem 7,
2765–2787 (2015). 2871–2881 (2015).
6. Galaverna, R. S. et al. Are benzoic acids always more acidic than 27. Reiche, S. et al. Reactivity of mesoporous carbon against water-An
phenols? The case of ortho-, meta-, and para-hydroxybenzoic acids. in-situ XPS study. Carbon 77, 175–183 (2014).
Eur. J. Org. Chem. 10, 2189–2196 (2015). 28. Fu, J. et al. Modulating the dynamics of Brønsted acid sites on
7. Gao, W., Alemany, L. B., Ci, L. & Ajayan, P. M. New insights into the PtWOx inverse catalyst. Nat. Catal. 5, 144–153 (2022).
structure and reduction of graphite oxide. Nat. Chem. 1, 29. Lever, J., Krzywinski, M. & Altman, N. Points of significance: Principal
403–408 (2009). component analysis. Nat. Methods 14, 641–643 (2017).
8. Loh, K. P., Bao, Q., Eda, G. & Chhowalla, M. Graphene oxide as a 30. Medford, A. J., Kunz, M. R., Ewing, S. M., Borders, T. & Fushimi, R.
chemically tunable platform for optical applications. Nat. Chem. 2, Extracting knowledge from data through catalysis informatics. ACS
1015–1024 (2010). Catal. 8, 7403–7429 (2018).
9. Furimsky, E. Graphene-derived supports for hydroprocessing cat- 31. Gerber, I. et al. Theoretical and experimental studies on the carbon‐
alysts. Ind. Eng. Chem. Res. 56, 11359–11371 (2017). nanotube surface oxidation by nitric acid: Interplay between func-
10. Wang, Q., Gupta, N., Wen, G., Abd Hamid, S. B. & Su, D. S. Palladium tionalization and vacancy enlargement. Chem. Eur. J. 17,
and carbon synergistically catalyzed room-temperature hydro- 11467–11477 (2011).
deoxygenation (HDO) of vanillyl alcohol-A typical lignin model 32. Gengenbach, T. R., Major, G. H., Linford, M. R. & Easton, C. D.
molecule. J. Energy Chem. 26, 8–16 (2017). Practical guides for x-ray photoelectron spectroscopy (XPS): Inter-
11. Grzyb, B. et al. Functionalisation and chemical characterisation of preting the carbon 1s spectrum. J. Vac. Sci. Technol. A. 39,
cellulose-derived carbon aerogels. Carbon 48, 2297–2307 (2010). 013204 (2021).
12. Santos, J. L. et al. Hydrodeoxygenation of vanillin over noble metal 33. Desimoni, E. et al. Remarks on the surface characterization of car-
catalyst supported on biochars: Part II: Catalytic behaviour. Appl. bon fibres. Surf. Interface Anal. 18, 623–630 (1992).
Catal. B 268, 118425 (2020). 34. Biniak, S., SzymaE ski, G., Siedlewski, J. & E wiD tkowski, A. The
13. Zhang, J. W. et al. Pd-Ni bimetallic nanoparticles supported on characterization of activated carbons with oxygen and nitrogen
active carbon as an efficient catalyst for hydrodeoxygenation of surface groups. Carbon 35, 1799–1810 (1997).
aldehydes. Appl. Cata. A—Gen. 569, 190–195 (2019). 35. Desimoni, E., Casella, G., Morone, A. & Salvi, A. XPS determination
14. Dutta, S. et al. Solventless C–C coupling of low carbon furanics to of oxygen‐containing functional groups on carbon-fibre surfaces
high carbon fuel precursors using an improved graphene oxide and the cleaning of these surfaces. Surf. Interface Anal. 15,
carbocatalyst. ACS Catal. 7, 3905–3915 (2017). 627–634 (1990).
15. Mortensen, P. M., Grunwaldt, J. D., Jensen, P. A. & Jensen, A. D. 36. Schlögl, R., Loose, G. & Wesemann, M. On the mechanism of the
Screening of catalysts for hydrodeoxygenation of phenol as a oxidation of graphite by molecular oxygen. Solid State Ion. 43,
model compound for bio-oil. Acs. Catal. 3, 1774–1785 (2013). 183–192 (1990).
16. Gabe, A. et al. In-depth analysis of key factors affecting the catalysis 37. Friedel Ortega, K., Arrigo, R., Frank, B., Schlögl, R. & Trunschke, A.
of oxidized carbon blacks for cellulose hydrolysis. ACS Catal. 12, acid–base properties of N-Doped carbon nanotubes: a combined
892–905 (2021). temperature-programmed desorption, X-ray photoelectron spec-
17. Yan, P., Zhang, B., Wu, K. H., Su, D. & Qi, W. Surface chemistry of troscopy, and 2-propanol reaction investigation. Chem. Mater. 28,
nanocarbon: characterization strategies from the viewpoint of cat- 6826–6839 (2016).
alysis and energy conversion. Carbon 143, 915–936 (2019). 38. Lu, S. et al. Dissolution of the heteroatom dopants and formation of
18. Kastner, J. et al. Resonance Raman and infrared spectroscopy of ortho-quinone moieties in the doped carbon materials during water
carbon nanotubes. Chem. Phys. Lett. 221, 53–58 (1994). electrooxidation. J. Am. Chem. Soc. 144, 3250–3258 (2022).
19. Varga, M. et al. Diamond/carbon nanotube composites: Raman, 39. SzymaE ski, G. S. & Rychlicki, G. Importance of oxygen surface
FTIR and XPS spectroscopic studies. Carbon 111, 54–61 (2017). groups in catalytic dehydration and dehydrogenation of butan-2-ol
20. Kundu, S., Wang, Y., Xia, W. & Muhler, M. Thermal stability and promoted by carbon catalysts. Carbon 29, 489–498 (1991).
reducibility of oxygen-containing functional groups on multiwalled 40. Macht, J., Janik, M. J., Neurock, M. & Iglesia, E. Mechanistic con-
carbon nanotube surfaces: a quantitative high-resolution XPS and sequences of composition in acid catalysis by polyoxometalate
TPD/TPR study. J. Phys. Chem. C 112, 16869–16878 (2008). keggin clusters. J. Am. Chem. Soc. 130, 10369–10379 (2008).
21. Kundu, S. et al. The formation of nitrogen-containing functional 41. Roy, S. et al. Mechanistic study of alcohol dehydration on γ-Al2O3.
groups on carbon nanotube surfaces: a quantitative XPS and TPD ACS Catal. 2, 1846–1853 (2012).
study. Phys. Chem. Chem. Phys. 12, 4351–4359 (2010). 42. Wang, C. et al. A characterization study of reactive sites in ALD-
22. Zhou, J. H. et al. Characterization of surface oxygen complexes on synthesized WOx/ZrO2 catalysts. Catalysts 8, 292 (2018).
carbon nanofibers by TPD, XPS and FTIR. Carbon 45, 43. Barlocco, I. et al. Role of defects in carbon materials during metal-
785–796 (2007). free formic acid dehydrogenation. Nanoscale 12,
23. Sadezky, A., Muckenhuber, H., Grothe, H., Niessner, R. & Pöschl, U. 22768–22777 (2020).
Raman microspectroscopy of soot and related carbonaceous 44. Brooks, A., Jenkins, S. J., Wrabetz, S., McGregor, J. & Sacchi, M. The
materials: Spectral analysis and structural information. Carbon 43, dehydrogenation of butane on metal-free graphene. J. Colloid
1731–1742 (2005). Interface Sci. 619, 377–387 (2022).
Nature Communications | (2023)14:2293 10You can also read