UAV Localization Using Autoencoded Satellite Images - arXiv
←
→
Page content transcription
If your browser does not render page correctly, please read the page content below
IEEE ROBOTICS AND AUTOMATION LETTERS. PREPRINT VERSION. ACCEPTED FEBRUARY, 2021                                                           1

                                                UAV Localization Using Autoencoded Satellite
                                                                  Images
                                                                                         Mollie Bianchi and Timothy D. Barfoot

                                            Abstract—We propose and demonstrate a fast, robust method
                                         for using satellite images to localize an Unmanned Aerial Vehicle
                                         (UAV). Previous work using satellite images has large storage and
                                         computation costs and is unable to run in real time. In this work,
arXiv:2102.05692v1 [cs.CV] 10 Feb 2021

                                         we collect Google Earth (GE) images for a desired flight path
                                         offline and an autoencoder is trained to compress these images
                                         to a low-dimensional vector representation while retaining the
                                         key features. This trained autoencoder is used to compress a
                                         real UAV image, which is then compared to the precollected,
                                         nearby, autoencoded GE images using an inner-product kernel.
                                         This results in a distribution of weights over the corresponding
                                         GE image poses and is used to generate a single localization and
                                         associated covariance to represent uncertainty. Our localization
                                         is computed in 1% of the time of the current standard and is
                                         able to achieve a comparable RMSE of less than 3m in our
                                         experiments, where we robustly matched UAV images from six
                                         runs spanning the lighting conditions of a single day to the same
                                         map of satellite images.
                                           Index Terms—Localization; Aerial Systems: Perception and
                                         Autonomy; Vision-Based Navigation

                                                                  I. I NTRODUCTION
                                               NMANNED Aerial Vehicles (UAVs) are being used for
                                         U     more and more applications while still remaining largely
                                         reliant on GPS. The disadvantage of a GPS-based localization
                                                                                                                     Fig. 1: 1. Offline before flight, images are rendered in a grid
                                                                                                                     pattern around the desired path using Google Earth [1]. An
                                         system is that it is susceptible to dropout, jamming, and                   example of this grid pattern is shown at the bottom of the
                                         interference. In GPS-denied environments, the primary sensor                figure. 2. These images are used to train an autoencoder using
                                         becomes vision due to its low weight and fast computation.                  photometric loss and skip losses. 3. All the encoded training
                                            Visual Odometry (VO) is commonly used on UAVs but                        images and the encoder are transferred onto the UAV. 4. The
                                         requires corrections to prevent drift. Visual Simultaneous                  live image captured by the UAV is passed through the trained
                                         Localization and Mapping (SLAM) is one solution to this                     encoder. 5. The encoded live image is compared with a subset
                                         issue, but its use on UAVs has primarily been demonstrated                  of the encoded reference images using an inner-product kernel
                                         in indoor environments or small areas [2]–[4]. One method                   outputting a weight for each reference image. 6. These weights
                                         [5] for long distance autonomous, outdoor, aerial navigation                are used to compute the localization and covariance.
                                         in GPS-denied environments uses the Visual Teach and Repeat
                                         (VT&R) method [6]. By generating a locally consistent visual
                                         map on an outbound pass under manual or GPS control, the                    the lighting conditions along the path have not significantly
                                         UAV is then able to return autonomously along that path                     changed. It does not allow for the repeated traversal of the
                                         without GPS.                                                                path using a map generated much earlier.
                                            VT&R is limited in that it requires a manual outbound pass                  A unique opportunity for aerial vehicles is that there is an
                                         and, because it relies primarily on point-feature matching (e.g.,           existing database of satellite images covering the entire world
                                         Speeded-Up Robust Features (SURF) [7]), the return pass                     in Google Earth (GE). In many areas, these satellite images
                                         must be completed shortly after the outbound pass so that                   have been used to generate a detailed 3D reconstruction of
                                                                                                                     a scene from which it is possible to render an image at any
                                           Manuscript received: October, 15, 2020; Revised: January, 8, 2021; Ac-    desired pose. In [8], the idea was proposed to replace the
                                         cepted: February, 4, 2021. This paper was recommended for publication by
                                         Editor Sven Behnke upon evaluation of the Associate Editor and Reviewers’
                                                                                                                     manual outbound pass in VT&R with a virtual pass in GE.
                                         comments.                                                                      The largest challenge with this idea is finding a way to
                                           The     authors      are   affiliated    with   the     University   of   accurately and robustly localize real live images captured from
                                         Toronto      Institute     for        Aerospace     Studies      (UTIAS):
                                         mollie.bianchi@robotics.utias.utoronto.ca,                                  a UAV with the artificial images rendered from GE. Since
                                         tim.barfoot@utoronto.ca                                                     the satellite images used for the reconstruction were captured
2 IEEE ROBOTICS AND AUTOMATION LETTERS. PREPRINT VERSION. ACCEPTED FEBRUARY, 2021
Fig. 2: An image from each of the six lighting conditions in the dataset and a corresponding image rendered from GE [1] is
shown. The shadows present in the GE images most closely resemble those present in the morning lighting condition. The
shadows in the afternoon and evening datasets appear on the opposite side of objects as compared to GE.
years ago, there are differences with the live images in terms of with learned semantic segmentation [10]. Both these ap-
lighting, small object movement (e.g. vehicles, trailers), large proaches perform better at high-altitude flights where more
structural changes (e.g. building additions/demolitions), and structure is present in the images and suffer in areas com-
unusual object reconstruction, particularly for non-rectangular prising mainly grass and trees. There have been more recent
based objects like trees. This makes it difficult for feature- feature-based methods that match street view images to images
based methods to obtain accurate and robust results in many from a ground robot [11] and a UAV [12], [13]. Place recog-
cases. nition is performed using a visual bag-of-words technique
Patel et al. [8] used multiple GE images rendered around and then followed by image registration using Scale Invariant
the desired flight path and used mutual information (MI) Feature Transform (SIFT) [14] keypoints. However, feature
to search for the best alignment with the live image. This matching has been shown to contain significant numbers of
approach was computationally expensive and would require outliers due to large changes in appearance and viewpoint.
storing thousands of full-sized images on board the UAV. It is The current best method for localization using satellite
not capable of running in real time. images is the MI based approach presented in [8]. This was
This work introduces a new method to use prerendered largely inspired by [15], [16] in which MI had been used to
satellite images that is fast and storage efficient. As in [8], localize monocular camera images within a textured 3D model
images are rendered around the desired flight path in GE. of the environment. Adapting this idea to a UAV, Patel et al. [8]
An autoencoder is trained on these path-specific images to were able to achieve less than 3m and 3◦ Root Mean Square
compress them to a much smaller vector representation. The Error (RMSE) on low-altitude flights at six different times of
same autoencoder is used to compress the live images as well. day. In their work, images were rendered from GE beforehand
The compressed live image vector is compared to all nearby every 3m along the path and around the path at intervals of
compressed GE image vectors through an inner-product kernel. 6m. The Normalized Information Distance (NID), which is a
This results in weights associated with each of the corre- MI based metric, was computed between the live image and
sponding GE image poses. From these weights, a localization all images within 4m of the prior pose estimate (e.g., from
for the longitude, latitude, and heading with accompanying filtering) to select the best-matching image. The alignment
covariance is computed. This method has been demonstrated between this geo-referenced image and the live image was then
on a real UAV dataset of images along a 1.1km path at six computed by a series of coarse and refined optimizations of
different times of day covering several lighting conditions. the warping parameters. Each step of the optimization required
In comparison with [8], we are able to achieve the same numerically computing the Jacobian of the NID with respect to
accuracy performance on image registration and run in 1% the warping parameters. This process was quite slow making
of the computation time. this method incapable of running in real time. As well, the
The rest of this paper is organized as follows. Section images were stored in their full 560 × 315 resolution resulting
II reviews the related work from the literature. Section III in large storage costs for longer paths. We build on the idea
discusses our methodology. Sections IV and V provide our of prerendering images around a desired path in GE, but
experimental results on a real UAV dataset. Section VI wraps improve upon [8] by eliminating the costly optimization step,
up with our conclusions and suggestions for future work. improving runtime, and decreasing storage requirements.
B. Autoencoders
II. R ELATED W ORK
One of the core limitations with [8] is that the images
A. Aerial Visual Localization are large, each is 176,400 pixels making the MI computation
Early works in visual aerial localization looked at using slower. A common learning-based method for compressing
edge detection [9] or a combination of classical techniques images is autoencoders [17]. One neural network acts as theBIANCHI et al.: UAV LOCALIZATION USING AUTOENCODED SATELLITE IMAGES 3
encoder, compressing images down to some low-dimensional
bottleneck. A second network upsamples this bottleneck vector
back to an image with the same size as the original image.
Minimizing some loss function between the original image
and the recreated image, the network can learn to retain
the key features in the bottleneck. There has been lots of
work in this area, including new loss functions [18], [19],
adversarial autoencoders [20], and combining autoencoders
with neural autoregressive models [21]. In this work, we use
an autoencoder architecture based on [18] to compress our
images.
C. Kernels
Kernels, such as the inner-product or exponential kernel,
are often used for matching patches between images, such
as in [22], [23]. They provide a measure of the similarity
between the two patches, but they are not commonly used
for comparisons of whole images due to the high number of Fig. 3: On the left are real images collected by the UAV along
pixels involved. We use kernels on the autoencoded represen- the path. On the right is the corresponding image after passing
tations of whole images. Since these autoencoded images are through the autoencoder and decoder which were only trained
small enough to quickly compute a kernel between them, it on GE images.
eliminates the need for extracting and matching patches from
an image. A. Pre-Flight Image Collection
Using a desired path, images are rendered from GE [1] at
D. Learned Pose Estimation
the intended orientation every 0.5m along the path. Additional
Using learned methods to directly compute the poses of images are rendered at 0.5m lateral offsets out to 5m to either
objects in images, or the relative pose change between two side of the path. This requires 42 images for each meter of
images has been the focus of many works [24]–[26]. However, the path. This coverage could be modified based on expected
these approaches are limited by the available training data. performance of the UAV. For example, if you are expecting
Real data is expensive to collect and label, and synthetic the UAV to operate in windy conditions more images could
data does not typically generalize directly to the real world. be rendered further from the path. Regardless, this leads to a
Alternatively, Sundermeyer et al. [27] use a similar method to high number of images for non-trivial path lengths. Storing
what is proposed in this work to perform 6D Object Detection. and comparing these images in full size would be infeasible.
Instead of explicitly learning from 3D pose annotations during The next step and key aspect of this method is to use an
training, they implicitly learn representations from rendered autoencoder to compress the images to a low-dimensional
3D model views. Using a denoising autoencoder, they generate representation while maintaining the key features of each
a codebook containing the encoded representations of tens image such that comparing the compressed images using a
of thousands of rendered images of the desired object at kernel yields sensible results.
uniformly distributed poses. The same autoencoder is used to
encode a live image and a cosine similarity metric is used to
match the live image with the closest poses from the codebook. B. Autoencoder
With a focus on place-specific excellence, the autoencoder
III. M ETHODOLOGY is trained solely using the precollected images from GE for
The proposed approach can be divided into several steps that desired path. A new autoencoder would need to be trained
as depicted in Figure 1. Offline, images are rendered from for each path. The autoencoder architecture is based on [18]
GE around the desired flight path. Then an autoencoder is as implemented in [28]. The input is a 320 × 160 greyscale
trained for this specific path using these images. These images GE image. The encoder is composed of six layers. Each of
are encoded and saved after passing through the trained the first five layers perform a 2D convolution with a stride
network. While the offline processing is significant, it only of two followed by a batch normalization layer. The number
needs to be completed once per path and would eliminate of channels double as indicated in Figure 4. Finally, a linear
the need for manual mapping flights before each autonomous layer maps the output of the final convolution layer to the
flight as in [5]. In the online component of the pipeline, bottleneck vector. Different sizes were experimented with for
weights for a subset of these autoencoded reference images are the dimension of the bottleneck. A bottleneck of dimension
computed using an inner-product kernel computation with an 1000 was selected as it was the smallest size that could still
autoencoded live image. The localization and corresponding achieve the desired accuracy.
covariance are then computed from these weights. Finally, The decoder behaves opposite the encoder. A linear layer
outlier rejection is performed based on the covariance estimate first maps the bottleneck variable to 1024 channels. This is
from the previous step. then passed to the first of five layers, each of which performs4 IEEE ROBOTICS AND AUTOMATION LETTERS. PREPRINT VERSION. ACCEPTED FEBRUARY, 2021
upsampling by a factor of two, followed by convolution with a the experiments, the network was trained with approximately
stride of three, and batch normalization. The number of chan- 48,000 images. On a Nvidia DGX Station using a single Tesla
nels is halved in each layer until an output greyscale image V100 GPU training took around 20 hours to complete.
with the same dimension as the input image is generated. To It is important to stress that the network is trained only
obtain the compressed image vector, the output after only the on images from GE, but it is still able to generalize to real-
encoder part of the network is used. world images with different lighting conditions. Thus it is able
to be trained before having to actually fly the path. Figure
3 shows some examples of real images reconstructed after
passing through the autoencoder. While the reconstructions are
not as sharp as the reconstruction of the training data as seen
in Figure 4, the main structures in each image are preserved.
For our application of comparing the encoded live image
to encoded reference images, the network achieves sufficient
generalization performance. It may be interesting for future
work to look into using data augmentation during training to
further improve generalization performance similar to [27].
C. Localizing Using Kernels
To minimize time spent loading the autoencoded GE refer-
ence images, all image vectors are stacked and loaded into a
1000 × N dimensional matrix denoted Yge , which is loaded
onto the GPU. Then, based on a prediction of the current
live image pose, Yge is indexed to include only the reference
images that are 4m ahead and behind along the path, which
is the same search area used in [8]. The live image is passed
through the trained autoencoder and the resulting compressed
1000×1 vector is denoted as y. The weights, w, are computed
for the subset of autoencoded GE reference images using a
basic inner-product kernel:
T
w = Yge y. (1)
w contains a similarity measurement between the live image
and each of the reference images. Since there are 336 images
being used for comparison, many of these images have low,
but non-zero, weights. These weights tend to pull the mean
value towards the centre of the area covered by the reference
images. To prevent this and get a result closer to the images
with the highest weights, a new set of weights, wth , is created
by setting all values of the weights less than one standard
deviation of the max weight to zero. The thresholded weights
are then normalized:
wth
w̄th = P . (2)
i wth,i
Fig. 4: The autoencoder architecture is based on [18]. It The longitude and latitude coordinates of each reference
uses traditional photometric loss between the input image and image are stacked in a 2 × N matrix Xge . The thresholded
the reconstructed image as well as skip losses between the weights are used to compute the localization for the longitude
corresponding layers in the encoder and decoder. and latitude according to:
The loss function used to train the network is a combination x̂
x̂ = = Xge w̄th . (3)
of photometric loss between the input and output images, i.e., ŷ
L = (Iinput − Ioutput )2 , and L2 loss between the outputs The covariance is computed using the original weight values:
of corresponding layers referred to as skip losses. These X
additional skip losses are weighted with a value of 0.01 P= wi (xge,i − x̂)(xge,i − x̂)T . (4)
and encourage the decoder to learn the reverse behaviour of i
the encoder and was found to improve performance on the Some examples showing the localization, covariance, and
real image validation sets. The network was trained for 20 weights generated for each nearby GE reference image are
epochs with a learning rate of 1e-4. For the path used in shown in Figure 8.BIANCHI et al.: UAV LOCALIZATION USING AUTOENCODED SATELLITE IMAGES 5
Instead of rendering reference images at multiple headings accompanying covariance. Rejected registrations are indicated
and including them in the previous computation, the heading in red.
computation is performed after the above step. The reference
image with the largest weight is selected for comparison, IV. EXPERIMENTAL SETUP
?
yge . The uncompressed live image is then rotated in 1◦ A. Image Registration on UTIAS Dataset
increments between -5◦ and 5◦ . All these rotated images are
autoencoded and stacked into an 1000 × 11 matrix, Yθ . The Image registration to obtain the longitude, latitude, and
kernel computation from (1) is repeated: heading was performed on the same dataset as in [8]. We do
not focus on estimating the roll, pitch, or altitude of the vehicle
wθ = YθT yge
?
. (5) as those can be measured by complementary sensors to vision.
These weights are normalized, w̄θ , and then used to compute The data was collected at UTIAS using a DJI Matrice 600
a heading measurement following the same procedure as in Pro multirotor UAV with a 3-axis DJI Ronin-MX gimbal (see
(3) using a stacked vector of the rotation values, xθ : Figure 6). A StereoLabs ZED camera provides stereo images
at 10FPS. The RTK-GPS system and IMU provide the vehicle
θ̂ = xTθ w̄θ . (6) pose for ground truth.
This dataset consists of six traversals of a 1132m path over
This mean heading value, θ̂, is then added to the heading of
built-up areas with roads and buildings as well as large areas
the selected reference image, β, to get a global heading, θ̂ +β.
of grass and trees. Each run captures the distinctive lighting
While not included here, a similar process could be used to
condition at different times of day: sunrise, morning, noon,
get an estimate for altitude without having to render additional
afternoon, evening, and sunset. These lighting conditions are
reference images. The full localization is then:
shown in Figure 2. The UAV flies at an altitude of 40m with a
x̂ constant heading and the camera pointed in the nadir direction.
p̂ = ŷ (7) There is an unknown offset between the RTK-GPS frame
θ̂ + β and the GE frame. So 10% of the successful image registra-
One of our earlier approaches for localization was to use the tions are used to align the frames. These registrations are then
position of the image with the highest similarity measurement. omitted from all error calculations.
This yielded fairly similar results to the weighted average
approach except that it was limited by the grid spacing of V. RESULTS
the reference images and more susceptible to outliers. Most vision-based localization methods rely on features.
Previously, Patel et al. [8] evaluated the ability of SURF
features to match between GE rendered images and live images
on the same path used here under various lighting conditions
using the VT&R framework in [5]. Using the GE images for
the teach pass and the live images for the repeat, features
were only capable of producing less than 7% successes per
repeat if a successful registration is defined as having greater
than 30 Maximum Likelihood Estimation Sample Consensus
(MLESAC) inliers. We are not currently aware of any works
localizing GE images to real UAV images at a similar altitude
and orientation as our flight path other than [8].
We are able to achieve comparable results with the MI-
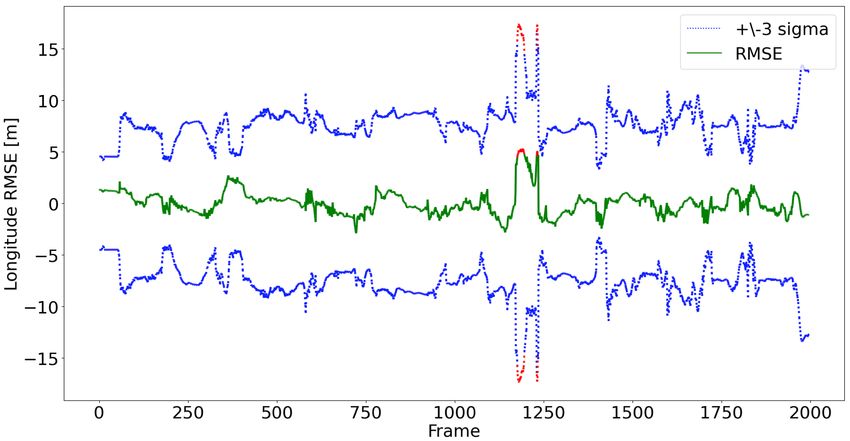
Fig. 5: Plots of the RMSE for the longitude coordinates of the based approach from [8] on the same dataset in 1% of the
sunrise test are shown here with accompanying 3σ uncertainty
envelope. The registrations that were rejected due to either
σlong or σlat > 5 are shown in red.
D. Outlier Rejection
Since we compute a covariance with our localization based
on the weights, we can also use this to reject outliers. When
the weights have a single narrow peak away from the edges of
2 2
the area covered by the reference images, the σlong and σlat
values are small. When the weights are more spread out with
a less-well-defined peak, when there are multiple peaks, or
when the peak occurs very close to the edge of the reference
2 2
area, this results in larger values for σlong and σlat . We reject
localizations that have either σlong or σlat greater than 5.
Fig. 6: The dataset was collected by a 3-axis gimballed stereo
Figure 5 plots the RMSE for the longitude coordinates with
camera on a multirotor UAV.6 IEEE ROBOTICS AND AUTOMATION LETTERS. PREPRINT VERSION. ACCEPTED FEBRUARY, 2021
TABLE I: Comparison of Errors for Successful Registrations
Registration Successful Registrations RMSE
Lighting
Success [%] longitude [m] latitude [m] heading [degree]
Condition
Ours A Ours B MI [8] Ours A Ours B MI [8] Ours A Ours B MI [8] Ours A Ours B MI [8]
Sunrise 98.8 99.9 94.7 1.05 1.17 1.10 0.97 0.97 0.71 0.35 0.35 2.28
Morning 100 100 95.1 0.90 0.90 1.02 0.95 0.95 0.58 0.31 0.31 2.57
Noon 100 100 97.8 1.04 1.04 0.78 0.87 0.87 0.61 0.36 0.36 1.82
Afternoon 98.0 98.6 96.0 1.64 1.67 1.69 0.88 0.87 0.92 0.34 0.34 1.17
Evening 90.9 96.0 81.3 2.16 2.17 3.03 1.18 1.14 1.32 0.42 0.41 2.49
Sunset 97.4 98.7 87.5 1.37 1.48 1.95 0.96 0.94 1.12 0.36 0.36 2.64
computation time. In Table II, we present our RMSE for the
longitude, latitude, and heading for all registrations on each
of the six runs. We achieve lower errors as compared to the
results presented in [8]. We use the same search area as in [8]
to select our subset of reference images, which correspond to
a maximum RMSE of 6.4m.
In Table I, the error results from only successful reg-
istrations are compared against the errors from successful
registrations in [8]. For "Ours A", we use the outlier rejection
scheme described in Section III-D to reject registrations with
a high covariance estimate. For "Ours B", we use the outlier
rejection from [8] along with our localization method. In [8],
registrations are deemed unsuccessful if the localization is too
far from the previous estimate. There is minimal difference in
the performance between "Ours A" and "Ours B". The benefit
of our outlier rejection scheme is that it is based purely on (a) Morning
the covariance of the localization result and does not require
a prior estimate.
In comparison with [8], for all but the noon lighting
condition we achieve lower RMSE error on the longitude
coordinate. For the latitude coordinate, we have lower RMSE
error for three of the runs and for the other three runs we are
an average of 0.3m higher. Our success rate of registrations
is higher for all the lighting conditions. Particularly in the
evening and sunset runs, we see an increase of ~10% in the
success rate and a decrease in RMSE.
The most significant advantage of our method over [8] is
the substantial reduction in runtime. Both methods were run
on a Lenovo P52 laptop with an Intel i7 8th generation core,
a Nvidia Quadro P2000 GPU, and 32 GB of RAM. Most
of the MI registrations took between 5 to 35 seconds per
frame, whereas our approach only took between 0.09 and 0.15
(b) Evening
seconds. We were able to eliminate the costly optimization
component from [8], which requires warping the image and Fig. 7: Registration results showing our best (morning) and
recomputing the MI up to 150 times per registration. Instead, worst (evening) localization results. Grey dots indicate the
by rendering more reference images at a finer grid spacing and reference image positions. Green dots indicate the ground truth
using the mean of the kernel weights to interpolate between live image positions. Blue dots indicate accepted localizations
them, we were able to achieve similar results at greatly reduced and red dots indicate rejected localizations. Shadows on the
opposite sides of objects as compared to the GE reference
TABLE II: Comparison of Errors for All Registrations images cause higher errors and more rejected registrations in
All Registrations RMSE
the evening run.
Lighting
longitude [m] latitude [m] yaw [degree]
Condition
Ours MI [8] Ours MI [8] Ours MI [8] computation time.
Sunrise 1.18 1.87 0.98 1.47 0.35 2.80
Both approaches are still limited by the storage available
Morning 0.90 2.24 0.95 1.39 0.31 2.97
Noon 1.04 1.26 0.87 1.02 0.36 2.70 on the UAV. By autoencoding the reference images, we only
Afternoon 1.84 2.14 0.90 1.57 0.35 2.63 need 1000 numbers to represent each image. Recording these
Evening 2.53 4.09 1.19 3.63 0.42 5.25 numbers as half precision floats only requires 4.2 kB per
Sunset 1.64 3.03 0.97 1.95 0.37 3.06 image. In [8], the reference images are stored as 560×315 4-bitBIANCHI et al.: UAV LOCALIZATION USING AUTOENCODED SATELLITE IMAGES 7
Fig. 8: An example frame from each of the three areas indicated in Figure 7 for the morning lighting condition is shown at
the top of this figure and for the evening lighting condition on the bottom. For each lighting condition, the top row shows the
overlay between the live image and the GE reference image closest to the localization. The heat maps plotted in the bottom
row show the value of the weights for each of the nearby GE reference images with yellow indicating a higher weight. The
resulting localization and covariance is shown in green for successful registrations and in red for rejected registrations. The
ground truth is shown in magenta.
greyscale images requiring approximately 11 kB of storage ization results, morning, in Figure 7a and on the run with
which is almost three times as large. As a result of this the worst localization results, evening, in Figure 7b. The
reduction, we are able to render more images per meter of the ground truth from the RTK is shown by the green dots.
path while still having a lower per meter storage cost, 0.241 Successful registrations are indicated by blue dots and rejected
Mb compared to 0.722 Mb. Encoding the images also makes registrations are indicated by red dots. The grey dots show the
the base comparison computation faster. An inner-product positions of the GE reference images. The localizations on
computation between two 1000 dim vectors takes on average the morning lighting condition likely perform the best because
0.26ms, whereas a MI computation between two 176,400 the shadow conditions match those on the GE images. In the
pixel images takes on average 109ms. The disadvantage of evening dataset, the shadows are on the opposite sides of the
our approach is that in addition to the autoencoded reference objects as compared to the GE images. Figure 2 shows an
images, we must also store the weights for the trained neural example image from each of the six lighting conditions for
networks in order to encode the live image on board. However, comparison.
this is a fixed cost that does not increase with the length of
the path. So for the 1.1km path in the dataset used, our total We show an example from three different areas along the
storage is still less than what is used in [8]. Computation and path for the morning and evening lighting conditions in Figure
storage comparisons are summarized in Table III. 8. The top row for each lighting condition shows an overlay
of the live image and the GE reference image closest to the
We plot our registrations on the run with our best local- localization. The bottom row shows a heat map of the value of8 IEEE ROBOTICS AND AUTOMATION LETTERS. PREPRINT VERSION. ACCEPTED FEBRUARY, 2021
TABLE III: Runtime and Storage Requirements Comparison [5] M. Warren, M. Greeff, B. Patel, J. Collier, A. P. Schoellig, and T. D.
Barfoot, “There’s no place like home: Visual teach and repeat for
Comparison Method Kernel (Ours) MI [8] emergency return of multirotor uavs during gps failure,” IEEE Robotics
and Automation Letters, vol. 4, no. 1, pp. 161–168, 2019.
Average Runtime
221 s 18422 s [6] P. Furgale and T. D. Barfoot, “Visual teach and repeat for long range
for 1.1 km Path
rover autonomy,” Journal of Field Robotics, vol. 27, no. 5, pp. 534–560,
Average Time per Frame 0.11 s 9.23 s 2010.
Average Time per [7] H. Bay, A. Ess, T. Tuytelaars, and L. V. Gool, “Speeded-up robust
0.26 ms 109 ms features (surf),” Computer Vision Image Understanding, vol. 110, no. 3,
Comparison Computation
pp. 346–359, 2008.
Storage Cost per Image 4.2 kB 11 kB [8] B. Patel, T. D. Barfoot, and A. P. Schoellig, “Visual localization with
Storage Cost per m of Path 0.241 Mb 0.722 Mb google earth images for robust global pose estimation of uavs,” in Proc.
of the IEEE Intl. Conference on Robotics and Automation, 2020.
Fixed Storage Cost 158 Mb 0 Mb [9] G. Conte and P. Doherty, “An integrated uav navigation system based
Total Cost for 1.1km Path 423 Mb 794 Mb on aerial image matching,” in IEEE Aerospace Conference Proceedings,
2008.
the weights of the nearby GE reference images computed from [10] A. Nassar, K. Amer, R. ElHakim, and E. M., “A deep cnn-based
framework for enhanced aerial imagery registration with applications
an inner-product with the live image. The resulting localization to uav geolocalization,” in The IEEE Conference on Computer Vision
from the mean of the thresholded weights and the covariance and Pattern Recognition (CVPR) Workshops, 2018.
estimate are plotted as well. For successful registrations, the [11] P. Agarwal and L. Spinello, “Metric localization using google street
view,” in Proc. of the IEEE/RSJ International Conference on Intelligent
covariance envelope is smaller. For the rejected localizations Robots and Systems (IROS), 2015, pp. 3111–3118.
(i.e., evening B and C), shadows cause the highest weights to [12] A. L. Majdik, Y. Albers-Schoenberg, and D. Scaramuzza, “Mav urban
occur on misaligned images at the very edge of the reference localization from google street view data,” in Proc. of the Intl. Confer-
ence on Intelligent Robots and Systems, 2013, pp. 3979–3986.
images. In these cases, the covariance that results from the [13] A. L. Majdik, D. Verda, Y. Albers-Schoenberg, and D. Scaramuzza,
weights is larger than in the successful registrations, very “Air-ground matching: Appearance-based gps-denied urban localization
elongated, and does not pass our threshold for outlier rejection. of micro aerial vehicles,” Journal of Field Robotics, 2015.
[14] D. G. Lowe, “Distinctive image features from scale-invariant keypoints,”
Intl. Journal of Computer Vision, vol. 60, no. 2, pp. 91–110, 2004.
VI. CONCLUSIONS AND FUTURE WORK [15] G. Pascoe, W. Maddern, and P. Newman, “Robust direct visual local-
isation using normalised information distance,” British Machine Vision
We presented a method for localizing live images captured Conference (BMVC), pp. 70.1–70.13, 2015.
from a UAV under six different lighting conditions to preren- [16] G. Pascoe, W. Maddern, A. D. Stewart, and P. Newman, “Farlap: Fast
robust localisation using appearance priors,” in Proc. of the IEEE Intl.
dered images from GE. Compared to the best existing method, Conference on Robotics and Automation, 2015, pp. 6366–6373.
we are able to achieve a similar level of accuracy at 1% of [17] D. P. Kingma and M. Welling, “Auto-encoding variational bayes,” in
the computation time. Our method also has a lower storage Proc. of the Intl. Conference on Learning Representations), 2014.
[18] X. Hou, L. Shen, K. Sun, and G. Qiu, “Deep feature consistent
requirement per length of path making it an ideal candidate for variational autoencoder,” in Applications of Computer Vision (WACV)
running on board the UAV in future work. All preprocessing IEEE Winter Conference, 2017, pp. 1133–1141.
can be completed offline and grants the UAV the ability to [19] K. Ridgeway, J. Snell, B. Roads, R. Zemel, and M. Mozer, “Learning
to generate images with perceptual similarity metrics,” in International
traverse new areas without having to manually fly and map Conference on Image Processing, 2015.
them first. Since our method is able to match images across [20] A. Makhzani, J. Shlens, N. Jaitly, and I. Goodfellow, “Adversarial
large periods of time (the GE images are at least two years autoencoders,” Intl. Conference on Learning Representations, 2015.
[21] X. Chen, D. P. Kingma, T. Salimans, Y. Duan, P. Dhariwal, J. Schulman,
older), it could also be used for repeated traversals of the same I. Sutskever, and P. Abbeel, “Adversarial autoencoders,” International
path over large periods of time. Future work aims at integrating Conference on Learning Representations, 2016.
our method into a filtering pipeline such that it can be used [22] K. Grauman and T. Darrell, “The pyramid match kernel: Discriminative
classification with sets of image features,” in Proc. of the IEEE Intl.
in the loop on board the UAV. Conference on Computer Vision, 2005, pp. 1458–1465.
[23] J. Zhang, M. Marszalek, S. Lazebnik, and C. Schomid, “Local features
ACKNOWLEDGMENT and kernels for classification of texture and object categories: A com-
prehensive study,” Intl. Journal of Computer Vision, vol. 73, no. 2, pp.
This work was funded by NSERC Canada Graduate 213–238, 2007.
[24] I. Melekhov, J. Kannala, and E. Rahtu, “Relative camera pose estimation
Scholarship-Master’s, Defence Research and Development using convolutional neural networks,” in International Conference on
Canada, Drone Delivery Canada, the Centre for Aerial Advanced Concepts for Intelligent Vision Systems, 2017, pp. 675–687.
Robotics Research and Education, University of Toronto, and [25] A. Kendall, M. Grimes, and R. Cipolla, “Posenet: A convolutional
network for real-time 6-dof camera relocalization,” in Proc. of the IEEE
the Vector Scholarship in Artificial Intelligence. Intl. Conference on Computer Vision, 2015, pp. 2938–2946.
[26] B. Tekin, S. N. Sinha, and P. Fua, “Real-time seamless single shot
R EFERENCES 6d object pose prediction,” in Proceedings of the IEEE Conference on
Computer Vision and Pattern Recognition, 2018, pp. 292–301.
[1] Google, Map Data: Google, Landsat/Copernicus. [27] M. Sundermeyer, Z. Marton, M. Durner, M. Brucker, and R. Triebel,
[2] M. Blöesch, S. Weiss, D. Scaramuzza, and R. Siegwart, “Vision based “Implicit 3d orientationlearning for 6d object detection from rgb im-
mav navigation in unknown and unstructured environments,” in Proc. of ages,” in Proc. of the European Conference on Computer Vision (EECV),
the Intl. Conference on Robotics and Automation, 2010, p. 21–28. 2018, pp. 699–715.
[3] S. Shen, N. Michael, and V. Kumar, “Tightly-coupled monocular visual- [28] H. Bai, “Variational autoencoder for face image generation in pytorch,”
inertial fusion for autonomous flight of rotorcraft mavs,” in Intl. Con- 2020, https://github.com/bhpfelix/Variational-Autoencoder-PyTorch.
ference on Robotics and Automation. IEEE, 2015, pp. 5303–5310.
[4] S. Weiss, M. W. Achtelik, S. Lynen, M. C. Achtelik, L. Kneip, M. Chli,
and R. Siegwart, “Monocular vision for long-term micro aerial vehicle
state estimation: A compendium,” Journal of Field Robotics, vol. 30,
no. 5, pp. 803–891, 2013.You can also read