UC Berkeley Recent Work - Core
←
→
Page content transcription
If your browser does not render page correctly, please read the page content below
UC Berkeley
Recent Work

Title
Micromobility evolution and expansion: Understanding how docked and dockless
bikesharing models complement and compete – A case study of San Francisco

Permalink
https://escholarship.org/uc/item/96g9c9nd

Journal
Journal of Transport Geography, 84

ISSN
09666923

Authors
Lazarus, Jessica
Pourquier, Jean Carpentier
Feng, Frank
et al.

Publication Date
2020-04-01

DOI
10.1016/j.jtrangeo.2019.102620

Peer reviewed

 eScholarship.org                               Powered by the California Digital Library
                                                                University of California
Micromobility evolution and expansion: Understanding how
 docked and dockless bikesharing models complement and
         compete – A case study of San Francisco

                    Journal of Transport Geography

                         Volume 84, April 2020

             https://doi.org/10.1016/j.jtrangeo.2019.102620

                     Jessica Lazarus, Jean Carpentier
                      Pourquier, Frank Feng, Henry
                        Hammel, SusanShaheen
ABSTRACT

Shared micromobility – the shared use of bicycles, scooters, or other low-speed modes – is an
innovative transportation strategy growing across the U.S. that includes various service models
such as docked, dockless, and e-bike service models. This paper focuses on understanding how
docked bikesharing and dockless e-bikesharing models complement and compete with respect to
user travel behaviors. To inform our analysis, we used two datasets for February 2018 of Ford
GoBike (docked) and JUMP (dockless e-bikesharing) trips in San Francisco. We employed three
methodological approaches: 1) travel behavior analysis, 2) discrete choice analysis with a
destination choice model, and 3) geospatial suitability analysis based on the Spatial Temporal
Economic Physiological Social (STEPS) transportation equity framework. We found that
dockless e-bikesharing trips were longer in distance and duration than docked trips. The average
JUMP trip was about a third longer in distance and about twice as long in duration than the
average GoBike trip. JUMP users were far less sensitive to estimated total elevation gain than
were GoBike users, making trips with total elevation gain about three times larger than those of
GoBike users, on average. The JUMP system achieved greater usage rates than GoBike, with .8
more daily trips per bike and 2.3 more miles traveled on each bike per day, on average. The
destination choice model results suggest that JUMP users travel to lower-density destinations,
and GoBike users were largely traveling to dense employment areas. Bike rack density was a
significant positive factor for JUMP users. The location of GoBike docking stations may attract
users and/or be well-placed to the destination preferences of users. The STEPS-based bikeability
analysis revealed opportunities for the expansion of both bikesharing systems in areas of the city
where high-job density and bike facility availability converge with older and lower-income
populations.

Keywords: Micromobility; Bikesharing; E-Bike; Dockless; Destination Choice; Transportation
           Equity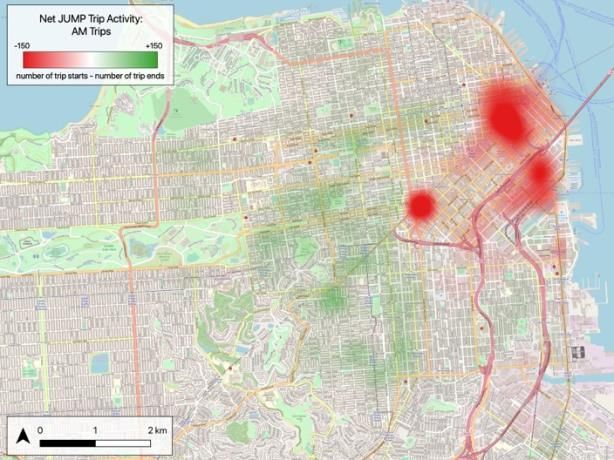
1. INTRODUCTION
Shared micromobility services are growing rapidly across the United States (U.S.) and abroad. In
2018, the number of shared micromobility trips in the U.S., including station-based and dockless
bikesharing and e-bikesharing and scootersharing, reached 84 million (NACTO, 2019). Of those
trips, 36 million were station-based (non-electric) bikesharing trips, about 500,000 were station-
based e-bikesharing trips, and about 6 million were dockless e-bikesharing trips. By enabling
users to access a fleet of publicly available shared personal transportation devices on an as-
needed basis, shared micromobility offers on-demand, low-emission public transportation
options that can help to reduce congestion and emissions, as well as improve public health within
urban areas (Parkes et al., 2013). Traditional station-based bikesharing systems have been
studied in depth, generating some agreement about their positive impact on cycling rates, modal
shifts from personal vehicle use, and promotion of public transit ridership through improved
first- and last-mile connections to public transit stations (Shaheen et al., 2010). These benefits
can contribute to various federal, state, and local objectives to improve mobility, safety, and
public health, and reduce congestion, fuel use, and emissions.
         Innovations to incumbent bikesharing technology and business models are spreading in a
new wave of fourth generation bikesharing and scooter sharing, which includes dockless models,
demand-responsive pricing and rebalancing, and electric fleets of bicycles, standing scooters, and
moped-style scooters. The increased geographic coverage and availability of these new service
models have great potential to further expand and integrate shared micromobility in the
transportation system, as such factors have been identified as significant drivers in traditional
bikesharing ridership (Martin and Shaheen, 2014; Peters and Mackenzie, 2019). Early analysis of
aggregated activity data from dockless and scooter-based models shows substantial expansion of
micromobility ridership in urban areas (NACTO, 2019), with an estimated market potential of 8
to 15 percent of all passenger trips under 5 miles (Heineke et al., 2019). However, concerns
about curb management, safety, and the sustainability of the micromobility vehicle supply have
become a central focus of the ongoing development of regional and local regulations and
permitting programs have (NACTO, 2019; Peters and Mackenzie, 2019; Shaheen and Cohen,
2019).
         This paper examines the expansion of bikesharing in the City of San Francisco. In
January 2018, the San Francisco Municipal Transportation Agency (SFMTA) issued a permit for
a pilot dockless electric bikesharing (e-bikesharing) system, called JUMP, which began to
operate in parallel to the existing regional station-based bikesharing system, Ford GoBike.
Around the same time, it was announced that the GoBike system would expand to include
electric bicycles as well, which became available in April 2018. The expansion of the docked
GoBike system complemented by the newer stationless JUMP bikes necessitates an evaluation of
the effectiveness of each system in providing additional mobility in San Francisco and
consideration of the spatial distribution of bicycle infrastructure, such as bicycle lanes and public
bike racks to support the potential increase in bicycle demand. As a city with a highly
concentrated central business district that is surrounded by steep hills with medium density
residential and mixed use areas, San Francisco offers an interesting case study for examining the
impacts of e-bike and dockless models on bikesharing travel behavior throughout the city.
         Our research seeks to understand the impact that the dockless, e-bikesharing model might
have on bikesharing users’ travel behavior as compared to traditional docked bikesharing. A
primary objective is to characterize the spatial distribution of demand for both dockless electric
and docked bikesharing throughout San Francisco. We created a destination choice model using
a month of activity data (February 2018) from both JUMP and GoBike to quantify the relative
bikesharing attractiveness at a neighborhood scale for users of each system. Our analysis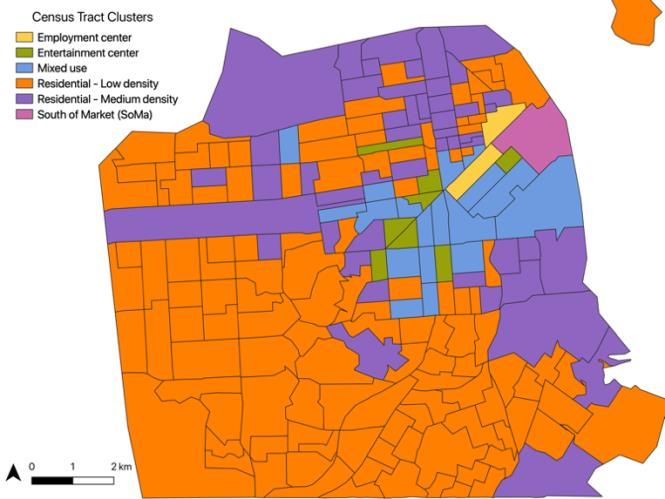
revealed the impact that dockless, e-bikesharing has on the sensitivity of bikesharing users’
destination choices to various exogenous factors such as: bicycle infrastructure, topography,
socio-demographics, and land-use variables.
        This article is organized into four sections. First, we provide background, including a
brief history of bikesharing in general and in San Francisco, as well as a discussion of the major
factors that impact bikesharing ridership, as revealed in existing literature. Next, we present an
overview of our methodology. Third, we present the results of travel behavior analysis,
destination choice modeling, and bikesharing suitability analyses. Finally, we highlight our
conclusions and future work.

2. BACKGROUND
Public bikesharing and scooter sharing systems are quickly becoming the most widely adopted
and rapidly growing shared miocromobility options across the U.S. (Parkes et al., 2013; Shaheen
and Cohen, 2019). By enabling users to access a fleet of publicly available shared personal
transportation devices on an as-needed basis, shared micromobility offers on-demand, low-
emission public transportation options that can help to reduce congestion and emissions, as well
as improve public health within urban areas (Parkes et al., 2013). As shared micromobility
continues to expand and evolve with emerging technology and business models, new insights
regarding the unique impacts of electric vehicles and dockless models on ridership and travel
behavior is needed to aid cities in understanding how to best manage local micromobility
ecosystems to promote a more sustainable and equitable transportation system.

2.1 Evolution of Public Bikesharing Systems
The first public bikesharing system emerged in 1965 in Amsterdam, Netherlands. This
innovation has expanded to reach cities across Europe, North America, South America, Asia, and
Australia (Parkes et al., 2013, Shaheen et al., 2012 (a)). At present, most bikesharing systems are
classified as third generation, characterized by the implementation of information technology
(IT) for bicycle pick-up, drop-off, and tracking (Shaheen et al., 2012 (b)). Bikesharing systems
are predominantly “station-based” or docked, where bicycles are located at public docking
stations and trips are required to originate and terminate (roundtrip and point-to-point trips).
Docks are typically concentrated in urban areas, creating a network of on-demand bicycles
suitable for a variety of trip purposes. Users can instantly unlock an available bicycle from a
docking station using a credit/debit card, membership card, key, and/or a smartphone application.
There are a variety of fare structures applied in bikesharing systems including: daily, monthly,
and annual passes. In most systems, fares tend to cover at least the first 30 minutes of a trip, with
overage charges beyond that time. Many systems also allow users to chain multiple trip segments
of 30 minutes or less, such that a user can extend their riding time by “ending” a trip segment at
a dock and immediately unlocking a bike for another trip segment.
         Fourth generation bikesharing builds upon the IT-enabled third generation to deliver
demand-responsive, multi-modal systems (Shaheen et al., 2012 (b)). The dockless, or free-
floating, bikesharing model is one such innovation, which allows users to pick-up and drop-off
bicycles anywhere within a service zone. Demand-responsive bicycle redistribution and value
pricing encourages users to participate in the rebalancing of bicycles, facilitating a
spatiotemporal distribution of bicycles that closely matches system supply and demand (Shaheen
et al., 2012 (b)). Bikesharing systems are also becoming more integrated with other
transportation modes through mobility as a service (MAAS) models, including: public transit;
carsharing (e.g., Zipcar, car2go); and ridesourcing/transportation network companies (e.g., Lyft,
Uber). Uber Technologies, Inc. acquired JUMP in April 2018 (Rzepecki, 2018). Interestingly,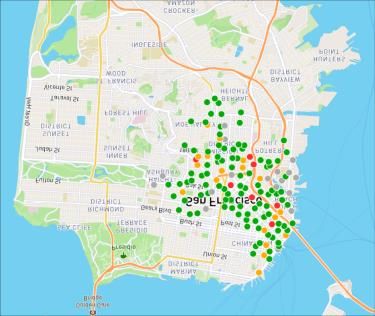
Lyft acquired Motivate, the parent company of GoBike in July 2018. This likely signals that
shared mobility companies are interested in becoming multi-modal MAAS platforms consisting
of more than one shared mode.
         In late-2017 and early-2018, bikesharing operators Social Bicycles (SoBi) (which is now
JUMP, owned by Uber), Motivate, and Lime, began operating bikesharing systems with electric
assist bicycles or e-bikes. E-bikes have an electric motor that reduces the effort required by the
rider, allowing for greater speeds and ease in riding uphill. Research on personally owned e-bike
use has found that the main reasons people choose to use e-bikes include living or working in
hilly areas, medical conditions, fitness, and the desire to ride with less effort (MacArthur, et al.,
2014). E-bikes can mitigate the inconvenience imposed by needing to shower after bicycling,
thus providing an attractive alternative to traditional bikes for commute trips. MacArthur et al.
(2014) found that 80% of sampled e-bike users under the age of 55 and 68% of those 55 and
older said that they did not need to shower after using e-bicycles. A report on shared
micromobility in 2018 found that, in cities where e-bikes were added to station-based
bikesharing fleets, e-bike utilization was about twice that of pedal bikes, on average (NACTO,
2019).

2.2 Bikesharing in San Francisco: Ford GoBike and JUMP
Ford GoBike launched in Summer 2017 as a re-branding and expansion of the Bay Area Bike
Share system, which launched in San Francisco and San Jose in 2013. GoBike provides access to
five cities, 540 stations, and 7,000 bikes (Ford GoBike, 2018). As with many docked bikesharing
systems, standard GoBike rides are 30 minutes long, with each additional 15 minutes costing
extra. GoBike offers single ride, day pass, and annual membership payment plans, with the
day/annual passes providing unlimited standard rides for the duration of their validity (Ford
GoBike, 2018 (a)). Users can locate and unlock a bicycle using a mobile app, Clipper Card, or by
paying on-site using a kiosk. Around the same time as the JUMP pilot launch, in April 2018,
GoBike added 250 electric pedal-assist bicycles to its San Francisco fleet followed by an
additional 600 in December 2018 (Ford GoBike, 2018 (b)). However, we note that at the time of
the study period, the GoBike fleet comprised solely of standard pedal bicycles. Figure 1 below
shows the service areas of GoBike and JUMP during the study period.
         JUMP Bikes, a program of Social Bicycles, launched in January 2018 after the SFMTA
issued the city’s first permit to operate a dockless bikesharing service. As an 18-month pilot
program under evaluation by SFMTA, JUMP is committed to providing a “safe, equitable, and
accountable” dockless e-bikesharing system (SFMTA, 2018). For the duration of the pilot,
SFMTA will not issue any other dockless bikesharing permits and aims to develop policy
recommendations based on the pilot’s results. The initial pilot allowed for 250 bikes until
October, 2018 when an additional 250 bikes were added to the fleet. With integrated onboard U-
locks, JUMP bikes are parked at regular bike racks or locked to a fixed object in the sidewalk
“furniture zone,” the portion of sidewalk from the curb to the pedestrian walk zone (JUMP
Bikes, 2018, NACTO, 2016). Users can locate and unlock the bikes using a smartphone
application, password, or radio-frequency identification (RFID) member card (SFMTA, 2018).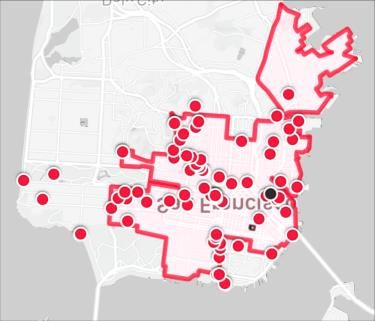
FIGURE 1. Ford GoBike Bike (top) and JUMP (bottom) Service Areas in San Francisco
 Note: Both maps are screenshots from the GoBike and JUMP user applications. The GoBike
 map shows station locations colored by the availability of bikes and the JUMP map shows the
           JUMP service area, with dots indicating the location of available bikes.

2.3 Factors Influencing Bikesharing Ridership and Travel Behavior
While the literature on ridership and travel behavior of dockless and electric shared
micromobility is limited, there has been extensive research on the use of station-based
bikesharing models. The literature reveals three major external factors that impact bikesharing
ridership: 1) infrastructure (e.g., bike lanes, bike racks), 2) geography (e.g., land use,
topography), and 3) user demographics (e.g., age, income). Internal factors (e.g., supply
rebalancing, vehicle type, pricing) are also important drivers of bikesharing ridership. Much of
the literature on internal factors has focused on a-priori and optimization analyses of station
location, dock allocation, fleet sizing, and rebalancing algorithms (Garcia-Palomares et al., 2012;
Shu et al., 2010). We thus focus our attention on empirical findings from the literature on the
impacts of external factors on bikesharing ridership and travel behavior.

2.3.1 Infrastructure
Infrastructure indicators for bikesharing ridership relate to the availability and attractiveness of
bicycle facilities, such as bike lanes, bike paths, and bike boulevards. Buehler and Pucher (2012)
show that bike commute ridership correlates positively with the supply of bike paths and lanes,
even when controlling for other contributing factors (Buehler and Pucher, 2012). A destination
choice analysis of the Divvy docked bikesharing system in Chicago found that bikesharing users
preferred destinations with a greater density of bicycle facilities in the surrounding area, and
bikesharing members (subscribers) were more sensitive to this factor than non-members (Faghih-
Imani and Eluru, 2015). Finally, a multiple regression analysis of the Capital Bikeshare system
in Washington, D.C., found that the total length of bike lanes within .5 miles of a station was a
significant positive factor in the number of rides per day at the station (Buck and Buehler, 2012).
The quality of the bike infrastructure can also impact the sensitivity of demand for
bikesharing. Indeed, route choice modeling of Grid Bikeshare users in Phoenix, Arizona found
that bike-specific facilities increase the preference for a particular route by an amount equivalent
to decreasing the travel distance by 44.9% (Khatri et al., 2016). In Portland, Oregon, route choice
modeling revealed that bicyclists prefer bike boulevards and bike paths, which are typically on
streets with little and no vehicle traffic, respectively, to bike lanes, which are facilities that share
the road with regular traffic (Broach et al., 2011).
2.3.2 Geography
The next critical question is where to supply infrastructure per demand. Although station
proximity to bike infrastructure is a top design priority (NACTO, 2016; Buck and Buehler,
2012), it is important to note⎯that due to geographical constraints⎯not all origin-destination
pairs are equally attractive. Job density, proximity to public transit services, and proximity to
recreational areas at the location of a bikesharing station have been found to be positive factors
in bikesharing demand (Wang and Akar, 2019; Wang et al., 2015).
For example, in the Nice Ride program in Minneapolis-St. Paul, stations farther away from
central business districts (CBDs) of the twin cities as well as those farther away from parks
generated fewer bikesharing trips (Schoner, 2012). For e-Bikes, an elevation change between
origin and destination locations is also a positive demand factor. A study of Bicing bikesharing
user activity in Barcelona found that the average difference in elevation between origin and
destination stations for e-bikesharing trips was +6.21 meters, compared to -3.11 meters for
conventional bikesharing trips (Moose, 2016).
2.3.3 User Demographics
Although bikesharing offers the opportunity to expand cycling mode share, the evidence from
traditional bikesharing ridership suggests that bikesharing users are not socio-demographically
representative of the broader population in areas they operate. Existing studies of station-based
bikesharing in North America have shown that bikesharing use is strongly correlated with certain
user characteristics such as: gender, age, and race. Station-based bikesharing users tend to be
younger and upper-to-middle income, with higher levels of educataional attainment than the
general population (Shaheen et al., 2014; Shaheen et al., 2012). Station citing has been found to
reflect the socio-demographic inbalances in bikesharing ridership, with one study of 42 U.S.
bikesharing system reporting that the 60 percent of census tracts with greatest economic hardship
contained less than 25 percent of bikesharing stations (Smith et al., 2015). Moreover, bikesharing
station activity increases in locations with higher percentages of white residents and decreases in
relation to older populations (Wang et al., 2015; Schoner et al., 2012).
A growing emphasis on transportation equity, particularly with respect to emerging
mobiliy services, has motivated many agencies to incorporate equity-focused provisions in their
shared micromobility programs (Shaheen and Cohen, 2019). Common approaches to promote
equity across station-based bikesharing systems have included offering discounted annual
memberships to low income riders, citing stations based on equity reasons, providing payment
plan options and assistance in obtaining bank accounts, credit, and/or debit cards in order to
lower access barriers to bikesharing (Buck, 2012). Many cities have required that shared
micromobility operators provide such options as a condition for obtaining an operating permit.
However, additional barriers to shared micromobility use remain unaddressed. Shaheen et
al. (2017) introduced the STEPS to Transportation Equity framework to evaluate transportation
equity by recognizing the opportunities and limitations of Spatial, Temporal, Economic,Physiological, and Social elements (Shaheen et al., 2017). The STEPS framework can be used to
evaluate whether a shared mobility system provides equitable transportation services by
identifying specific barriers and opportunities within each category. In particular, spatial factors
such as steep terrain and low population density may constrain bikesharing use in certain cities
with these characteristics. Temporal factors, which pertain to travel time considerations of travel,
may be an issue in cities where shared micromobility demand is unbalanced during peak hours,
generating concerns about the reliability of available vehicles. Economic factors include both
direct costs (e.g., usage costs and membership fees) and indirect costs (e.g., smartphone, internet,
and credit card access) that may create hardship for particular groups of travelers. Physiological
factors may have posed a serious limitation to bikesharing use that is reflected in the age
distribution of riders, though there may be an opportunity to expand shared micromobility use
for older and less physically active individuals through electric bikesharing and scootersharing.
Finally, social factors encompass social, cultural, safety, and language barriers that may inhibit
an individual’s use of a particular service.
3. METHODOLOGY
Our study consists of three major analytical components: 1) a comparative analysis of
bikesharing travel behavior, 2) a discrete choice analysis (DCA) using a destination choice
model, and 3) a geospatial suitability analysis based on the STEPS framework using the DCA
coefficients.
To inform our analysis, we employed two datasets from February 2018 of Ford GoBike
and JUMP, composed of 77,841 docked, conventional pedal bikesharing trips and 24,270
dockless e-bikesharing trips that occurred in San Francisco. We note that February 2018 in San
Francisco was slightly warmer than average and relatively dry, with 10 mm of precipitation
compared to an average of 112 mm (Weather Underground, 2018). The high temperature and
low precipitation may have resulted in greater observed ridership than would be expected during
this time of year (Rixey, 2013). The trip-level data include trip duration and start and end times.
The origin and destination (OD) of a trip are docking stations for GoBike and census blocks in
which the trip started and ended for JUMP. The age and membership status (annual membership
subscribers versus single ride or day pass users) of GoBike users are also included for each trip.
The datasets do not include further information regarding user identification, user characteristics,
or the trajectories taken for each trip.
Our analysis is thus constrained to the revealed preferences of unidentified, unlinked
bikesharing users. Rather than perform a traditional discrete choice model in which individuals’
preferences for specific alternatives among a finite set of choices are modeled, we implemented a
destination choice model (Ben-Akiva and Lerman, 1985). We modeled the decision to travel to a
particular destination given that a trip originating in a particular location is made using a
particular bikesharing service.
We supplemented the trip-level data with: tract-level population, job count, employment
rate, age, income, and gender distributions from the U.S. Census (ACS, 2016; LEHD, 2013).
From OpenStreetMap, we used the locations of bike lanes and public bike racks to determine the
density of these facilities in each census tract in San Francisco (SM, 2018). Finally, we queried
the Google Directions and Elevations Application Programming Interfaces (APIs) for estimates
of travel distance, duration, and elevation gain along suggested bike routes for each bikesharing
trip (Google, 2018). Queries to the Google Directions API used the latitude and longitude of
specified trip OD pairs to generate a suggested route that provide a path, estimated travel time,
and distance for each query. These paths were then used to query the Google Elevations API for
elevation samples at 100 meter intervals, which were used to estimate the total elevation gain ofeach trip. All unique OD pairs in the activity dataset were used in this querying process, as well
as OD pairs for all alternative trips used in the DCA. Alternative GoBike trips included all
possible OD pairs starting and ending at a GoBike station in San Francisco, while alternative
JUMP trips were generated as the set of all actual origins of JUMP trips paired with the centroid
of every census tract in San Francisco.
We applied the results of the destination choice model and the STEPS framework in a
suitability analysis, which is a geographic information system (GIS)-based method for
determining the ability of a system to meet a user’s needs (McHarg, 1969). In our analysis, we
examined the geospatial distribution of bikesharing suitability in San Francisco. In the following
sections, we detail the steps taken to process data, specify a destination choice model, and apply
the model and the STEPS framework in a suitability analysis.
3.1 Data Aggregation
In this study, observed bikesharing trip destinations are modeled as choices among a discrete set
of alternative destinations. Although techniques exist to estimate continuous models (Ben-Akiva
and Watanatada, 1981), neither the GoBike nor JUMP datasets entail location data on a
continuous scale. The GoBike OD locations are constrained to the discrete locations where
GoBike stations exist, while the JUMP OD locations are classified by the census block in which
the trip started or ended for the purpose of privacy protection. With such discrete spatial data, we
took the approach of aggregating trip OD pairs to the census tract level for two reasons to: 1)
avoid high correlation between very close OD pairs and 2) simplify the model analysis.
Aggregating the data by census tracts also allows for the inclusion of additional attributes to the
model such as: demographics, employment rate, job density, and population density, all of which
can be measured at the census tract level.
3.2 Census Tract Clustering by K-Means
With aggregation of the data to the census tract level, we note a major limitation in the
computability of a model with as many alternatives as there are census tracts in the coverage
areas of the two SF bikesharing systems. Forty-six census tracts are serviced by the Ford GoBike
system, and 192 census tracts are serviced by JUMP. Discrete choice models generally include
Alternative Specific Constants (ASCs) that aim to capture the biases toward each alternative that
is not explicitly explained by the other model attributes. To avoid overfitting and aid in the
interpretability of our model, we reduced the number of ASCs by clustering the census tracts
based on their attributes. We included just one ASC in the model for each of the k clusters,
making reasonable assumptions that clustered alternatives have similar unexplained bias.
Several techniques can be applied to solve this unsupervised clustering problem. We
considered three commonly used techniques for clustering: 1) DBSCAN, 2) Gaussian Mixture
Models (GMM), and 3) k-means (Shewchuck, 2012). We decided to work with k-means as it
offers two desirable properties: 1) clusters tend to have similar sizes, and 2) clusters are grouped
around a centroid. The last property suited our objective of having an average ASC for the entire
cluster.
K-means is a distance-based algorithm that requires preprocessing of the data to avoid
biases due to differences in scale. First, we apply standard normal scaling on every census-level
attribute available in our data sets. As our final objective is to determine the relative likelihood of
trips destined for a location, we performed a Cross Correlation Analysis between the attributes of
a tract and the number of trips that end in the tract. This process produces a projection of the set
of attributes so that the clustering analysis favors attributes with a strong correlation to ridership(Ben-Akiva and Lerman, 1985). Figure 2 presents the resulting clusters with an intuitive
interpretation of each, based on our a-priori understanding of the neighborhoods they represent.
FIGURE 2. K-Means Clustering of Census Tracts
3.3 Destination Choice Modeling
To compare the factors influencing user travel behavior across the two bikesharing systems, we
designed a single destination choice model specification to apply to the GoBike and JUMP trip
data separately, producing two models with unique coefficients for the same set of attributes. We
used a Multinomial Logit (MNL) model that is based on the utility associated with each possible
choice (Ben-Akiva and Lerman, 1985). We define:
● The choicemaker as an individual making a trip using either GoBike or JUMP.
Choicemaker characteristics may include trip origin, time of day, and day of week.
● Alternatives are all of the possible destination census tracts of a choicemaker using a
particular system (i.e, all census tracts with a GoBike station for GoBike users and all census
tracts in the study area for JUMP users). Alternative attributes may include land use, socio-
demographics, and density of bicycle facilities in the census tract.
● The trip attributes, such as trip duration, trip distance, and elevation are the result of both
choicemaker characteristics (related to the origin) and alternative attributes (related to the
destination).
We did not interact the coefficients of the model because of the high number of
choicemaker characteristics and alternative attributes. It follows that all coefficients in the model
were alternative generic except the ASCs. We did not explicitly account for the spatial
correlation between tracts, which would require a nested logit model (Ben-Akiva and Watanada,
1981). Instead, we made the assumption that the cluster ASCs were independent.
The model we formulated was focused on the characteristics of the destination choices
and limited the influence of the origin and routing to basic trip characteristics: trip distance and
elevation gain. We did not include trip duration in the DCA, as it was found to be highly
correlated with trip distance and elevation gain. We made these simplifications in favor of
attempting to estimate other choicemaker or trip characteristics (e.g., user characteristics, exact
routing attributes), which would introduce additional error in the model.3.4 Generation of Trip Alternatives
The nature of our dataset required that we simulate the choice situation experienced by riders. To
do so, we used the Google Directions and Google Elevations APIs to estimate trip attributes, and
we used census data for all attributes related to the destination tract. Any information sourced
from the Google APIs are hereby referred to as “estimated.” For a given trip observed in the
activity data, we considered the destination of that trip as the chosen alternative of that
choicemaker, and we generated the attributes of alternatives by considering all of the other tracts
to which they could have traveled. We use these estimates rather than the “real” values recorded
in the activity data to maintain consistency between the attributes of actual and hypothetical
trips. The steps taken to estimate distance and elevation gain are as follows:
● For GoBike trips, we first queried the Google APIs for travel distance and elevation
samples (every 100 m) along the suggested routes between each pair of bike stations. Then, for
each trip origin station and destination tract pair, we computed the average estimated distance
and elevation gain from that origin station to each station in the destination tract.
● For JUMP trips, we queried the Google APIs for travel distance and elevation samples
(every 100 m) from the centroid of the origin census tract to the centroid of a destination tract for
every OD tract pair.
For both systems, we computed elevation gain by summing all increases in elevation
observed in the 100 meter intervals sampled. A complete list of attributes included in the final
model are found in Table 1.
This model excludes some parameters that were found to be insignificant to the
destination choices of bikesharing users. Among them, unemployment measures such as the
unemployment ratio or employment to population ratio were not significant when accounting for
the log number of jobs. We chose not to include trip cost and membership considerations, as they
differed considerably across the GoBike and JUMP systems. GoBike members pay annual
membership fees, resulting in variable per-trip costs for each member depending on the
frequency with which they use the service. We also did not have information on which of the
short-term pass options were used by nonmembers. Though start time has a tremendous impact
on destination choice, this choicemaker attribute can only be incorporated in the model by
interacting it with other relevant features. We chose not to add this refinement for model
simplicity. Finally, the distribution of race or ethnicity at trip destinations were found to be
highly correlated with economic attributes of destinations thus were not included in the final
model.
For the JUMP system, we considered every tract in San Francisco County as an
alternative, while for GoBike we constrained the choice set to the tracts that contain at least a
GoBike station to account for trip feasibility given the service area at the time the data were
collected. The sample sizes for each model amounted to 70,779 trips, with 45 alternatives for
GoBike and 24,034 trips with 192 alternatives for JUMP.
TABLE 1: Parameters of Proposed Model
Parameter System Min. Max. Mean Std. Description
Estimated distance GoBike 0.2 5.6 2.1 1.0 Estimated distance and elevation gain
(miles) GoBike: Estimated from the origin station
JUMP 0 15 3.9 2.1
to all stations in the alternative tract
GoBike 0 113 28 20Estimated total elevation JUMP 0 428 85 54 JUMP: Estimated from the origin block
gain (meters) centroid to the alternative tract centroid
Log of the number of GoBike 5.9 11.7 8.2 1.4 Represents the relative amount of total
jobs travel activity to and from residences and
JUMP 3.6 11.7 7.0 1.3
employment in the area
Log of the population GoBike 7.5 9.5 8.3 0.4
JUMP 4.5 9.5 8.3 0.6
Availability of the GoBike 3.1 42.3 16.1 8.9
GoBike: Density of stations in the
bikesharing system alternative tract
JUMP 0 80 10.4 14.9
(bikes/ miles2) JUMP: Average density of available bikes
in the alternative tract
JUMP service area JUMP 0 1 n/a Indicates whether the alternative is in the
indicator JUMP service area (JUMP only)
Bike lane density GoBike 0 19.6 7.4 4.9 Total bike lane length in the alternative is
(miles/ miles2) divided by the tract area; represents
JUMP 0 19.6 5.9 4.6
bikeability of the alternative
Bike rack density GoBike 0 289 37 65 Total number of public bike racks in the
(racks/ miles2) alternative divided by the tract area;
JUMP 0 1013 23 91
represents ease of parking JUMP bikes
Density of resident GoBike 4k 151k 35k 24k Represents density of the housing in the
population alternative
JUMP 53 151k 31k 22k
(people/ miles2)
Median income ($) GoBike 12k 200k 90k 47k Median income of resident population
JUMP 0 200k 91k 39k
Fraction of pop. aged 0 GoBike 0 0.4 0.2 0.1 Age fraction in the population to capture
to 25 some activity characteristics, such as
JUMP 0 0.8 0.2 0.1
family-oriented neighborhoods; 35 to 55
Fraction of pop. aged 25 GoBike 0.1 0.4 0.3 0.1 age range is the base case
to 35
JUMP 0.05 0.5 0.2 0.1
Fraction of population GoBike 0.1 0.6 0.2 0.1
aged 55 and more
JUMP 0.05 0.6 0.3 0.1
Entertainment centers GoBike 0 1 n/a ASC aggregated to the cluster level;
residential low density cluster is the base
JUMP
level
Employment centers GoBike 0 1 n/a
JUMP
Mixed use GoBike 0 1 n/a
JUMP
South of Market (SoMa) GoBike 0 1 n/a
JUMP
Residential- low density GoBike 0 1 n/a
JUMP3.5 Model Estimation Using the Bootstrap Method
Including all trips and alternatives, our datasets exceeded our computational power to fit the
models using the PyLogit Python package. We employed an ensemble method that combines
several “weak learners” to divide the workload. In this case, a weak learner is a MNL model
trained on a sample of choice experiments. For the GoBike model, each weak learner was trained
on 500 choice experiments using all 45 alternatives. However, for JUMP considering all
alternatives would result in keeping too few choice experiments. So, we chose to have an
approach similar to those employed in stated preference surveys by restricting the number of
alternatives for each choice experiment. To fit the JUMP model, we randomly sampled 110
alternatives to use for each weak learner with 500 choice experiments.
Cross-validation and the bootstrap are two commonly used methods for partitioning
model estimation (Gareth et al., 2013). We chose to use the bootstrap as it measures the variance
in the parameters, indicating which parameters are not relevant in the model and can be removed.
On the other hand, cross validation is more focused on assessing predictive power (Gareth et al.,
2013). Since we are more concerned with narrowing attributes to those that are most influential
in destination choice rather than producing a model that predicts exactly where a bikesharing
user will travel to, we considered the bootstrap a more appropriate method for this analysis.
Estimating identical models separately on the two datasets required that we keep
attributes that happened to be significant for one system but not for the other. In addition to
choosing attributes based on significance, we considered the importance of attributes for policy
implications. For this reason, we kept the densities of bike lanes and bike racks even though they
were not statistically significant in the final model.
3.6 STEPS Transportation Equity: “Bikeability” Analysis
As part of our analysis, we applied the STEPS transportation equity framework to both
bikesharing systems in this study (See Figure 3).Figure 3: STEPS Transportation Equity Bikeability Analysis Process
A member survey of five bikesharing systems in five different cities from 2011 to 2013
(Shaheen et al., 2012 (b)) showed that bikesharing users tend to be wealthier, more educated,
younger, Caucasian, and male compared to the general population. Bearing in mind these
baseline bikesharing demographics, we applied the STEPS transportation equity framework to
evaluate bikesharing’s attractiveness or “bikeability” at different destinations of the city through
the Spatial, Temporal, Economic, Physiological, and Social elements of STEPS (Shaheen et al.,
2017). Our bikeability analysis is adapted from the map-based suitability analysis first
introduced by Ian McHarg, one of the eminent theoreticians in environmental planning (McHarg,
1969). McHarg's method involves superimposing layers of geographical data so their spatial
intersection or relationships can be used in making land-use decisions.
TABLE 2: Bikeability Factor and Corresponding STEPS Components
Bikeability Factor Opportunit STEPS Criteria GIS
y/ Components Feature
Constraint
Bike lane density Opportunity Spatial Line
GoBike station Opportunity Spatial/Temporal Range set above or below Point
density spatial distribution of the
Bike rack density Opportunity Spatial feature Point
High elevation Constraint Spatial Polygon
Log of jobs Opportunity Economic Range set above or below Polygon
Low median income Constraint Economic respective median census Polygon
High population Constraint Economic tract metric Polygon
density
Population > 55 Constraint Physiological Polygon
years Range set above or below
respective median of the
census tract metric
3.7 STUDY LIMITATIONS
The major limitations of this study stem from the nature of the bikesharaing activity data that is
used. The time period observed (February 2018) is the first full month of JUMP operations in
San Francisco, which is likely to include travel behavior of early adopters and novelty rides that
do not reflect more regular patterns that may have emerged among JUMP users since its launch.
In addition, by comparing JUMP and GoBike trips during this time period, we observe the
interdependent effects of both the dockless model and the electric pedal-assist bicycles on JUMP
travel behavior compared to that of GoBike, which used non-electric bicycles with a station-
based model during the study period. While differences in travel behavior related to elevation
may be more directly linked to the e-bikes in the JUMP system, most other trip attributes
examined may be influenced by a number of variants in the operation and/or ridership across the
two bikesharing systems. The lack of user data linked to the trips we observe constrains ourability to account for socio-demographic differences across the riders of the two systems. We use
census data to differentiate bikesharing trip destinations by the socio-demographic makeup of the
surrounding census tracts, though we cannot directly draw conclusions about the socio-
demographic characteristics of riders, nor of the actual points of interest visited during each trip.
In addition, we used suggested bike routes from the Google Directions API to estimate
trip distances, durations, and elevation gain in the absence of trajectory data. However, we chose
not to incorporate bike path availability along these suggested routes in the DCA model due to a
concern that the results would overestimate the use of bike routes. Lastly, there is a degree of
endogeneity in our DCA results for GoBike, as the destination choices of GoBike users are
completely constrained to the station locations of the GoBike system.
4. RESULTS
In this section, we discuss the results of travel behavior analysis, destination choice DCA, and
STEPS transportation bikeability analysis.
4.1 Travel Behavior
We begin with a visual analysis of the geographical and temporal distribution of demand for
each bikesharing system. Figures 4.a – d. display heat maps of bikesharing activity during
February 2018 by time of day. Areas in which the departures constitute the majority of activity
are shaded green, while areas in which arrivals constitute the majority of activity are shaded red.
Thirty-two percent of JUMP trips, 33% of GoBike non-member trips, and 43% of GoBike
member trips took place during the AM period (12:00 AM to 11:59 AM). Both JUMP and
GoBike exhibit concentrated AM demand destined for dense employment centers along Market
Street and in the South of Market (SoMa) and Financial District (FiDi) areas just South-East and
North-West of Market Street, respectively. These neighborhoods are home to many large office
buildings housing numerous corporate headquarters and branch offices. The intensity of trip
arrivals around the Civic Center could represent multi-modal trips, as bikesharing users may
choose to transfer to the Bay Area Rapid Transit (BART) line at this most North-Western access
point. There is a clear difference in the trip origins of JUMP and GoBike in the AM period,
where we see a concentration of GoBike trips departing from the CalTrain and Embarcadero
BART stations, while JUMP trip departures were spread out in neighborhoods outside of the
CBD. In the PM period (12:00 PM to 11:59 PM), we observed both systems servicing riders
originating in the CBD, but the destinations of JUMP trips were again spread out in
neighborhoods farther away from the CBD, while GoBike trip destinations were concentrated at
the Caltrain and Embarcadero BART stations.4.a. Net JUMP AM Activity 4.b. Net JUMP PM Activity
4.c. Net GoBike AM Activity 4.d. Net GoBike PM Activity
Figure 4: AM and PM Demand Distribution Heat Maps for JUMP and GoBike Trip
Activity.
Note: Green indicates a net departure of trips and red indicates net arrival. Complete
transparency indicates overall balance between trip arrivals and departures.
The distribution of bikesharing trip distance and duration for each of the two systems
exemplifies the behavior observed in the visual analysis. We assess the trip characteristics of
GoBike members and non-members separately, noting that 95% of GoBike trips were made by
members. JUMP trips tended to be longer in distance and duration than GoBike trips (Figure 5,
6). The average JUMP trip was about a third longer in distance and about twice as long in
duration as the average GoBike member trip. The distribution of JUMP trip durations seemed to
align with GoBike non-members. While this may be a result of the newness of JUMP in
February 2018, the similarity implies that JUMP tended to be used for longer, potentially more
recreational trips, which are more similar to GoBike non-member trips. Indeed, 7% and 8% of
JUMP and GoBike non-member trips, respectively, are longer than one hour in duration,
compared to less than a third of a percent of GoBike member trips. Unlike GoBike members who
pay on an annual basis and are incentivized to make the most out of their membership regardless
of trip length, JUMP users pay per trip and thus may prefer to make longer, less frequent trips.FIGURE 5: Distribution of Bikesharing Trip Duration
FIGURE 6: Distribution of Bikesharing Trip Distance
FIGURE 7: Distribution of Estimated Bikesharing Trip Total Elevation Gain
Figure 7 displays the distribution of the estimated total elevation gain for bikesharing
trips by GoBike members and non-members and JUMP users. The average JUMP trip gains
three times as much elevation in contrast to the average GoBike member trip. In addition, JUMPtrips have a larger range of estimated total elevation gain per trip, with over one third of JUMP
trips climbing 30 meters or more compared to just 6% of GoBike trips with the same estimated
elevation increase. The distributions of trip length and estimated elevation gain suggest that e-
bikes may indeed be enabling users to overcome barriers of distance and elevation.
FIGURE 8: Bike Use: Average Daily Trips per Bike
FIGURE 9: Bike Use: Average Daily Miles Ridden per Bike
Figures 8 and 9 display the average daily bike usage rates of JUMP and GoBike in terms
of average trips taken per bike per day and average miles traveled per bike per day, respectively.
The JUMP system achieved greater usage rates than GoBike during February 2018, with .8 more
daily trips per bike and 2.3 more miles traveled on each bike per day, on average. We note that
there were 1,558 unique bikes identified in the GoBike San Francisco trip data, while there were
just 375 JUMP bike IDs. Since JUMP was only issued permits for 250 bikes, we presume that
some bikes were switched in or out of service during February 2018.
4.2 Destination Choice Model
Next, we present the results of the destination choice model estimation to better understand the
influence of different factors on bikesharing users’ destination choices in the GoBike and JUMP
systems (see Table 3). The final log-likelihood values for the destination choice models for
GoBike and JUMP trips were -1,402 and -1,713, respectively. The R squared values for themodels were 0.26 for GoBike and 0.27 for JUMP, while the R bar squared values for each were
0.23 and 0.24, respectively.
Across both systems, increase in estimated trip distance and elevation gain were both
strong negative factors in bikesharing users’ destination choices. The estimated total elevation
gain was by far the most negative coefficient in the GoBike model, indicating that destinations
that involved climbing in elevation were very unpreferable to GoBike users. The coefficient for
estimated distance in the JUMP model was more negative than that of estimated total elevation
gain. The range of estimated trip distances for the destination choice set was inherently larger for
JUMP than for GoBike, since JUMP users were not entirely restricted by the service area of the
system. Seven percent of JUMP trips in our dataset were completed outside of the service area.
JUMP users were fined for ending a trip outside of the service area, but they were not prohibited
from doing so. The large positive coefficient for the JUMP service area indicator reflected this
incentive.
Factors indicating the level of activity at a destination (log of the population and log of
the number of jobs) were significant and positive across models. In addition, the density of the
resident population and the ASC for low-density residential census tracts were both significant,
negative coefficients in the JUMP model, suggesting an affinity of JUMP users to travel to
lower-density destinations. Conversely, the model results support our findings from visual spatial
analysis that GoBike users were largely bikesharing to work, as the activity level parameters
were the two most positive coefficients, and the employment center ASC was positive and
significant.
The age and income characteristics of destinations were mostly insignificant in the
model. JUMP destination choices were significantly negatively influenced by the fraction of
residents over the age of 55 in a destination census tract. The median income of destinations is
not a significant factor in the destination choice models for either system, with coefficient
estimates close to zero in both models.
While bike rack density is unsurprisingly an insignificant factor in the GoBike model, it
is a significant positive factor in the destination choices of JUMP users. Since JUMP users were
instructed to lock the bikes to public racks, this finding has two possible implications for the
destination choices of dockless bikesharing users: 1) JUMP users may prefer destinations with a
higher availability of public bike racks with which to easily end their trips, and/or 2) the spatial
distribution of public bike racks is well suited to the preferred destinations of dockless
bikesharing users. On a related note, the density of GoBike stations in a destination tract was a
significant positive factor in the GoBike model. Again, the location of docking stations may
attract users, and/or they are well-placed to serve the destination preferences of GoBike users.
The insignificance of bike lane density in both destination choice models may be an
artifact of our choice to model this factor as an alternative attribute rather than a trip attribute.
Bike lane density along suggested destination routes or even the cumulative bike lane density
across each of the census tracts along the destination route may provide a more explanatory
variable with which to assess the bikesharing user sensitivity to bike lane availability.
TABLE 3: Parameter Estimates for Destination Choices of GoBike and JUMP Users
GoBike JUMP
Parameter Estimate p-value Estimate p-value
Estimated distance (miles) -0.75Estimated total elevation gain (meters) -1.77
FIGURE 10: Suitability Analysis Map Layers
Note: Each map layer represents a factor in the DCA model. All opportunity factors are labeled
in green (left), and all constraint factors are labeled in red (right).
FIGURE 11: STEPS Transportation Equity “Bikeability” Composite Maps

        The composite suitability maps reveal the geospatial distribution of the “bikeability” for
users of JUMP and GoBike in San Francisco. In particular, residential neighborhoods in the
Northwest and along the Northeast of the city provide opportunity for expansion for both
systems to improve equity based on physiological and economic factors. The distribution of the
population over 55 and elevation in these neighborhoods appear to be the main constraints in
these areas, while considerable job density and available bike facilities provide opportunities.
Though e-bikesharing has potential to overcome physiological barriers for older residents in
these areas, considerable social barriers may exist since JUMP is only accessible through a
smartphone application. Additional social constraints, which are not visualized in the bikability
maps, may stem from language barriers or broader cultural differences across the city. Finally,
introduction of temporal variables would aid in assessing the opportunities and challenges for
equitable bikesharing based on the time of day. Bikeability may vary across time periods with
different levels of congestion, or across hours of daylight versus darkness.
5. CONCLUSION
Shared micromobility service models are growing across the U.S. including: docked, dockless,
and e-bikesharing models. Our research analyzes the tripmaking behavior of JUMP dockless e-
bikesharing and GoBike docked bikesharing users in the first month of the JUMP pilot program.
Travel behavior and destination choice analyses reveal that the two systems appear to
complement one another: GoBike trips tended to be short, flat commute trips, mostly connecting
to/from major public transit transfer stations while JUMP trips were longer, more spatially
distributed and more heavily servicing lower-density neighborhoods. The average JUMP trip was
about a third longer in distance and about twice as long in duration than the average GoBike trip.
In addition, JUMP trips underwent about three times the elevation gain per trip, on average,
compared to GoBike trips.
Our findings suggest that the assistance provided by e-bikes in addition to the flexibility
afforded by the dockless model are serving mobility demand outside the dense urban core of the
city, where docked models are not available. Furthermore, we found that the destination choices
of docked bikesharing users are positively influenced by the density of stations, and bike rack
density was a significant positive factor for JUMP users. The location of facilities necessary to
use either the docked or dockless system may attract users and/or be well-placed to the
destination preferences of users. While the sensitivity of destination choices to factors
influencing equity, such as older age are slight, our bikeability analysis reveals that the
composite effect of constraints and opportunities that impact bikesharing demand can have
adverse effects in neighborhoods otherwise ripe for bikesharing expansion.
Additional research is needed to more closely link the characteristics of shared
micromobility users with differences in travel behavior across business models and service areas.
This study focuses on San Francisco, a city with unique topographic, sociodemographic, and
cultural features which have distinct effects on travel behavior that may not be generalizable to
other locations. As policies and guidelines for shared micromobility are being piloted and
refined, similar data sources to those used in this study complemented with user surveys can be
used to monitor the emerging trends in ridership across multiple shared modes. Research into the
multimodal tripmaking and trip chaining using shared micromobility is needed to further the
understanding of the potential positive impacts of electric and dockless models on overall
mobility and accessibility across trip purposes. Finally, time series analysis of travel behavior
before, during, and after the implementation of innovative policies would provide invaluable
insights to help hone public interventions strategies that effectively bolster mobility while
promoting sustainability and equity within the broader transportation system.REFERENCES American Community Survey (ACS), 2016. United States Census Bureau, 2016. Available online at. https://www.census.gov/programs-surveys/acs/. Ben-Akiva, M., Lerman, S.R., 1985. Discrete Choice Analysis: Theory and Application to Travel Demand. MIT Press. Ben-Akiva, M., Watanatada, T., 1981. Application of a continuous spatial choice logit model. In: Maski, C.F., McFadden, D. (Eds.), Structural Analysis of Discrete Data with Econometric Applications. MIT Press Cambridge, Mass, pp. 320–343 Chapter 8. Broach, J., Gliebe, J.P., Dill, J., 2011. Bicycle Route Choice Model Developed from Revealed- Preference GPS Data. Transportation Research Board Annual Meeting, Washington D.C. Buck, D., Buehler, R., 2012. Bike lanes and other determinants of capital Bikeshare trips. In: Presented at the 91st Annual Meeting of the Transportation Research Board, Washington, D.C.. Buehler, R., Pucher, J., 2012. Cycling to Work in 90 Large American Cities: New Evidence on the Role of Bike Paths and Lanes. Transportation, 2012. March 1, 2012 39 (2), 409–432. https://doi.org/10.1007/s11116-011-9355-8. Faghih-Imani, A., Eluru, N., 2015. Analysing bicycle-sharing system user destination choice preferences: Chicago’s divvy system. J. Transp.Geography 44 (2015), 53–64. ISSN 0966- 6923. https://doi.org/10.1016/j.jtrangeo.2015.03.005. Ford GoBike, 2018a. Ford GoBike. In: Ford GoBike. Motivate International Inc. https:// www.fordgobike.com/pricing (Accessed March 21, 2019). Ford GoBike, 2018b. Meet the ebike. In: Ford GoBike. Motivate International Inc April 24, 2018. https://www.fordgobike.com/blog/meet-the-ebike (Accessed June 11, 2018). Garcia-Palomares Carlos, J., Gutierrez, J., Latorre, M., 2012. Optimizing the location of stations in bike-sharing programs: A GIS approach. Applied Geography 35, 235–246. https://doi.org/10.1016/j.apgeog.2012.07.002. Gareth, J., Hastie, T., Witten, D., 2013. And R. Tibshirani, 2013. An Introduction to Statistical Learning. Vol. 112. Springer, New York. Google, 2018. Web Service APIs. https://developers.google.com/maps/ Accessed July, 2018. Heineke, K., Kloss, B., Scurtu, D., Weig, F., 2019. Micromobility’s 15,000-mile checkup. McKinsey and Company. https://www.mckinsey.com/industries/automotive-andassembly/our- insights/micromobilitys-15000-mile-checkup. JUMP Bikes, 2018. JUMP Basics. In: JUMP. Social Bicycles, Inc. https://help.jumpbikes. com/hc/en-us (Accessed March 7, 2018). Khatri, R., Cherry, C.R., Nambisan, S.S., Han, L.D., 2016. Modeling Route Choice of Utilitarian Bikeshare Users with GPS Data. J. Transp. Res. Board 2587, 141–149. https://doi.org/10.3141/2587-17. 2016. Longitudinal Employer-Household Dynamics (LEHD), 2013. United States Census Bureau. 2013. https://lehd.ces.census.gov/. MacArthur, J., Dill, J., Person, M., 2014. E-bikes in North America: results of an online survey. J. Transp. Res. Board 2014 (2468), 123–130. Martin, E., Shaheen, S., 2014. Evaluating Public Transit Modal Shift Dynamics in Response to Bikesharing: A Tale of Two Cities. Journal of Transportation Geography 41, 315–324. https://doi.org/10.1016/j.jtrangeo.2014.06.026. McHarg, I.L., 1969. Design with Nature. Doubleday/Natural History Press, pp. 1969.
You can also read