Understanding the user interface - Active IQ Unified Manager NetApp May 24, 2022
←
→
Page content transcription
If your browser does not render page correctly, please read the page content below
Understanding the user interface
Active IQ Unified Manager
NetApp
May 24, 2022

This PDF was generated from https://docs.netapp.com/us-en/active-iq-unified-manager/storage-
mgmt/concept_typical_window_layouts_um_6_x.html on May 24, 2022. Always check docs.netapp.com
for the latest.
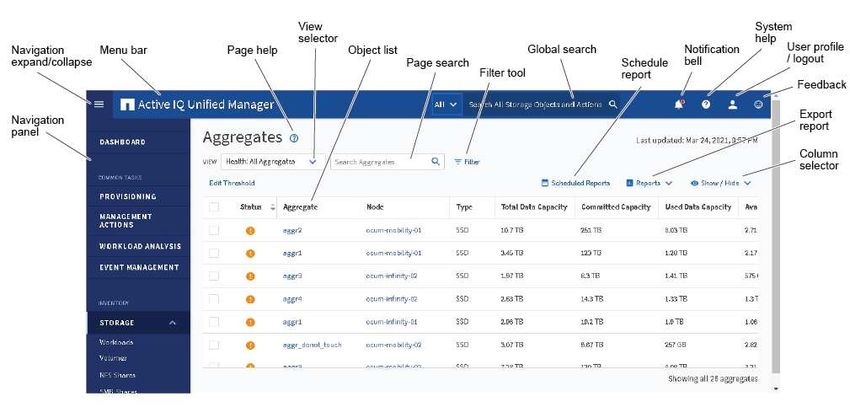
Table of Contents
Understanding the user interface . . . . . . . . . . . . . . . . . . . . . . . . . . . . . . . . . . . . . . . . . . . . . . . . . . . . . . . . . . . . .      1
  Typical window layouts. . . . . . . . . . . . . . . . . . . . . . . . . . . . . . . . . . . . . . . . . . . . . . . . . . . . . . . . . . . . . . . . . . .   1
  Window layout customization. . . . . . . . . . . . . . . . . . . . . . . . . . . . . . . . . . . . . . . . . . . . . . . . . . . . . . . . . . . . . .        2
  Using the Unified Manager Help . . . . . . . . . . . . . . . . . . . . . . . . . . . . . . . . . . . . . . . . . . . . . . . . . . . . . . . . . . .          3
  Bookmarking your favorite Help topics. . . . . . . . . . . . . . . . . . . . . . . . . . . . . . . . . . . . . . . . . . . . . . . . . . . . . . .            3
  Searching for storage objects . . . . . . . . . . . . . . . . . . . . . . . . . . . . . . . . . . . . . . . . . . . . . . . . . . . . . . . . . . . . .       3
  Exporting storage data as reports . . . . . . . . . . . . . . . . . . . . . . . . . . . . . . . . . . . . . . . . . . . . . . . . . . . . . . . . . .         5
  Filtering inventory page content . . . . . . . . . . . . . . . . . . . . . . . . . . . . . . . . . . . . . . . . . . . . . . . . . . . . . . . . . . . .      6
  Viewing active events from the notification bell . . . . . . . . . . . . . . . . . . . . . . . . . . . . . . . . . . . . . . . . . . . . . . . .              7
Understanding the user interface
The Unified Manager user interface mainly consists of a dashboard that provides an at-a-
glance view of the objects that are monitored. The user interface also provides access to
viewing all the cluster objects.
You can select a preferred view and use the action buttons as necessary. Your screen configuration is saved in
a workspace so that all of the functionality you require is available when you start Unified Manager. However,
when you navigate from one view to another, and then navigate back, the view might not be the same.
Typical window layouts
Understanding the typical window layouts helps you to navigate and use Active IQ Unified
Manager effectively. Most Unified Manager windows are similar to one of two general
layouts: object list or details. The recommended display setting is at least 1280 by 1024
pixels.
Not every window contains every element in the following diagrams.
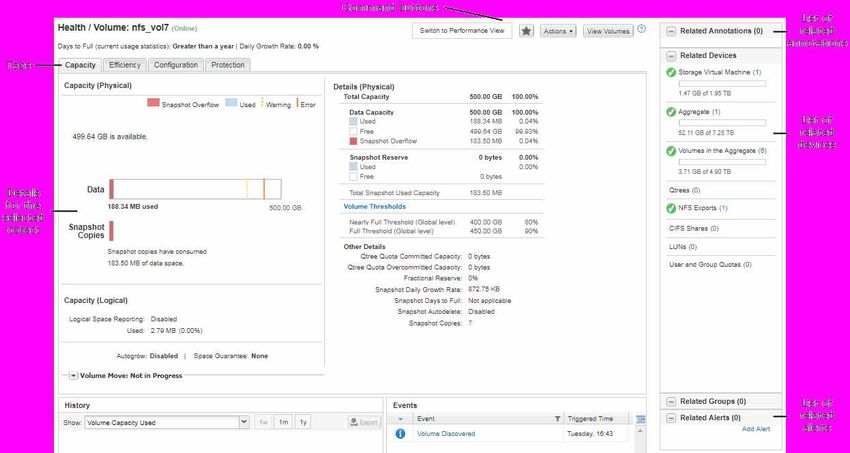
Object list window layout
Object details window layout
1Window layout customization
Active IQ Unified Manager enables you to customize the layout of information on the
storage and network object pages. By customizing the windows, you can control which
data is viewable and how the data is displayed.
• Sorting
You can click the column header to change the sort order of the column entries. When you click the column
header, the sort arrows ( and ) appear for that column.
• Filtering
You can click the filter icon ( ) to apply filters to customize the display of information on the storage and
network object pages so that only those entries that match the conditions that are provided are displayed.
You apply filters from the Filters pane.
The Filters pane enables you to filter most of the columns based on the options that are selected. For
example, on the Health: All Volumes view, you can use the Filters pane to display all of the volumes that
are offline by selecting the appropriate filter option under State.
Capacity-related columns in any list always display capacity data in appropriate units rounded off to two
decimal points. This also applies when filtering capacity columns. For example, if you use the filter in the
Total Data Capacity column in the Health: All Aggregates view to filter data greater than 20.45 GB, the
actual capacity of 20.454 GB is displayed as 20.45 GB. Similarly, if you filter data less than 20.45 GB, the
actual capacity of 20.449 GB is displayed as 20.45 GB.
If you use the filter in the Available Data % column in the Health: All Aggregates view to filter data greater
than 20.45%, the actual capacity of 20.454% is displayed as 20.45%. Similarly, if you filter data less than
20.45%, the actual capacity of 20.449% is displayed as 20.45%.
2• Hiding or showing the columns
You can click the column display icon (Show/Hide) to select which columns you want to display. Once you
have selected the appropriate columns you can re-order them by dragging them using your mouse.
• Searching
You can use the search box to search for certain object attributes to help refine the list of items in the
inventory page. For example, you can enter "cloud" to refine the list of volumes in the volumes inventory
page to see all volumes that have the word "cloud" in them.
• Exporting data
You can click the Reports button (or Export button to export data to a comma-separated values (.csv)
file, (.pdf) document, or Microsoft Excel (.xlsx) file and use the exported data to build reports.
Using the Unified Manager Help
The Help includes information about all features included in Active IQ Unified Manager.
You can use the table of contents, the index, or the search tool to find information about
the features and how to use them.
Help is available from each tab and from the menu bar of the Unified Manager user interface.
The search tool in the Help does not work for partial words.
• To learn about specific fields or parameters, click .
• To view all the Help contents, click > Help/Documentation in the menu bar.
You can find more detailed information by expanding any portion of the Table of Contents in the navigation
pane.
• To search the Help contents, click the Search tab in the navigation pane, type the word or series of words
you want to find, and click Go!
• To print Help topics, click the printer icon.
Bookmarking your favorite Help topics
In the Help Favorites tab, you can bookmark Help topics that you use frequently. Help
bookmarks provide fast access to your favorite topics.
Steps
1. Navigate to the Help topic that you want to add as a favorite.
2. Click Favorites, and then click Add.
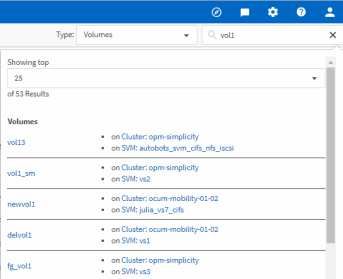
Searching for storage objects
To quickly access a specific object, you can use the Search all Storage Objects field at
the top of the menu bar. This method of global search across all objects enables you to
3quickly locate specific objects by type. Search results are sorted by storage object type
and you can filter them further by object using the drop-down menu.
What you’ll need
• You must have one of the following roles to perform this task: Operator, Application Administrator, or
Storage Administrator.
• A valid search must contain at least three characters.
When using the drop-down menu value "All", the global search displays the total number of results found in all
object categories; with a maximum of 25 search results for each object category. You can select a specific
object type from the drop-down menu to refine the search within a specific object type. In this case the returned
list is not restricted to the top 25 objects.
The object types you can search for include:
• Clusters
• Nodes
• Storage VMs
• Aggregates
• Volumes
• Qtrees
• SMB Shares
• NFS Shares
• User or Group Quotas
• LUNs
• NVMe Namespaces
• Initiator Groups
• Initiators
• Consistency Group
Entering a workload name returns the list of workloads under the appropriate Volumes or LUNs category.
You can click any object in the search results to navigate to the Health details page for that object. If there is no
direct health page for an object, then the Health page of the parent object is displayed. For example, when
searching for a specific LUN, the SVM details page on which the LUN resides is displayed.
Ports and LIFs are not searchable in the global search bar.
Steps
1. Select an object type from the menu to refine the search results for only a single object type.
2. Type a minimum of three characters of the object name in the Search all Storage Objects field.
In this example, the drop-down box has the Volumes object type selected. Typing "vol1" into the Search all
Storage Objects field displays a list of all volumes whose names contain these characters.
4Exporting storage data as reports
You can export storage data in a variety of output formats and then use the exported data
to build reports. For example, if there are 10 critical events that have not been resolved,
you can export the data from the Event Management inventory page to create a report,
and then send the report to admins who can resolve the issues.
You can export data to a .csv file, .xlsx file, or .pdf document from the Storage and Network inventory
pages and use the exported data to build reports. There are other locations in the product where only .csv or
.pdf files can be generated.
Steps
1. Perform one of the following actions:
If you want to export… Do this…
Storage object inventory details Click Storage or Network from the left-navigation
menu, and then select a storage object. Choose
one of the system-provided views, or any custom
view that you have created.
QoS Policy Group details Click Storage > QoS Policy Groups from the left-
navigation menu.
Storage capacity and protection history details Click Storage > Aggregates or Storage >
Volumes, then select a single aggregate or volume.
Event details Click Event Management from the left-navigation
menu.
5If you want to export… Do this…
Storage object top 10 performance details Click Storage > Clusters > Performance:All
Clusters, then select a cluster and choose the Top
Performers tab. Then select a storage object and
performance counter.
2. Click the Reports button (or Export button in some UI pages).
3. Click Download CSV, Download PDF, or Download Excel to confirm the export request.
From the Top Performers tab you can choose to download a report of the statistics for the single cluster
you are viewing or for all clusters in the data center.
The file is downloaded.
4. Open the file in the appropriate application.
Related information
Health/Clusters inventory page
Scheduling a report
Filtering inventory page content
You can filter inventory page data in Unified Manager to quickly locate data based on
specific criteria. You can use filtering to narrow the contents of the Unified Manager
pages to show only the results in which you are interested. This provides a very efficient
method of displaying only the data in which you are interested.
Use Filtering to customize the grid view based on your preferences. Available filter options are based on the
object type being viewed in the grid. If filters are currently applied, the number of applied filters displays at the
right of the Filter button.
Three types of filter parameters are supported.
Parameter Validation
String (text) The operators are contains, starts with, ends with,
and does not contain.
Number The operators are greater than, less than, in the
last, and between.
Enum (text) The operators are is and is not.
The Column, Operator, and Value fields are required for each filter; the available filters reflect the filterable
columns on the current page. The maximum number of filters you can apply is four. Filtered results are based
on combined filter parameters. Filtered results apply to all pages in your filtered search, not just the page
currently displayed.
6You can add filters using the Filtering panel.
1. At the top of the page, click the Filter button. The Filtering panel displays.
2. Click the left drop-down list and select an object; for example, Cluster, or a performance counter.
3. Click the center drop-down list, and select the operator you want to use.
4. In the last list, select or enter a value to complete the filter for that object.
5. To add another filter, click +Add Filter. An additional filter field displays. Complete this filter using the
process described in the preceding steps. Note that upon adding your fourth filter, the +Add Filter button
no longer displays.
6. Click Apply Filter. The filter options are applied to the grid and the number of filters is displayed to the right
of the Filter button.
7. Use the Filtering panel to remove individual filters by clicking the trash icon at the right of the filter to be
removed.
8. To remove all filters, click Reset at the bottom of the filtering panel.
Filtering example
The illustration shows the Filtering panel with three filters. The +Add Filter button displays when you have
fewer than the maximum of four filters.
After clicking Apply Filter, the Filtering panel closes, applies your filters, and shows the number of filters
applied ( ).
Viewing active events from the notification bell
The notification bell ( ) in the menu bar provides a fast way to view the most important
active events that Unified Manager is tracking.
The list of active events provides a way to see the total number of critical, error, warning, and upgrade events
on all clusters. This list includes events from the previous 7 days, and it does not include Information events.
You can click a link to display the list of events that you are most interested in.
Note that when a cluster is not reachable, Unified Manager displays this information in this page. You can view
detailed information about a cluster that is unreachable by clicking the Details button. This action opens the
Event details page. Scale monitoring issues, such as low space or RAM on the management station, are also
displayed on this page.
Steps
71. From the menu bar, click . 2. To view details for any of the active events, click the event text link, such as "2 Capacity" or "4 Performance". 8
Copyright Information

Copyright © 2022 NetApp, Inc. All rights reserved. Printed in the U.S. No part of this document covered by
copyright may be reproduced in any form or by any means-graphic, electronic, or mechanical, including
photocopying, recording, taping, or storage in an electronic retrieval system- without prior written permission of
the copyright owner.

Software derived from copyrighted NetApp material is subject to the following license and disclaimer:

THIS SOFTWARE IS PROVIDED BY NETAPP “AS IS” AND WITHOUT ANY EXPRESS OR IMPLIED
WARRANTIES, INCLUDING, BUT NOT LIMITED TO, THE IMPLIED WARRANTIES OF MERCHANTABILITY
AND FITNESS FOR A PARTICULAR PURPOSE, WHICH ARE HEREBY DISCLAIMED. IN NO EVENT SHALL
NETAPP BE LIABLE FOR ANY DIRECT, INDIRECT, INCIDENTAL, SPECIAL, EXEMPLARY, OR
CONSEQUENTIAL DAMAGES (INCLUDING, BUT NOT LIMITED TO, PROCUREMENT OF SUBSTITUTE
GOODS OR SERVICES; LOSS OF USE, DATA, OR PROFITS; OR BUSINESS INTERRUPTION) HOWEVER
CAUSED AND ON ANY THEORY OF LIABILITY, WHETHER IN CONTRACT, STRICT LIABILITY, OR TORT
(INCLUDING NEGLIGENCE OR OTHERWISE) ARISING IN ANY WAY OUT OF THE USE OF THIS
SOFTWARE, EVEN IF ADVISED OF THE POSSIBILITY OF SUCH DAMAGE.

NetApp reserves the right to change any products described herein at any time, and without notice. NetApp
assumes no responsibility or liability arising from the use of products described herein, except as expressly
agreed to in writing by NetApp. The use or purchase of this product does not convey a license under any
patent rights, trademark rights, or any other intellectual property rights of NetApp.

The product described in this manual may be protected by one or more U.S. patents, foreign patents, or
pending applications.

RESTRICTED RIGHTS LEGEND: Use, duplication, or disclosure by the government is subject to restrictions
as set forth in subparagraph (c)(1)(ii) of the Rights in Technical Data and Computer Software clause at DFARS
252.277-7103 (October 1988) and FAR 52-227-19 (June 1987).

Trademark Information

NETAPP, the NETAPP logo, and the marks listed at http://www.netapp.com/TM are trademarks of NetApp, Inc.
Other company and product names may be trademarks of their respective owners.

                                                                                                                 9
You can also read