Uniquely ASEAN Renewable Energy - Weighing Climate Matters
←
→
Page content transcription
If your browser does not render page correctly, please read the page content below
Uniquely
Regional Thematic | August 2022             MARKET DATELINE
                                     PP19489/04/2022 (035080)

    ASEAN Renewable Energy
               Weighing Climate Matters
Regional Thematic
2 August 2022 Utilities | Renewable Energy
ASEAN Renewable Energy
Weighing Climate Matters
In this report, we focus on ASEAN’s renewable energy (RE)
development amidst elevated cost pressure and the potential of rising
Analysts
carbon pricing initiatives. As near-term priorities are on curbing inflation
without jeopardising economic growth, more effort is needed to achieve Sean Lim
climate change targets. Featured ideas: Tenaga Nasional (TNB), Yinson +603 9280 8867
(YNS), Solarvest (SOLAR) and Samaiden (Malaysia), Sembcorp Industries sean.lim@rhbgroup.com
(SCI) (Singapore), as well as Global Power Synergy (GPSC) (Thailand) for
their growing RE exposure and potential battery energy storage system
(BESS) application opportunities. Shekhar Jaiswal
Not ruling out fossil fuel yet. While developed countries move away from +65 6320 0806
fossil fuel dependence to RE, ASEAN leaders acknowledged that ASEAN shekhar.jaiswal@rhbgroup.com
will still need to consider fossil fuel in the short to medium term to meet its
fast growing electricity demand. Moreover, fossil fuel remains abundant in
this region. Unabated fossil fuel accounted for three-quarters of total Indonesia Research
generation, of which coal contributed to >40% of the region’s energy related +6221 5093 9888
emissions. Even with pledges not to have new coal plants, the region still rhb.id.research@rhbgroup.com
has c.90GW of existing coal plants with an average operating lifetime of 10
years coupled with another 18GW under construction. Athipu Visavaveja
Greater effort needed. The Russia-Ukraine crisis has increased the +66 2088 9827
urgency even in developed countries, to ramp up RE capacity and athipu.vi@rhbgroup.com
safeguard energy security from fossil fuel supply disruptions. Closer to us,
eight South-East Asian countries have announced carbon neutrality and net
zero emissions targets. Still, we have yet to see ASEAN governments
translating these targets into detailed policies for future implementations.
We believe ASEAN countries will not achieve their respective targets unless Table of contents
greater effort is put in place to accelerate the progress. According to the
ASEAN Renewable Energy 2
International Energy Agency (IEA), average energy investment pa in South- ASEAN Power Grid 5
East Asia has to be hiked up to USD190bn pa till 2030 from the 2016-2020 High Fuel Cost and Inflation Impact 11
average of USD70bn pa to meet current announced climate aspirations. Carbon Pricing 15
Another global record for RE addition in 2022. Global annual RE Indonesia 21
capacity addition is estimated by IEA to increase by 8% to 320GW in 2022 - Indonesia’s Renewable Energy Roadmap
and to remain stable in 2023. This is largely driven by the continuous growth - Abundant Coal Reserves Remain a National Focus
in China and acceleration of RE expansion in Europe despite the - Solar Power – The Most Feasible Alternative
continuation of supply chain disruption and construction delay as well as - Policies Supporting Renewables Transition
Malaysia 33
escalated raw material cost. The recent retracement of commodity prices in
- Malaysia’s Renewable Energy Roadmap
response to the weaker economic outlook could provide a breather to
- LSS Progress Remains Slow
overall project costing.
- Exploring Carbon Pricing
Elevated fuel subsidies challenge climate change goals. Elevated fuel - Featured Ideas
prices have led to higher subsidies, casting additional fiscal burden to Singapore 41
ASEAN countries. With the key priorities being keeping inflation at bay, we - Planning For a Low Carbon Future
are seeing a delay in fossil fuel subsidy reform to protect the economies - Progress On Adoption Of Renewable Energy
and the cascading effect is a relatively lower allocation of economic - Singapore’s Carbon Market & Pricing
resources to lower emission industry. - Featured Ideas
Rising carbon pricing initiatives. Singapore is the first to implement Thailand 56
- Thailand’s Renewable Energy Roadmap
carbon tax back in 2019 and to progressively increase over the years. We
- Initiatives Supporting Renewable Energy
are seeing more carbon pricing initiatives (either carbon tax or emission
- Thailand’s Electricity Supply Structure
trading) being scheduled for implementation or under considerations within - Major Renewable Energy Sources in Thailand
the ASEAN region. Indonesia, Malaysia, and Thailand have announced - Recent Developments
plans to implement carbon emissions trading. However, the timeline for - Featured Ideas
these implementations may be pushed back due to the uncertain economic
outlook amidst high inflationary environment, as evident by the Indonesian
Government’s recent postponement of carbon tax implementation.
% Upside P/E (x) P/B (x) ROAE (%) Yield (%)
Company Name Rating Target
(Downside) Dec-23F Dec-23F Dec-23F Dec-23F
Global Power Synergy Buy THB84.00 21.3 22.4 1.7 6.3 2.3
Solarvest Neutral MYR0.77 8.2 17.3 2.2 13.7 -
Tenaga Nasional Neutral MYR8.60 1.1 9.5 0.8 8.5 6.1
Yinson Buy MYR2.83 33.5 5.2 0.8 15.4 0.9
Source: Company data, RHB
P/E (x) P/B (x) ROAE (%) Yield (%)
See important disclosures at the end of this report Dec-23F
22.4 Dec-23F
1.7 Dec-23F
0.1 Dec-23F
0.0
1
Market Dateline / PP 19489/05/2019 (035080)
17.3 2.2 0.1 0.0
ASEAN Renewable Energy                                                                                 Regional Thematic
2 August 2022                                                                                      Utilities | Renewable Energy

ASEAN Renewable Energy
Not ruling out fossil fuel to cope with rising demand
Global electricity demand has recovered by 6% YoY in 2021 following a similar drop in 2020.
This is stronger than the earlier projection of 5%, in which the industrial sector contributed
the most, followed by the commercial, services and residential sectors. Global electricity
demand growth for 2022 is now at 3%, in line with the average 10-year growth rate pre-
pandemic. Demand growth will moderate to 2.6% and 2% in 2023 and 2024. Closer to us,
South-East Asia remains one of the fastest growing regions in the world in terms of electricity
demand. IEA projects this region’s electricity demand to grow close to 5% in the next three
years, relatively lower than the average in terms of electricity demand, at a CAGR of 6% in
the past 20 years.

 Figure 1: Global change in electricity demand, 2015-2024

 Source: IEA Electricity Market Report January 2022

While the developed countries move away from fossil fuel dependence to RE, ASEAN
leaders acknowledge that ASEAN will still need to consider fossil fuel in the short to medium
term to meet its fast growing electricity demand. Moreover, fossil fuel remains abundant in
this region and is the most cost-effective method. Some of the challenges faced by ASEAN
countries in increasing RE in the power mix is the high cost of upgrading and integrating the
systems that need more investment in grids, Internet of Things (IoT), technological know-
how, and quality energy infrastructure.
Rather than completely ruling out fossil fuel, ASEAN countries should instead explore ways
to utilise fossil fuel in an environmentally sustainable manner to act as a bridge to a carbon-
free energy future. Unabated fossil fuels accounted for three-quarters of total generation, of
which coal contributed to over 40% of the region’s energy-related emissions. The region
has a large and relatively young fleet of coal- and gas-fired power plants. Even with pledges
not to have new coal plants, the region still has c.90GW of existing coal plants with an
average operating lifetime of 10 years, coupled with another 18GW under construction.
Therefore, apart from early retirement, retrofitting and re-purposing the plant is another
option to be explored as it provides certain flexibility while maintaining electricity security.

RE capacity is set to break another global record in 2022
According to IEA, annual RE capacity additions increased by 6% to c.295GW in 2021,
largely led by the strong deployment in China, which accounted for 46% of global RE
capacity addition. This is despite the continuation of supply chain disruption and
construction delay as well as escalated raw material cost amidst higher commodity prices.
High raw material and freight costs have reversed the long term decreasing trend for solar
modules and wind turbines in 2021. We continue to see overall capex increasing by 15-25%
YoY in 2022. For ASEAN, the annual installation fell 40% YoY in 2021, no thanks to the
phase out of the generous feed-in tariff (FIT) scheme in Vietnam, which resulted in a drop
in deployment.

See important disclosures at the end of this report
                                                                      2
Market Dateline / PP 19489/05/2019 (035080)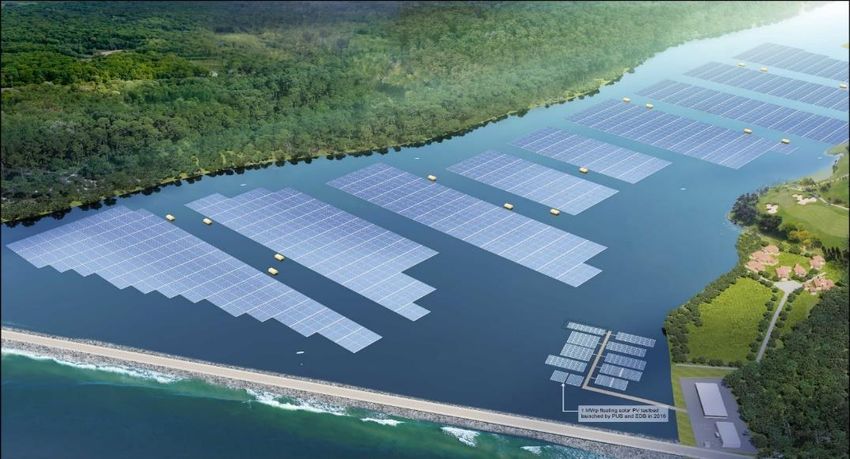
ASEAN Renewable Energy                                                                                            Regional Thematic
2 August 2022                                                                                              Utilities | Renewable Energy

 Figure 2: Renewable net capacity additions by country and                Figure 3: Global net renewable capacity additions by
 region, 2019-2021                                                        technology, 2017-2023

 Source: IEA Renewable Energy Market Update                               Source: IEA Renewable Energy Market Update

Global annual RE capacity addition is estimated by IEA to increase by 8% to 320GW in
2022, and to remain stable in 2023. This is largely driven by the continuous growth in China
as well as acceleration of RE expansion in Europe. Following the Ukraine and Russia war,
we have seen a higher RE target being laid out by many European countries to reduce
energy reliance on Russia. Furthermore, European countries have been suffering from sky
high wholesale power prices in the past one year with much higher coal and gas prices. This
provides more incentive for governments to control energy prices via favourable and
supportive policies. Note that although some of these rates signed for utility scale PV and
onshore wind long-term contracts in certain European countries (ie Germany, Spain, Italy,
etc) are already are the highest in the past five years, they are still significantly below the
current wholesale energy prices. Closer to us, China maintains the lead in RE growth in
order to achieve its ambitious 1,200GW wind and solar PV target by 2030.

But greater effort is still needed to put in place to accelerate RE progress
ASEAN countries have set to achieve 35% share of RE (from a quarter currently) in installed
power capacity by 2025. In the latest edition of World Energy Outlook, IEA has made
projections and analysis under two main scenarios, namely:
  i. The Stated Policies Scenario (STEPS) – reflects the countries’ current policy settings
     based on a sector-by-sector assessment of the specific policies that are in place or
     have been announced;
  ii. The Sustainable Development Scenario (SDS) – delivers on the Paris Agreement
      goal to limit the temperature to “well below 2°C”, alongside goals on energy access
      and air pollution. This scenario is consistent with South-East Asia’s current announced
      climate aspirations.
There are several key takeaways from IEA with this regard. ASEAN countries will not
achieve the target under STEPs unless greater effort is put in place to accelerate the
progress. Eight South-East Asia countries have announced carbon neutrality and net zero
emissions targets. Still, we have yet to see ASEAN governments translating these targets
into detailed policies for future implementations. Essentially, South-East Asia’s policy
choices will have huge implications for its future energy mix as depicted by IEA in the chart
below.

See important disclosures at the end of this report
                                                                      3
Market Dateline / PP 19489/05/2019 (035080)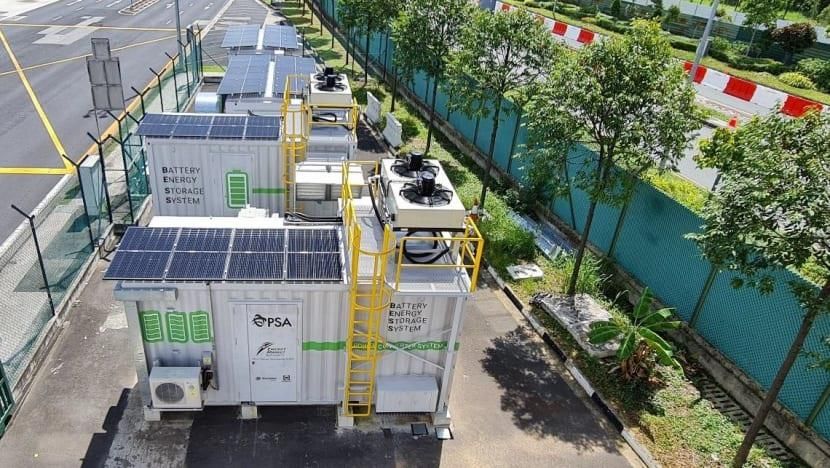
ASEAN Renewable Energy                                                                                             Regional Thematic
2 August 2022                                                                                               Utilities | Renewable Energy

 Figure 4: Energy demand trends in South-East Asia by scenario, 2020-2050

 Source: IEA Southeast Asia Energy Outlook 2022

Additionally, average energy investment pa in South-East Asia from 2016 to 2020 was
USD70bn, of which around 40% is attributable to clean energy technologies – mostly solar
PV, wind and grids. The amount has to be hiked up to USD130bn pa till 2030 under STEPs
and USD190bn pa under SDS. Currently, coal still contributed the largest portion in
electricity supply at 43%, followed by gas (31%) and RE (25%). With that the share of RE
in electricity demand is projected to increase to c.40% and 85% by 2050 in STEPS and
SDS. Currently bulk of the investments originate from public finances including state-owned
enterprises, which are predominantly involved in regulated businesses and the investments
are mostly on infrastructure and grid upgrade. As we have seen in the past two years, private
capital is gradually flowing in for clean energy assets. Other efforts including international
support are needed to boost innovation and energy efficiency as well as to develop
necessary infrastructure amidst continuous regulatory and financing framework
improvements.
To achieve a level of 85% in 2050, ASEAN countries need to deploy 1,100GW of renewable
capacity in the next 30 years. Wind and solar will continue to lead RE growth within the
region, reaching 18% share in electricity generation by 2030 and 44% in 2050. This is
equivalent to an average of 25GW additional solar or wind capacities pa till 2050. Beside
that we are seeing growth from a diverse range of RE options, including hydropower,
bioenergy and geothermal.

 Figure 5: Average annual energy investment in South-East                Figure 6: Power generation and shares of variable
 Asia, 2016-2030                                                         renewables in South-East Asia, SDS, 2020-2050

 Source: IEA Southeast Asia Energy Outlook 2022                          Source: IEA Southeast Asia Energy Outlook 2022

See important disclosures at the end of this report
                                                                     4
Market Dateline / PP 19489/05/2019 (035080)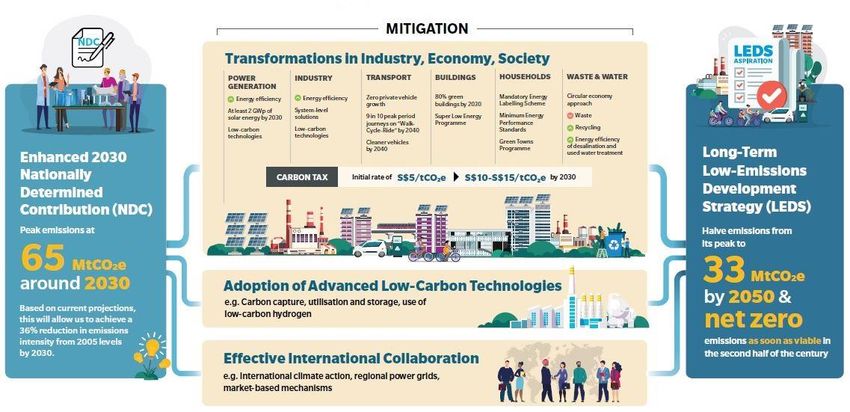
ASEAN Renewable Energy Regional Thematic
2 August 2022 Utilities | Renewable Energy
Figure 7: Energy policies in ASEAN countries
Energy access Efficiency Renewables Fossil fuels Climate change targets
Brunei Reduce total energy Achieve 30% of electricity Reduce CO2 emissions from morning
consumption by 63% from generation from renewables by peak-hour vehicle use by 40% from
business-as-usual (BAU) levels 2035. the BAU level by 2035. Moving
by 2035. 60% EV share of total towards net zero by 2050.
annual vehicle sales by 2035.
Cambodia At least 70% of Cut energy consumption by 20% In an accelerated scenario, total Reduce greenhouse gas (GHG)
households (1m toe) and reduce emissions installed capacity by 2030 at 55% emissions 27% from baseline by
connected to the by 3 MtCO2 by 2035 and relative hydropower, 6.5% biomass and 2030 with international support.
national grid by to BAU. 3.5% solar PV. Official emissions reduction scenario
2030. reaching net-negative by 2030.
Outlines a vision of a carbon neutral
economy by 2050.
Indonesia Achieve 100% Reduce energy intensity by 1% Increase share of “new and Consider Reduce energy intensity by 1% per
electrification by per year to 2025. renewable energy” in primary accelerating year to 2025.
the end of 2024. energy supply to reach 23% by the phasing Set up the long-term strategy to
2025 and 31% by 2050. 52% out of coal in reach net zero emissions by 2060 or
share of renewables in electricity 2040s is sooner.
capacity additions from 2021 to conditional
2030. on
international
funding.*
Lao PDR Achieve Reduce final energy 30% share of renewables in total Conditional GHG emissions
electrification consumption by 10% from the primary energy consumption by reduction target to reach net zero in
rate of 98% by BAU level. 2025. 2050.
2025.
Malaysia Promote energy efficiency in the 31% share of renewables No new Reduce GHG intensity of GDP by
industry and buildings sectors installed capacity by 2025. coal-fired 35% by 2030 from the 2005 level,
with methods of standard setting, power increase to 45% reduction with
labelling, energy audits and plants.* enhanced international support.
building design. Carbon neutrality by 2050 *
Myanmar Achieve Reduce primary energy demand 20% share of renewables
electrification by 8% by 2030 from the 2005 installed capacity by 2025.
rate of 100% by level.
2030.
Philippines Achieve 100% Reduce 40% energy intensity by 15GW renewables installed No new Reduce GHG emissions by 70% from
electrification by 2030 from 2010 level. Reduce capacity by 2030. coal-fired the BAU level by 2030 with the
2022. energy consumption by 1.6% per power condition of international support.
year by 2030 from baseline plants
forecasts. Reduce energy beyond
intensity and total energy those
consumption by 24% relative to already
the BAU level by 2040. approved.
Singapore Improve energy intensity by 35% 2GW solar PV installed capacity Phase out Reduce GHG emissions by 16%
by 2030 from the 2005 levels. by 2030. unabated below BAU level by 2020. Stabilise
coal emissions with aim to peak around
generation 2030, at no higher than 65 MtCO2e.
by 2050.* Halve emissions from peak to 33
MtCO2e by 2050, to achieve net zero
emissions in the second half of the
century.
Thailand Reduce energy intensity by 30% Increase share of renewables to Reduce GHG emissions by 20% from
by 2036 from 2010 level. 30% in total final energy the BAU level by 2030, increase to
consumption by 2037; increase 25% with enhanced international
share of renewables-based support.
power to 36% in capacity and to Aim to reach carbon neutrality in 2050
20% in generation by 2037. and net zero GHG emissions by
Increase share of renewables in 2065. Reach net zero GHG
transport fuel consumption to emissions in 2050 with support of
25% by 2036 technology transfer/cooperation and
availability of financing.*
Vietnam Targets on renewables share in Phasing out Reduce GHG emissions by 9% by
TPES of 15–20% in 2030 and of coal-fired 2030 and by 27% from BAU level with
25–30% in 2050. 31-38GW solar power international support. Targets for
PV and wind installed capacity by generation GHG reductions from energy use:
2030. 4GW offshore wind by 2040s.* 15% by 2030 and 20% by 2045 from
installed capacity by 2030, Plan 31% BAU level. Make use of domestic
36GW by 2045. share of resources, along with international
coal cooperation, to achieve net zero
installed emissions by 2050.*
capacity by
2030
Note: * Though announced by government officials at COP26 or other opportunities, these statements were not yet formulated in detailed plans such as NDCs or
long-term strategies as of Apr 2022
Source: International Energy Agency (IEA)
See important disclosures at the end of this report
5
Market Dateline / PP 19489/05/2019 (035080)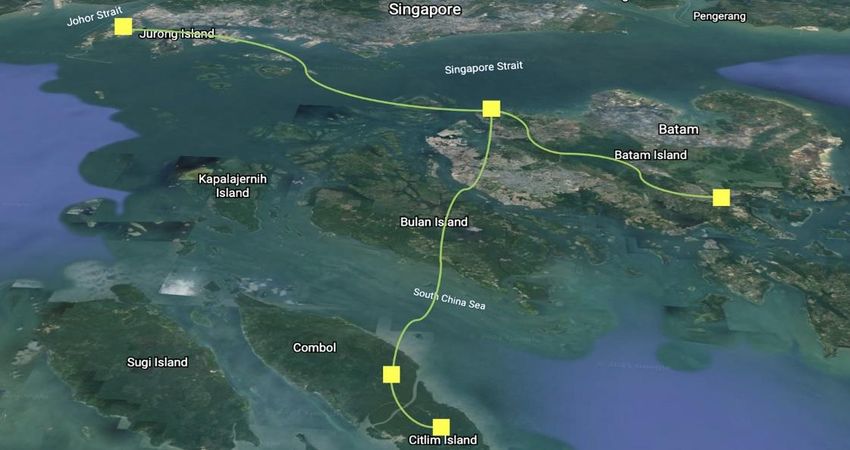
ASEAN Renewable Energy                                                                                Regional Thematic
2 August 2022                                                                                     Utilities | Renewable Energy

ASEAN Power Grid
Renewables need to be well integrated into the grid
As the share of renewables is expected to increase over the longer term, it is important to
integrate solar and wind into the system more efficiently. These renewables are highly
sporadic and dependent on weather. There are times when the wind does not blow as well
as times when the sun is covered by clouds and solar panels do not perform at night. Such
inconsistency in power generation could add pressure to the existing power supply systems
which are mostly catered for conventional fossil fuel-based generation. Solar energy peaks
during the day and tapers off at night when electricity demand increases. This would require
other electricity generators to ramp up energy production in a short span of time when the
sun sets. As such, it may not bode well for conventional generators, which require a longer
time to heat up and cool down and operate more efficiently for long hours continuously.
In planning for firm capacity, the amount of power generated that can be guaranteed to meet
demand at any given time is important to provide grid stabilisation. Hydropower is deemed
as a relatively stable source of renewable energy as it can be injected into the grid the
fastest, and hence, could be used to complement solar and wind to derive a more stable
output curve.
The national grid upgrade is needed to integrate RE to support a dynamic two-way energy
flow, while maintaining voltage stability. Essentially a smart grid is needed, equipped with
smart meters. The system should be able to perform data collection, monitor power plant
performance as well as execute and provide solutions to accommodate volatility arising from
renewable energy plants.

ASEAN power grid
The ASEAN Plan of Action for Energy Cooperation (APAEC) is the regional blueprint for the
energy sector – it is being used to set a sustainable energy landscape in ASEAN. This
blueprint comprises seven key programme areas under APAEC Phase II: 2021-2025,
strategies and action plans to transition into RE include:
  i. The deployment of large-scale RE systems;
  ii. Accommodating higher shares of RE in the ASEAN Power Grid (APG);
 iii. Increasing infrastructure investment;
 iv. Promoting smart grids to accelerate RE deployment;
 v. Promotion of decentralised and distributed RE systems.
New and advanced RE technologies, such as waste-to-energy, RE-based hydrogen, energy
storage, concentrated solar thermal, and distributed renewables for energy access will also
be explored.
The APG is one of the major projects for regional integration. This grid has progressed
gradually from bilateral to sub-regional arrangements. Feasibility studies were carried out
to identify which interconnection projects were beneficial for the region. Moving forward, the
strategy is to accelerate the progress of these integration projects and initiate the expansion
of multilateral electricity trades. Another key focus is to integrate RE and other digital
developments into the grids to stabilise the APG’s performance.
To date, it was reported that seven of 16 power interconnection projects have been
completed. One programme conducted on a multilateral basis is the Lao PDR-Thailand-
Malaysia-Singapore Power Integration Project (LTMS-PIP). Recently, TNB has signed an
Energy Wheeling Agreement (EWA) for the sale, transmission and purchase of electrical
energy at 30-100MW from Lao PDR to Singapore through Thailand and Malaysia using the
existing interconnections facilities owned by all the countries involved. The EWA will be
effective for a period of two years beginning Jun 2022.

See important disclosures at the end of this report
                                                                      6
Market Dateline / PP 19489/05/2019 (035080)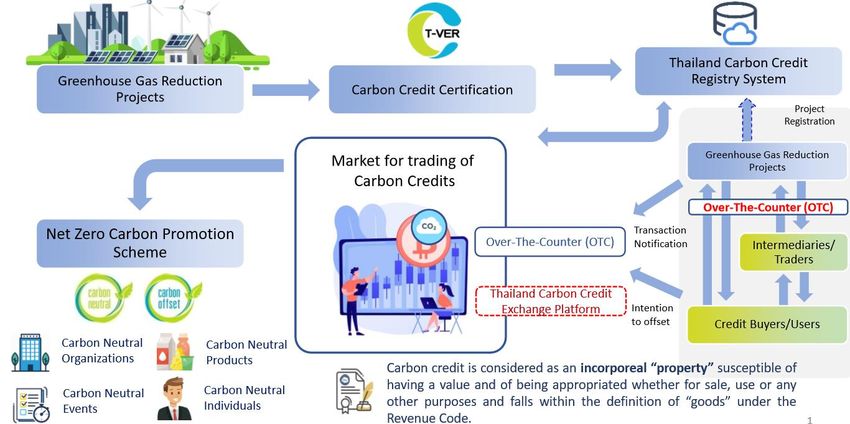
ASEAN Renewable Energy                                                                               Regional Thematic
2 August 2022                                                                                    Utilities | Renewable Energy

 Figure 8: ASEAN interconnection projects (updated in Apr 2020)

 Source: ASEAN Centre for Energy’s 6th ASEAN Energy Outlook

BESS applications fit well
Additionally, storage is a necessity when thermal reserve capacity becomes limited in the
future. It can reduce and mitigate the curtailment of RE supply and convert intermittent solar
and wind generation into near-firm daily output, stabilising and smoothening electricity
output. A BESS collects energy from an electricity grid or renewable power sources, such
as solar and wind, and stores it using battery storage technology. Then, batteries discharge
and release the energy when necessary ie in peak demand, power outages, and/or in a
variety of other applications. By storing excess energy and providing reserve capacity, A
BESS can take the load off overloaded transmission & distribution (T&D) lines and prevent
congestion in transmission systems via storing excess energy and providing excess reserve
capacity. A renewable-based energy system may be fragile and vulnerable to irregular
power generation patterns without sufficient energy storage system (ESS) in place. Excess
electricity generated during the peak will be curtailed and wasted while a supply deficit will
happen during a lull.

Robust growth but rising cost could lead to project deferral
There are generally two main BESS applications – front-of-the-meter (FTM) and behind-the-
meter (BTM). FTM BESS is regarded as utility scale or grid-scale battery storage,
connecting to distribution/transmission networks or power generation assets. These utility-
scale storage capacity ranges from several megawatt-hours to hundreds. On the other
hand, BTM BESS are on-site solutions, connecting to the back of utility meters in residential,
commercial, and industrial sectors. It could also be integrated with a gas plant to extend its
lifecycle by optimising the turbine performance and reducing wear and tear.
According to Frost & Sullivan, the global grid battery storage capacity is likely to grow to
135GW by 2030 from 8GW in 2020. The market is estimated to grow at an impressive CAGR
of 23% to USD15.9bn by 2030 from USD2bn in 2020 led by continuous expansion in RE as
well as decline in technologies costs. Despite the bright outlook, we think that near-term
installation growth could slow down as a result of high inflation. Project developers have to
renegotiate contract prices with offtakers on rising cost, which could delay the
commissioning process. Additionally, there could be more project deferral and investors are
adopting a wait-and-see approach until prices trend down.

See important disclosures at the end of this report
                                                                     7
Market Dateline / PP 19489/05/2019 (035080)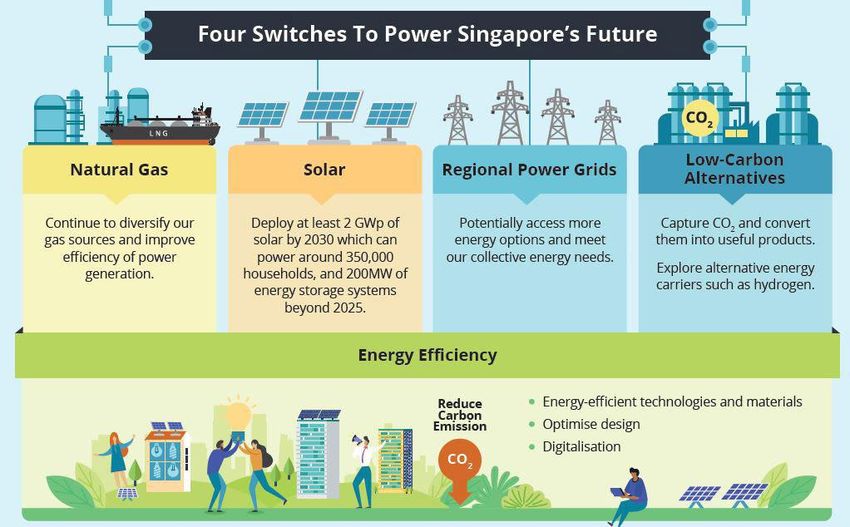
ASEAN Renewable Energy                                                                        Regional Thematic
2 August 2022                                                                             Utilities | Renewable Energy

 Figure 9: BESS applications

 Source: Integra Sources LL

Deployment of energy storage systems
Within the ASEAN region, Wärtsilä installed a 2.4MW/2.4MWh ESS, the first utility-scale
battery storage project in Singapore. The Finland-headquartered multinational energy
solutions provider’s project was supported by Singapore’s Energy Market Authority (EMA)
as well as energy utilities company SP Group. The ESS will participate in the wholesale
electricity market to provide services necessary to help integrate variable solar PV
generation into the grid while reducing peak demand.

 Figure 10: Wärtsilä’s EMA-supported lithium-ion battery storage project

 Source: Singapore’s Energy Market Authority (EMA)

See important disclosures at the end of this report
                                                                8
Market Dateline / PP 19489/05/2019 (035080)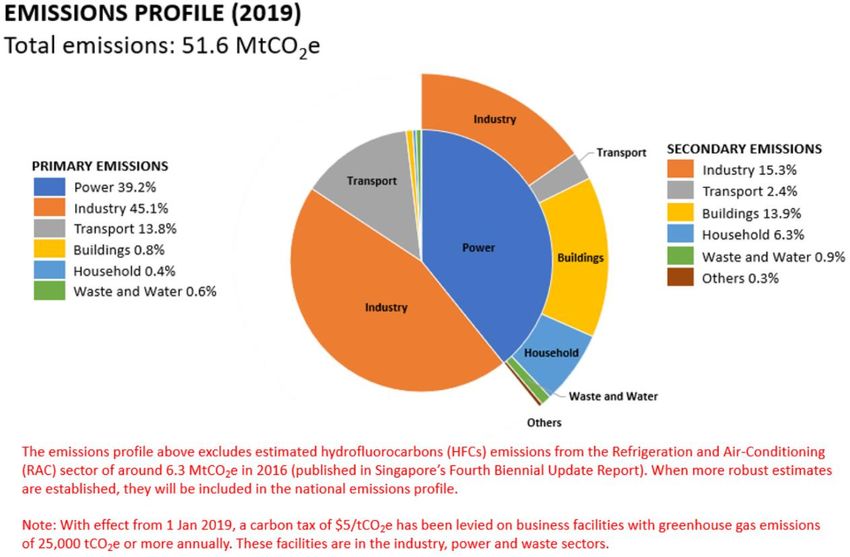
ASEAN Renewable Energy                                                                                Regional Thematic
2 August 2022                                                                                     Utilities | Renewable Energy

The EMA launched the Accelerating Energy Storage for Singapore (ACCESS) programme,
announcing the lithium-ion ESS trial project in 2017 and awarding it to locally-headquartered
engineering firm CW Group. CW Group and clean energy technology accelerator/incubator
Sunseap Energy Ventures picked out Wärtsilä as the technology provider and engineering,
procurement and construction (EPC) partner for the project.
Battery storage system at the Pasir Panjang Terminal: Singapore has set up a BESS to
manage peak consumption at the world's largest container transhipment hub. The project
at the Pasir Panjang Terminal is part of an SGD8m partnership between the EMA and PSA
Corporation. It is also part of the smart grid management system which can improve the
energy efficiency of port operations by 2.5% and reduce the port's carbon footprint by 1,000
tonnes of carbon dioxide equivalent (tCO2e) pa, akin to removing around 300 cars off the
road annually.
Slated to start in 3Q22, the system would provide energy to be used to run port activities
and equipment including cranes and prime movers in a more efficient way. The project had
been awarded to Envision Digital, a Singapore-based company providing artificial
intelligence and Internet technologies software, which developed a smart grid management
system that includes the BESS and solar PV panels. The platform uses machine learning
to provide real-time automated forecasting of the terminal's energy demand.

 Figure 11: The battery storage system consists two battery containers and two
 power conversion system (PCS) containers

 Source: PSA Corporation Ltd

Whenever a surge in energy consumption is forecasted, the 2MWh battery energy storage
unit will be activated to supply energy to help meet demand. During other times, the unit can
be used to provide ancillary services to Singapore's power grid and generate revenue.
The insights from the project may also “validate” the possibility of commercial and industrial
users adopting BESS to serve multiple purposes, such as demand management onsite and
providing commercial ancillary services to support power systems. Insights from the project
will also be applied to the energy system at the Tuas Port, which will be the world's largest
fully-automated terminal, to be completed in the 2040s.
Sembcorp to build 200MW battery storage at Jurong Island: Sembcorp is building 200MWh
of battery storage systems on Jurong Island. The EMA issued an expression of interest
(EOI) in May 2022 to build 200MW/200MWh of battery storage, which resulted in the award
to Sembcorp. Sembcorp expects to complete work on the BESS deployment by the end of
this year. Sembcorp was one of EMA’s collaborators on a programme to accelerate the
deployment of energy storage in Singapore, which began in late 2018 and received the
authority’s support to build the country’s first distributed virtual power plant (VPP). EMA had
already identified the ability of energy storage to help integrate renewable energy and
enhance the overall reliability of the energy supply and grid.

See important disclosures at the end of this report
                                                                      9
Market Dateline / PP 19489/05/2019 (035080)
ASEAN Renewable Energy Regional Thematic
2 August 2022 Utilities | Renewable Energy
Figure 12: Malaysia’s new capacity projection (MW) (2021-2039)
Source: Report on West Malaysia Generation Development Plan 2020 (2021-2039)
Malaysia is still lagging behind in terms of BESS applications. According to the country’s
Energy Commission (EC), the penetration limit for grids connected solar PV is set at 24%
of the estimated peak demand and will increase to 30% in 2035 to ensure continuity of
electricity supply in unexpected circumstances, and to cope with generation uncertainty and
availability from variable renewable energy (vRE). This is done by having new thermal
capacities to replace retired plants along the way. Besides this, the grid infrastructure would
be further strengthened and enhanced with technical enablers such as ESS. Five units of
BESS with a capacity of 100MW have been planned for installation annually into the system
from 2030-2034.
See important disclosures at the end of this report
10
Market Dateline / PP 19489/05/2019 (035080)ASEAN Renewable Energy Regional Thematic
2 August 2022 Utilities | Renewable Energy
High Fuel Cost And Inflation Impact
The worst inflation in decades
With the continuous surge in commodity prices since mid-2021, fuel prices, both oil and gas,
have also spiked up in tandem with the gradual reopening of economies amidst geopolitical
uncertainties. In the past few months, we have seen acceleration of inflation across the
world, with many countries seeing the worst inflation in decades. The International Monetary
Fund (IMF) has predicted inflation to be worse in developing economies at an average of
8.7% in 2022, as compared to a projection of 5.7% in developed nations over the same
period. We see multiple repercussions arising from this monetary phenomenon and
countries around the world are facing challenges in resolving it.
Figure 13: Inflation rate, average consumer prices projection in 2022
Source: IMF
Ramping up clean energy is the solution?
Theoretically, increasing RE capacities and expediting energy transition process are the
long term solutions to reduce fossil fuel demand and thus lower its reliance. High fuel costs
may incentivise consumers to opt for electric cars in the longer run. Wind and solar are
intrinsically deflationary while fossil fuels are inflationary. The cost of generating electricity
from renewable sources has dwindled over the years, narrowing the gap with non-
renewable sources. This is mainly led by scalable granular technologies, greater innovation
to produce and deploy solar panels and wind turbines.
However, moving away from fossil fuel investment too aggressively may not be a good
option to cool down prices. The consistent underinvestment in the O&G space in the medium
term may cause prolonged supply shortages when fossil fuel demand is not being effectively
trimmed. The ultimate outcome could be O&G prices staying elevated for a longer period.
This probably explains why accelerating clean energy with more tax credits and increasing
higher oil production are both being proposed by the Biden administration to combat
inflation. US President Joe Biden has repeatedly emphasised the urgency to commit to
greenhouse gas (GHG) emission reductions while bringing down gasoline prices is also an
immediate task to be sorted. At the same time, the administration has asked Congress to
assess fees on idled wells and non-producing acres of federal lands to encourage oil
companies to produce more.
Highest emissions seen in 2021
According to IEA, global energy-related carbon dioxide emissions hiked by 6% in 2021 to
all time high of 36.3bn tonnes led by strong global economic rebound and higher reliance
on coal. The spike in gas prices have led to higher coal burning, offsetting the impact from
largest ever RE capacities growth. Emissions from coal also reached the highest level ever
at 15.3bn tonnes, accounted for over 40% of the overall growth in global CO2 emissions in
See important disclosures at the end of this report
11
Market Dateline / PP 19489/05/2019 (035080)ASEAN Renewable Energy Regional Thematic
2 August 2022 Utilities | Renewable Energy
2021. This showcased that governments are forced to prioritise energy price affordability
and secure energy access, which could potentially overshadow clean energy development.
Global near-term emissions may continue to rise increase if world governments slow down
coal plant retirement plan to ensure stability and sustainability of energy supply. Meanwhile,
oil producers will spend more on upstream E&P to boost production leveraging on elevated
prices.
Figure 14: Total CO2 emissions from energy combustion and Figure 15: Change in CO2 emissions by fossil fuel, relative
industrial processes and their annual change, 1900-2021 to 2019 levels, 2019-2021
Source: IEA, Global Energy Review: CO2 Emissions in 2021 Source: IEA, Global Energy Review: CO2 Emissions in 2021
Fuel subsidy policies to challenge climate change goal
As long as fuel prices continue to stay elevated, we expect the high fuel subsidy to remain
a fiscal burden to most ASEAN countries which are oil importers, with certain degree of
subsidy in place. Fuel subsidies that reduce the price of fossil fuels are rather controversial
against the climate change strategy as it incentivises higher fuel consumption and therefore
increases carbon emissions. It will also result in an inefficient allocation of economic
resources and hinder growth. As such, clean energy development is also bogged down by
rising inflation given world governments will have relatively lesser financial capacity to grow
low emissions industry.
Subsidy reform is essential for better targeted social spending and it helps to reduce fossil
fuel reliance. At the Conference of the Parties (COP26) in 2021, 197 countries agreed to
accelerate efforts to phase-out inefficient fossil fuel subsidies. It is tough to promote subsidy
reform as it seems to be unfavourable, especially to the mass market, A more complicated
concern is the likelihood of higher inflation with a cascading effect to the overall economy.
For oil exporting countries like Malaysia, it is difficult to completely phase out subsidy.
Currently, the government is working to replace blanket fuel subsidy to targeted subsidy.
According to the Malaysia’s finance minister, Tengku Datuk Seri Zafrul Abdul Aziz, fuel
subsidy will reach MYR30bn in 2022. He also mentioned that for every MYR1 of fuel
subsidy, MYR0.53 go to the T20 (Top 20% earners), while only MYR0.15 benefit the B40
group. Therefore, a targeted subsidy will ensure the bulk of the fund is being channelled to
the targeted population.
See important disclosures at the end of this report
12
Market Dateline / PP 19489/05/2019 (035080)ASEAN Renewable Energy Regional Thematic
2 August 2022 Utilities | Renewable Energy
Figure 16: Retail prices of oil products in selected countries, Figure 17: Fossil fuel subsidies in South-East Asia and oil
2020-2022 prices, 2010-2020
*Note: For Thailand, prices are weighted average monthly prices of ULG 95 and HSD Source: IEA Southeast Asia Energy Outlook 2022
B7 in Bangkok. For the Philippines, prices are common prices of RON 95 gasoline
and diesel in the first week of each month in Manila. For Malaysia and Singapore,
prices are for RON93-96. For Vietnam, prices are for RON below 93
Source: IEA Southeast Asia Energy Outlook 2022
According to Renewable Power Generation Costs in 2021, published by the International
Renewable Energy Agency (IRENA) in July this year, the levelised cost of electricity from
solar PV declined by 13% YoY , whilst onshore and offshore wind dropped by 15% and 13%
YoY in 2021. Meanwhile, the global weighted average cost of newly commissioned solar
PV, onshore and offshore wind power projects also fell in 2021 given the significant lag in
pass through to total costs. We think the escalation of raw material prices has not been
captured in 2021 due to time difference between financial investment decisions and
commissioning of the project. Generally, project cost of newly commissioned RE in 2021
has been locked in much earlier and even if there is a surge in costing, it would have been
sufficiently covered under the contingency allowances. As such, the magnitude of rising cost
pressure is largely being felt in 2022 when these new projects have to be kickstarted,
undergo procurement and construction phases. Recently, commodity prices have retraced
from the peak in response to rising recession risk and weaker economic outlook. This could
provide a breather to overall project costing.
Figure 18: Global weighted average total installed costs, capacity factors and LCOE of newly commissioned utility-scale
solar PV, onshore and offshore wind, 2010-2021
Source: Power Generation Costs in 2021, IRENA
See important disclosures at the end of this report
13
Market Dateline / PP 19489/05/2019 (035080)ASEAN Renewable Energy Regional Thematic
2 August 2022 Utilities | Renewable Energy
Figure 19: Global weighted average LCOEs from newly commissioned, utility-scale renewable power generation
technologies, 2010-2021
Note: This data is for the year of commissioning. The t hick lines are the global weighted average LCOE value derived from the individual plants commissioned in each year.
The LCOE is calculated with project-specific installed costs and capacity factors. The single band represents the fossil fuel-fired power generation cost range, while the
bands for each technology and year represent the 5th and 95th percentile bands for renewable projects.
Source: IRENA Renewable Cost Database.
See important disclosures at the end of this report
14
Market Dateline / PP 19489/05/2019 (035080)ASEAN Renewable Energy Regional Thematic
2 August 2022 Utilities | Renewable Energy
Carbon Pricing
Carbon pricing is now one of the most popular policy tools used to combat climate change.
It is about incorporating climate change cost into economic decision making in order to move
towards low emission or eventually net zero emissions.
Carbon tax is seen as a key policy instrument to combat climate change. It is imposed by
the government on GHG producers, which eventually incentivise them to lower emissions
or pursue cleaner approaches. The emission trading system (ETS) is also another rising
initiative which provides a platform for companies to trade emission units to meet their
emission targets.
There are generally two type of ETS schemes, namely cap and trade as well as baseline
and credit scheme. Under the cap and trade scheme, a cap is set and emissions are
monitored against this cap. Emission permits are either auctioned out or distributed for free
according specific criteria. Under a baseline and credit system, a baseline has to be set for
each emitting activity, usually based on historical emission and production rates. Polluters
that reduce their emissions below such level can earn “credits”, which can be monetised.
Started in 2005, the EU ETS is the world’s first international ETS. Operating as a cap and
trade system, EU is now at Phase 4 and the sectors covered include power and heat
generation, energy-intensive industrial sectors and aviation within Europe. The largest
carbon market by traded value, the EU ETS, saw record trading activity and prices in both
spot and futures markets in 2021. China launched its national ETS in 2021 and trading
commenced on the platform operated by the Shanghai Environment and Energy Exchange.
The first compliance cycle covers 2,162 power companies across the country, responsible
for a total of over 4bn tCO2e emissions annually (30% of national emissions).
Apart from ETS, carbon crediting mechanism is also playing an increasingly important role
in the energy transition journey. It refers to a system where tradable credits (typically
representing a tCO2e) are generated through voluntarily implemented emission reduction
or removal activities. Such mechanism is different to carbon taxes and ETSs, companies
could generate carbon credits to prove removal of emissions. In China, Chinese Certified
Emission Reduction (CCER) is the voluntary carbon credits that are certified by the Chinese
Government. Such activities include renewable power generation and waste-to-energy
projects, as well as forestry projects. With that in place, thermal generators will have to
transform their energy mix by investing in RE, to reduce emission via better technology
innovation (ie carbon capture and storage). Else, they would have to purchase emission
quota or certified carbon credit to offset (5% of annual quota in China).
Carbon pricing initiatives gaining traction
According to World Bank statistics, there are 68 carbon pricing initiatives implemented,
covering 12 GtCO2e, representing 23% of global GHG emissions in 2022. A closer look
reveals 36 of them are carbon tax while the remaining 32 are ETS. With more countries
pledging for net zero targets, we could expect more governments to adopt carbon pricing
instruments. Overall global pricing revenue increased by c.60% YoY to USD84bn in 2021
of which ETS revenue surpassed carbon tax revenue for the first time.
Rising carbon prices
Direct carbon prices have hit an all-time high in jurisdictions including the European Union
(EU), New Zealand, and etc in 2021 but experienced a dip in early 2022 following the
Russia-Ukraine war in February. Prices have started to recover but still remain below the
record high prior to the war. The hike was largely driven by more aggressive climate change
targets and policy changes amidst more stringent ETS regulations. According to State and
Trends of Carbon Pricing 2022 published by World Bank, carbon tax rates remained
relatively flat in 2020, but increased by an average of c.USD6/tCO2e in 2021. As of Apr
2022, average rates rose by another USD5/tCO2e. Most of these increases have been
previous scheduled, while some countries’ (Switzerland and Liechtenstein) 2022 hike was
led by an automatic adjustment mechanism due to the intermediate GHG targets not being
met.
See important disclosures at the end of this report
15
Market Dateline / PP 19489/05/2019 (035080)ASEAN Renewable Energy Regional Thematic
2 August 2022 Utilities | Renewable Energy
Figure 20: Summary of national carbon pricing initiatives
Note: Carbon pricing initiatives are considered “scheduled for implementation” once they have been formally adopted through legislation and have an official, planned start
date. Carbon pricing initiatives are considered “under consideration” if the government has announced its intention to work towards the implementation of a carbon pricing
initiative and this has been formally confirmed by official government sources. TCI refers to Transportation and Climate Initiative. RGGI refers to the Regional Greenhouse
Gas Initiative.
Source: World Bank
Figure 21: Record high carbon tax rates in six jurisdictions Figure 22: Price evolution in select ETSs from 2008 to 2021
Note: Dotted line indicates scheduled price increases for those jurisdictions that have Source: State and Trends of Carbon Pricing 2022, World Bank
communicated future price trajectories.*Estimated path based on the government's
ambition to increase the tax rate by at least USD 1 per year, and to increase the rate
more rapidly from 2026 to reach USD30/tCO2e in 2030 and USD 120/tCO2e beyond
2050.**This is a low range projection as the Singapore government plans to reach a
carbon tax rate of SGD 50-80/tCO2e (36-58 USD/tCO2e) by 2030.***British Columbia
has committed to meet or exceed the federal benchmark carbon price.
Source: State and Trends of Carbon Pricing 2022, World Bank
See important disclosures at the end of this report
16
Market Dateline / PP 19489/05/2019 (035080)ASEAN Renewable Energy Regional Thematic
2 August 2022 Utilities | Renewable Energy
Figure 23: Absolute emissions coverage, share of emissions covered, and prices for CPIs across jurisdictions
Note: Bubble size represents absolute covered total greenhouse gas emissions.
Note 2: *For CPIs that have multiple price levels, the price applying to the larger share of emissions is used.
Note 3: **This is a composite presentation representing total emissions covered by carbon pricing instruments under the Pan-Canadian Framework. It includes a combination
of ETS-like and carbon tax-like instruments, implemented at both provincial and federal levels.
Source: World Bank
Sweden has the highest carbon tax rate at EUR116.33 (c.USD137)/t of carbon emissions
in Europe, followed by Switzerland and Liechtenstein (EUR85.76) and Finland (EUR62).
Such taxes can be levied for different types of GHGs and each country will have a different
scope and regime.
Singapore is the first country in South-East Asia to introduce a carbon price. It was
introduced in 2019, at SGD5/tCO2e and is applicable on facilities that directly emit at least
25,000 tCO2e of GHG annually. We understand that the carbon tax is levied on the six
GHGs that Singapore is currently reporting to the United Nations Framework Convention on
Climate Change (UNFCCC), namely carbon dioxide (CO2), methane (CH4), nitrous oxide
(N2O), hydrofluorocarbons (HFCs), perfluorocarbons (PFCs), and sulphur hexafluoride
(SF6). With that, the tax covers 80% of the total GHG emissions from about 50 facilities from
the manufacturing, power, waste, and water sectors.
See important disclosures at the end of this report
17
Market Dateline / PP 19489/05/2019 (035080)ASEAN Renewable Energy Regional Thematic
2 August 2022 Utilities | Renewable Energy
Figure 24: Carbon prices as of 1 Apr 2022
Note: Nominal prices on April 1, 2022 are shown for illustrative purpose only. Prices are not necessarily comparable between CPIs because of (for example) differences in the
sectors covered and allocation methods applied, specific exemptions, and compensation methods.
Note 2: *The 2030 carbon price corridor is based on the recommendations in the report of the High-Level Commission on Carbon Prices.
Note 3: **Several jurisdictions apply different carbon tax rates to different sectors or fuels. In these cases, we have indicated the range of tax rates applied, with the dark blue
shading showing the lower rate and the combined dark blue and light blue shading representing the higher rate.
Source: World Bank
Voluntary carbon market (VCM)
Unlike the regulatory carbon ETS, which is mainly on certain industries and parties, the VCM
provides a platform that enables anyone to offset carbon emissions. Anyone who can be a
single person, multiple people, or an organisation can be a developer as long as they are
running an offset project. The project has to be certified on how much of carbon emissions
is avoided or removed, in which one carbon credit represents 1 tCO2e reduction. Generally,
the voluntary carbon credit (VCC) is stored in a registry owned or retained by the standard
that certified the project, and it eventually can be traded. However, it cannot be transferred
to a different registry or standard.
See important disclosures at the end of this report
18
Market Dateline / PP 19489/05/2019 (035080)ASEAN Renewable Energy Regional Thematic
2 August 2022 Utilities | Renewable Energy
Figure 25: Voluntary carbon market mechanism
Source: Ernst & Young
One of the key concerns of VCM is that it may not have sufficient governance given that the
compliance market is mainly regulated by national or international public authorities while
the entities establishing the voluntary carbon credit are private entities, more often non-
governmental organisations (NGOs). They have their own criteria for the carbon offset to be
qualified in their respective registry in different names, ie American Carbon Registry (ACR),
Climate Action Reserve (CAR), Gold Standard, Plan Vivo, and Verra’s Verified Carbon
Standard (VCS).
Collaboration among the VCM stakeholders, ie project developers, governments, financial
institutions will happen to strengthen the credibility. Government involvement to provide
regulatory framework could increase the VCM’s credibility and stability. For instance,
Climate Impact X (CIX), Singapore’s voluntary carbon credits exchange is jointly founded
by Singapore Exchange, DBS Group, Standard Chartered, and Temasek, with two digital
platforms: the Carbon Exchange and the Project Marketplace.
Despite VCM is experiencing rapid growth and gaining unprecedented traction globally,
VCCs, the integration of VCM with compliance market has to be done in the longer run. This
also involves complying with emission reductions obligations ie VCC in compliance with
markets such as EU ETS.
Rising carbon pricing initiatives within the region
Singapore is the first to implement carbon tax back in 2019 and to progressively increase
over the years. We see more carbon pricing initiatives (either carbon tax or emission trading)
being scheduled for implementation or under considerations within the ASEAN region.
Indonesia, Malaysia, and Thailand have announced plans to implement carbon emissions
trading. However, the implementation timeline may be pushed back due to uncertain
economic outlook amidst a high inflationary environment, as evident by the Indonesian
Government’s recent postponement of carbon tax implementation.
See important disclosures at the end of this report
19
Market Dateline / PP 19489/05/2019 (035080)ASEAN Renewable Energy Regional Thematic
2 August 2022 Utilities | Renewable Energy
Figure 26: ASEAN countries’ status on ETS and carbon tax
Countries Status Remarks
Brunei ETS or carbon tax under - Explored a preliminary scoping for carbon pricing which includes an emissions threshold
consideration as well as targeted sub-sectors
- Conducted a workshop on carbon pricing policies that aims at shaping the direction for
carbon pricing policy in the country as well as learning from the experiences of other
countries
Indonesia Carbon tax implemented - Passed a law on tax regulation harmonisation in Oct2021 which includes the
or scheduled, ETS under introduction of a carbon tax. The carbon tax was initially set to commence in Apr 2022
consideration but was pushed back to July in light of rising energy commodity prices. Recently, it was
postponed again due to constraints from uncertainty of inflation and macroeconomic
issues
- Carbon Pricing Roadmap also includes a longer-term plan for introducing an ETS and
a carbon crediting mechanism
- Looking to determine emission caps for coal-fired power stations in 2022
- Further assessing the potential application of a carbon price to other sectors (according
to sector readiness), with the aim of having a broad coverage carbon pricing policy mix
implemented by 2025.
- Working on regulations to guide the development and implementation of carbon pricing
instruments, including procedures on ETS implementation in the power sector.
Malaysia ETS or carbon tax under - Working to develop an ETS policy and implementation framework
consideration - Continues to consider the potential for implementing other carbon pricing policies,
including a carbon tax and voluntary carbon markets
Singapore Carbon tax implemented - Increasing carbon tax rate to SGD25/tCO2e (USD18/tCO2e) in 2024 and 2025, and
or scheduled, ETS under SGD45/tCO2e (USD33/tCO2e) in 2026 and 2027, to reach SGD50-80/tCO2e (USD37-
consideration 59/tCO2e) by 2030
- Placed schemes to financially support businesses’ decarbonisation efforts and will
continue to review the support measures for businesses to implement needle-moving
decarbonisation solutions to increase competitiveness
- Introduced high-quality international carbon credits to offset up to 5% of taxable
emissions which will commence in 2024
- A transition framework will also be introduced to give existing EITE companies more
time to adjust to a low-carbon economy
- Existing facilities in EITE sectors will receive transitory allowances for part of their
emissions, based on efficiency standards and decarbonisation targets
- The Government is currently consulting affected companies on the framework. Details
will be finalised by 2023, ahead of the increase of carbon tax level in 2024
Thailand ETS or carbon tax under - Developing rules and guidelines for carbon credit trading, expected to be released in
consideration 2022
Vietnam ETS or carbon tax under - Issued revised Law on Environmental Protection in Nov 2020 which confirmed the role
consideration of carbon pricing in Vietnam’s mitigation policy mix, provided the legal mandate for the
development of a domestic emissions trading scheme and a national crediting
mechanism, and assigned ministerial responsibilities
- Issued a decree in 2022 which provides a comprehensive set of regulations under the
revised Law on Environmental Protection and outlines a roadmap for the
implementation
- The decree sets forth rules for monitoring, reporting, and verification (MRV) systems
and includes provisions for developing a national ETS with a declining cap
corresponding to Vietnam’s NDC and the establishment of a national crediting
mechanism
- Anticipates launching a pilot ETS in 2026, before launching a full ETS in 2028
Source: The World Bank
See important disclosures at the end of this report
20
Market Dateline / PP 19489/05/2019 (035080)ASEAN Renewable Energy Regional Thematic
2 August 2022 Utilities | Renewable Energy
Indonesia
Indonesia’s Renewable Energy Roadmap
Clear government roadmap needs to be backed up by strong funding
Emissions reduction to mitigate the negative impact of climate change has become a shared
goal of the international community in recent years with more countries and businesses
around the world committed to net-zero emissions. The race to carbon or climate neutrality
coincides with exacerbating extreme weather events, falling renewable energy costs, and
increased awareness of climate change. To date, however, Indonesia is lagging behind
other countries by only targeting 2060 to achieve net-zero emissions despite its status as
an archipelago country that is vulnerable to climate change.
Through its Nationally Determined Contribution (NDC), Indonesia aims to reduce GHG
emissions by 29% (voluntarily), or 41% (with international support) compared to the
business-as-usual (BAU) scenario by 2030. Current NDC, however, is far from what is
needed to achieve the Paris Agreement.
The energy sector has become the second largest emitting sector in Indonesia by
contributing to c.35% of total emissions in 2021 and is projected to turn into the largest
emitter by 2030 if no decarbonisation efforts are carried out. Considering the climate
urgency, deep decarbonisation should become one of the Indonesian Government’s top
priorities for the next three decades. Decarbonisation should also be seen as an opportunity
to modernise the overall economy, avoid costs of climate damages, improve air quality,
prevent premature deaths, reduce healthcare costs, increase energy efficiency, secure
water and food availability, and preserve biodiversity.
Figure 27: Indonesia’s emissions cut target Figure 28: Source of emissions by sector (2030 projection) –
without decarbonisation scenario
Manufacturing
Peat Industry
decomposition 3%
10%
Waste
10%
Energy
Agriculture 50%
& forestry
13%
Peat fire
14%
Note: MtCO2e stands for millions of tCO2e Source: IETO 2022, RHB
Source: Indonesia Energy Transition Outlook (IETO) 2022, RHB
The pandemic has helped curb GHG emissions, mainly due to slowing economic activity.
However, to achieve the deep decarbonisation goal, structural changes are needed. The
changes, particularly, need to happen this decade to keep up with the race to zero
emissions. By 2030, Indonesia needs to see:
i. Almost half of electricity is sourced from renewable energy, up from c.12% today. Solar
power contributes the largest to total power generation at around 24%;
ii. Renewable installed capacity increase to 140GW, up from 10GW today. Solar PV
needs to grow by 10-11GW per year, around a sixth of the growth to come from rooftop
solar PV. Power grid to expand to more than 13GW with some inter-island connections
being established;
iii. Coal moratorium be imposed to peak carbon emissions by 2025. Phasing out of more
than 15-year-old-coal fired power plants will be carried out from 2025;
See important disclosures at the end of this report
21
Market Dateline / PP 19489/05/2019 (035080)You can also read