USA Compression Partners, LP - 2022 UBS Winter Infrastructure & Energy Conference
←
→
Page content transcription
If your browser does not render page correctly, please read the page content below

USA Compression Partners, LP
 2022 UBS Winter Infrastructure &
       Energy Conference
        January 11, 2022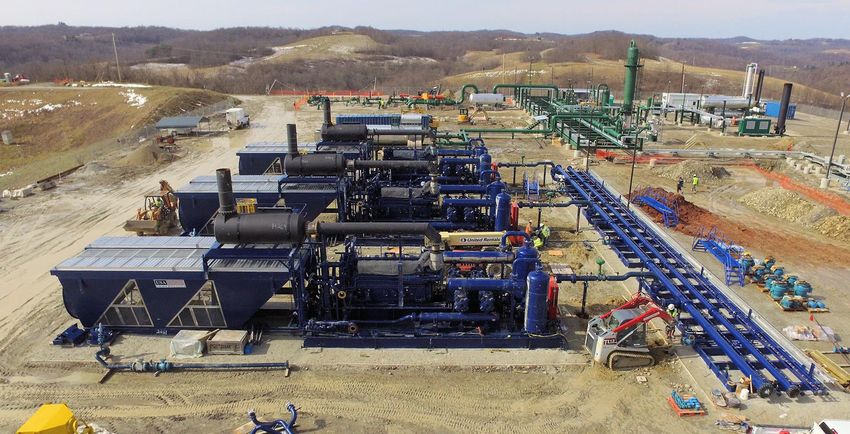
Disclaimer

This presentation contains forward-looking statements relating to the operations of USA Compression Partners, LP (the
“Partnership”) that are based on management’s current expectations, estimates and projections about its operations. You
can identify many of these forward-looking statements by words such as “believe,” “expect,” “intend,” “project,”
“anticipate,” “estimate,” “continue,” “if,” “outlook,” “will,” “could,” “should,” or similar words or the negatives thereof. You
should consider these statements carefully because they discuss our plans, targets, strategies, prospects and expectations
concerning our business, operating results, financial condition, our ability to make distributions and other similar matters.
These statements are not guarantees of future performance and are subject to certain risks, uncertainties and other
factors, some of which are beyond our control and are difficult to predict. These include risks relating to changes in general
economic conditions and changes in economic conditions of the crude oil and natural gas industries specifically, changes in
the long-term supply of and demand for natural gas and crude oil, actions taken by our customers, competitors and third-
party operators, our ability to realize the anticipated benefits of acquisitions, competitive conditions in our industry, the
severity and duration of world health events and the factors set forth under the heading "Risk Factors" or included
elsewhere that are incorporated by reference herein from our Annual Report on Form 10-K for the year ended December
31, 2020 filed with the Securities and Exchange Commission, and if applicable, our Quarterly Reports on Form 10-Q and our
Current Reports on Form 8-K. As a result of such risks and others, our business, financial condition and results of operations
could differ materially from what is expressed or forecasted in such forward-looking statements. Before you invest in our
common units, you should be aware of such risks, and you should not place undue reliance on these forward–looking
statements. Any forward-looking statement made by us in this presentation speaks only as of the date of this presentation.
Unpredictable or unknown factors not discussed herein could also have material adverse effects on forward-looking
statements. We undertake no obligation to update or revise any forward-looking statements, whether as a result of new
information, future events or otherwise.

                                                               1                          © 2022 USA COMPRESSION PARTNERS, LP   | CONFIDENTIAL
Important Note Regarding Non-Predecessor Information
On April 2, 2018, the Partnership consummated the acquisition of CDM Resource Management LLC and CDM
Environmental & Technical Services LLC, which together represent the CDM Compression Business (the “USA Compression
Predecessor”), from Energy Transfer, and other related transactions (collectively, the “Transactions”). Following the
Transactions, the USA Compression Predecessor has been determined to be the historical predecessor of the Partnership
for financial reporting purposes. Therefore, the historical consolidated financial statements of the Partnership are
comprised of the balance sheet and statement of operations of the USA Compression Predecessor as of and for periods
prior to April 2, 2018. The historical consolidated financial statements of the Partnership are also comprised of the
consolidated balance sheet and statement of operations of the Partnership, which includes the USA Compression
Predecessor, as of and for all periods subsequent to April 2, 2018. The information shown in this presentation under the
heading “Pre-CDM Acquisition Non-Predecessor” represents information of USA Compression Partners, LP, which is not
the predecessor of the Partnership for financial reporting purposes, for periods prior to the Transactions and is presented
for illustrative purposes only. Such information does not reflect the Partnership’s historical results of operations and is not
indicative of the results of operations of the Partnership’s predecessor, the USA Compression Predecessor, for such
periods.

                                                               2                          © 2022 USA COMPRESSION PARTNERS, LP   | CONFIDENTIAL
USAC Overview
USAC Overview
Large Horsepower Strategy Critical for Domestic Natural Gas Infrastructure

                                 Business Snapshot                                                                        USAC Market Statistics

■     USAC provides compression services across a                                                       ■   Public since 1/2013 (NYSE: USAC)
      geographically–diversified operating area                                                         ■   Current Unit Price: $17.32
■     23-year history with primary focus on large                                                       ■   Avg. Daily Trading Volume: ~275,000 units
      horsepower (1,000 HP+) applications
                                                                                                        ■   IDRs Eliminated
■     “Southwest Airlines” standardized business
      model
■     Focus areas: Permian/Delaware;                                                                    ($ in billions)
      Marcellus/Utica; Mid-Continent/SCOOP/STACK;
                                                                                                        LP Equity Value                                  $1.7 billion
      S. Texas; E. Texas; Louisiana; Rockies
                                                                                                        Preferred Equity                                   0.5 billion
■     Active Fleet: 2.9mm Horsepower
      –      >70% is greater than 1,000 HP                                                              ABL                                                0.5 billion
■     83% Utilization (1)                                                                               Sr. Notes                                          1.5 billon

                                                                                                         Total Long-Term Debt                              2.0 billion

                                                                                                        Enterprise Value                                  $4.2 billion

Note: Market data as of January 7, 2022. Financial and operational data as of September 30, 2021.
1. As of September 30, 2021.

                                                                                                    4                           © 2022 USA COMPRESSION PARTNERS, LP   | CONFIDENTIAL
Q3 2021 Recap
Stability Has Continued Through Q3
■ Q3 2021 fleet HP of 3.7 million / average revenue generating HP of 2.9 million
■ Q3 2021 average horsepower utilization of ~82%
Operational
Update ■ Q3 Growth Capex: $13.5mm
■ Macro environment continues to be attractive; customer sentiment improving into 2022
■ Q3 showed continued stability; margins remain at attractive levels
– Adjusted EBITDA of $100mm
Financial
Update – Distributable Cash Flow (“DCF”) of $52mm
■ Q3 adjusted gross margin percentage of 69%, Adjusted EBITDA margin of ~63%
■ Common unit distribution of $0.525 for Q3; DCF coverage of 1.02x
■ Ranges narrowed; no change to full-year 2021 Adjusted EBITDA midpoint:
2021 Guidance – Adjusted EBITDA: $390mm – $400mm
– DCF: $200mm – $210mm
Q3 2021 highlighted continued business stabilization; 2022 is expected to be
more active as commodity prices maintain strength and stability
5 © 2022 USA COMPRESSION PARTNERS, LP | CONFIDENTIALUSAC Operates Critical Assets with Positive Fundamentals
Natural Gas Has Proven Itself as a Long-Term Fuel; Compression is Critical!
■ Bullish on demand for natural gas, both in US and globally
Supportive
Macro: Gas Isn’t ■ LNG exports, petchem feedstock and power gen driving continued gas usage
Going Anywhere
■ Natural gas demand/production expected to increase through 2050 (1)
High Quality ■ New vintage, standardized fleet focused on high quality CAT/Ariel machines
Assets in Right ■ Geographic diversity, but significant density where the gas is: Permian/Delaware &
Places with Northeast
Strong Customers
■ Strong counterparties – active customers (major oil & gas, large independent E&Ps,
midstream)
Established ■ Providing large horsepower compression services for >23 years
Company with ■ Performance throughout price cycles; no direct commodity exposure
History of
Stability ■ Stable distribution history: >$1 billion returned since IPO
Compression is a “must-have” part of the natural gas value chain: with natural gas playing a
critical role as a transition fuel to the future will come increasing requirements for compression
1. U.S. Energy Information Administration: Annual Energy Outlook 2021.
6 © 2022 USA COMPRESSION PARTNERS, LP | CONFIDENTIALWhy Focus on Midstream Compression?
Operational / Cash Flow Stability with Strong Counterparties
Wellhead (Gas & Oil) Midstream Downstream
Uses Gas Lift Regional Gathering Interstate Pipelines
Gas Reinjection Central Delivery Point Trunkline Gathering
Processing Plants Gas Storage
Customer Base Broad customer base Typically larger operators Typically owner-operators;
Very large operators,
integrated midstreams
Gas Volumes / Pressures Lower Medium-to-High Higher
Compression Required Small HP Large-to-Extra Large Larger-to-Extra Large
(often turbines)
Stability Dependent on commodity Infrastructure-based; Permanent installations
prices Longer-term
Barriers to Entry/Exit Non-existent; commodity Select group of operators; Integrated with pipeline
service offering costly to install/de-mobilize systems as part of the
jurisdictional rate base
USAC’s focus on midstream applications results in more
stability throughout commodity price cycles
7 © 2022 USA COMPRESSION PARTNERS, LP | CONFIDENTIALUSAC Customer Overview
Top 20 Customers: Diverse Counterparties & Long-Term Relationships
% of Length of % of Length of
Customer Rev(1) relationship Total HP Customer Rev(1) relationship Total HP
Independent Public E&P 9% > 10 Years 298K Private Midstream 2% < 5 Years 25K
Major O&G 5% > 10 Years 149K Large Public MLP 2% > 10 Years 40K
Major O&G 5% > 5 Years 99K Independent Public E&P 2% > 10 Years 51K
Independent Public E&P 4% > 5 Years 114K Independent Public E&P 2% < 5 Years 52K
Midstream Unit of Public Utility 3% > 5 Years 145K Public Midstream 2% > 5 Years 59K
Large Private E&P 3% > 10 Years 98K Independent Public E&P 2% > 10 Years 51K
Private Midstream 3% < 5 Years 106K Private Midstream 2% > 5 Years 53K
Private Midstream 2% > 5 Years 76K Private Midstream 1% < 5 Years 40K
Private Midstream 2% > 5 Years 74K Private E&P 1% > 10 Years 66K
Independent Public E&P 2% > 5 Years 52K Public Diversified Oil & Gas 1% > 10 Years 51K
USAC #1-10 40% 1,211K USAC #11-20 16% 488K
■ USAC standalone has historically had very little bad debt write-offs; in fact, over the last 16 years, USAC
has written off only ~$3.2 million in bad debts
– Equates to 0.08% of total billings (~$4.3 billion) over same period (2)
1. Represents recurring revenues for the 9 months ended September 30, 2021.
2. Following the Transactions, the USA Compression Predecessor has been determined to be the historical predecessor of the Partnership for financial reporting purposes. The information presented above for USAC
represents information of USA Compression Partners, LP, which is not the predecessor of the Partnership, for periods prior to the Transactions and is presented for illustrative purposes only. See Slide 2 for more
detail.
8 © 2022 USA COMPRESSION PARTNERS, LP | CONFIDENTIALBusiness Model Allows for Prudent Capital Spending…..
Historical Balance Between Capital Spending and Cash Flow Stability
■ Large HP focus ideally suited for growth and stability
■ Assets provide growth based on marketplace demands
■ Ability to rein in spending and operate for stable cash flow when market softens
■ Largely agnostic to commodity prices; tied more to overall production of (and demand for) natural gas
Total Fleet Horsepower (000s)
Post-CDM
Pre-CDM Acquisition Non-Predecessor (1) Acquisition (2)
4,000 3,726 3,688
3,597 3,683
Cautious Capital Growth via
3,500
Cautious Capital Methodical Growth Spending / CDM
Spending / Maximize Maximize Cash Acquisition /
3,000
Cash Flow Flow Move to
2,500 post-
Integration
Methodical Growth Stability /
2,000 1,712 1,721 1,800 Capex
1,549
reductions
1,500 1,202
919
1,000 722
543 583 610
385 454
500 256
136 166
0
2003 2004 2005 2006 2007 2008 2009 2010 2011 2012 2013 2014 2015 2016 2017 2018 2019 2020 Q3
2021
1. Following the Transactions, the USA Compression Predecessor has been determined to be the historical predecessor of the Partnership for financial reporting purposes. The information presented above under the
heading “Pre-CDM Acquisition Non-Predecessor” represents information of USA Compression Partners, LP, which is not the predecessor of the Partnership, for periods prior to the Transactions and is presented for
illustrative purposes only. See Slide 2 for more detail.
2. Represents the results of operations of the Partnership, which includes the USA Compression Predecessor, following the Transactions.
9 © 2022 USA COMPRESSION PARTNERS, LP | CONFIDENTIAL…..Leading to Cash Flow and Asset Stability Through Cycles
Post-CDM
Pre-CDM Acquisition Non-Predecessor (1) Acquisition (2)
Horsepower
Utilization degradation similar to past HH Nat Gas
Utilization
cycles, but over shorter timeframe; $ /MMBTU
recent stability
100.0% $14
90.0%
$12
80.0% Horsepower
utilization average:
70.0%
>92% for over a $10
decade $420 $414
$395
60.0%
Stability through $8
cycles $320
50.0%
$6
40.0%
30.0% $4
$154 $147 $156
20.0% $114
$81 $2
$53 $57 $63
10.0% $52 $51
$41
0.0% $0
2007 2008 2009 2010 2011 2012 2013 2014 2015 2016 2017 2018 2019 2020 2021
Utilization Adjusted EBITDA ($mm) HH Natural Gas
Note: “2021” Represents Midpoint of 2021 Adjusted EBITDA guidance.
Source: EIA.
1. Following the Transactions, the USA Compression Predecessor has been determined to be the historical predecessor of the Partnership for financial reporting purposes. The information presented above under the heading “Pre-CDM
Acquisition Non-Predecessor” represents information of USA Compression Partners, LP, which is not the predecessor of the Partnership, for periods prior to the Transactions and is presented for illustrative purposes only. See Slide 2 for more
detail.
2. For 2018, represents the results of operations of the Partnership, which includes the results of operations of the USA Compression Predecessor for the three months ended March 31, 2018 and the results of operations of the Partnership,
which includes the USA Compression Predecessor, for the nine months ended December 31, 2018.
10 © 2022 USA COMPRESSION PARTNERS, LP | CONFIDENTIALDiversification – The “Right” Operating Regions
Dry Gas Areas Have Seen Increased Activity Lately
Rockies = Northeast =
~5% ~25%
Mid-
Continent =
~13%
Permian/
Louisiana /
Delaware Basin =
East TX =
~35%
~6%
Gulf Coast =
~16%
Note: Regional % breakdowns represent active fleet horsepower at September 30, 2021; excludes non-compression equipment.
11 © 2022 USA COMPRESSION PARTNERS, LP | CONFIDENTIALNatural Gas: Not Going Away!
Resilient US Natural Gas Demand in 2020
     2020 Nat Gas Demand Off Slightly from 2019
     ■ Natural gas continues to play an important role in the US & global economy
     ■ Natural gas is a critical fuel for economy: power generation, industrial feedstock and
       residential/commercial demand = 90%+ of usage
     ■ 2020 saw only a modest decrease in demand, in spite of COVID-19 impacts

                    US Natural Gas Consumption (1)                               Consumption of Natural Gas in 2020 (1)

      100.0
                             Y-o-Y decrease of ~2%
       90.0
                                                                                              Other, 9%
       80.0

       70.0

       60.0
                                                                                                                   Electric Power,
       50.0                                                                                                              38%
                                                                                  Res / comm, 26%
       40.0

       30.0

       20.0
                                                                                                Industrial, 27%
       10.0

         0.0
                  2018          2019          2020            2021   2022

                              Natural Gas Consumption (bcf/day)

1.    Source: EIA Short Term Energy Outlook, February 2021.

                                                                            13                 © 2022 USA COMPRESSION PARTNERS, LP   | CONFIDENTIAL
Longer Term Natural Gas Demand Growing
Driven by Industrial Use and LNG Exports
■ Consumption growth between 2020 and 2050 concentrated in exports and industrial use:
– Net exports (primarily LNG) add 4.7 Tcf/year by 2050
• Continued near/record LNG volumes
– Industrial uses add 3.6 Tcf/year by 2050
• Economic growth driving increased industrial output (chemical industry) combined with ample supply
Annual US Natural Gas Consumption by Sector (1)
Tcf
16
~28% growth over 30 years
14 Industrial
12 Electric Power
10
8
Net Exports
6
4 Residential
Commercial
2
Transportation
0
-2
-4
1. EIA Annual Energy Outlook February 2021.
14 © 2022 USA COMPRESSION PARTNERS, LP | CONFIDENTIALNatural Gas Remains Critical to US Electricity Production
Renewables Becoming More Important, But Nat Gas Remains Vital for Electricity
■ More electricity in the US is produced from natural gas than any other fuel
■ Natural gas share projected to decline slightly, but remains critical for US electricity generation
■ Natural gas-fired generators expected to represent 40% of power generation additions through 2050 (2)
US Electricity Generation by Fuel (1)
billion
kilowatthours % of Total Generation
forecast
4,000
2011 2020 2022
3,000
Natural Gas 23% 39% 35%
Coal 44% 20% 22%
2,000
Nuclear 20% 21% 19%
Renewables 4% 12% 16%
1,000
Hydro & other 9% 8% 8%
0
2011 2012 2013 2014 2015 2016 2017 2018 2019 2020 2021 2022
1. Source: EIA Short Term Energy Outlook, February 2021.
2. EIA Annual Energy Outlook February 2021.
15 © 2022 USA COMPRESSION PARTNERS, LP | CONFIDENTIALNatural Gas Production
E&P Activity Pullback in 2020 Expected to Continue to Impact Near-Term Production
■ Following COVID and OPEC actions in Spring 2020, E&P activity curtailment negatively affected gas volumes
– Q2 2020 saw ~5% decline before stabilizing for remainder of the year
– Forward years reflect increases in exports and industrial use
■ After decreasing ~70% off pre-pandemic highs, total US rig count is up >140% from August 2020 lows (1)
– Strong, stable oil prices have resulted in more oil-directed rigs as of late
– Drilling efficiencies and well characteristics expected to allow for continued production without moving back to historical rig count highs
US Natural Gas Withdrawals (2) Domestic Rig Count (1)
mmcf/d
100.0 1,800
95.0 1,600
forecast
90.0 1,400
1,200
85.0
1,000
80.0
800
75.0
600
70.0 400
65.0 200
60.0 0
2018-Q3
2022-Q4
2016-Q1
2016-Q2
2016-Q3
2016-Q4
2017-Q1
2017-Q2
2017-Q3
2017-Q4
2018-Q1
2018-Q2
2018-Q4
2019-Q1
2019-Q2
2019-Q3
2019-Q4
2020-Q1
2020-Q2
2020-Q3
2020-Q4
2021-Q1
2021-Q2
2021-Q3
2021-Q4
2022-Q1
2022-Q2
2022-Q3
1/7/2000 2/28/2003 4/21/2006 6/12/2009 8/3/2012 9/25/2015 11/16/2018 1/7/2022
1. Source: Baker Hughes, through January 7, 2022. Oil Gas
2. Source: EIA Short Term Energy Outlook, February 2021.
16 © 2022 USA COMPRESSION PARTNERS, LP | CONFIDENTIALAppendix
Organizational Chart

                                                                                    Energy Transfer
   Combined, the Energy                                                                 Family
    Transfer family owns
       ~47% of USAC
                                                                                                                       Public
                                                                                                                     Unitholders
                                                            USA Compression GP,
                                                                    LLC
                                                            (our general partner)                     52.7%
                                                                                         39.1%
                                                                                                        LP
                                                                                           LP

                                                                      Non-econ                                                       Preferred
                                                                         GP;
                                                                                                                                    Unitholders
                                                                       8.2% LP
                                                                                                              Preferred
                                                                                                                Units

                                                                                 USA Compression
                                                                                   Partners, LP

Note: Percentages reflect USAC unit count as of January 7, 2022.

                                                                                        18            © 2022 USA COMPRESSION PARTNERS, LP   | CONFIDENTIAL
Large Horsepower Gas Applications Drive Stability
Compression Unit Size Matters
USAC Focus:
Gas Compression Industry: Key Characteristics by Size
Small -
Large X Large XX Large XXX Large Commentary
Medium
Compression More
400 – 1,000 – 1,500 – 2,300 –
Unit 0 – 400 HP horsepower
HP Range 1,000 HP 1,500 HP 2,300 HP 5,000+ HP
needed to
Gas Vol move larger
(MMcf/d)
0.90 3.20 5.0 8.0 13.0
gas volumes
Size (L x W x H,
ft.)
21 x 12 x 11 33 x 19 x 16 38 x 27 x 20 43 x 34 x 20 80 x 17x 28
Increasing size,
transportation
Weight (lbs.) ~40,000 ~85,000 ~185,000 ~250,000+ ~400,000+ &
demobilization
Transportation 2 x 18- 3 x 18- 5 x 18- 8 x 18- costs create
Requirements
1 F350
wheelers wheelers wheelers wheelers significant
De-mobilization ‘barriers to exit’
Costs (cust pays)
< $10K ~$25K ~$60K $100K+ $200K+
Larger units =
Typical Contract 6 months –
Length
1 – 12 mos 2 – 5 years 2 – 5 years 2 – 5 years + longer
2 years
deployment
Note: Used CAT 3306TA ,CAT 3508TALE, CAT 3516BLE, CAT 3606TALE and CAT 3608TALE as representative units for Small - Medium, Large, X Large, XX Large and XXX Large horsepower categories, respectively. Gas
volumes based on 50 psi suction pressure and 1,200 psi discharge pressure.
19 © 2022 USA COMPRESSION PARTNERS, LP | CONFIDENTIALBalancing Distribution Stability and Leverage
Annualized Distributions per Common Unit
Stability in Distribution through the cycle
$2.50
$2.10 $2.10 $2.10 $2.10 $2.10 $2.10 $2.10 $2.10 $2.10 $2.10 $2.10 $2.10
$2.00
$1.50
Q4 2018 Q1 2019 Q2 2019 Q3 2019 Q4 2019 Q1 2020 Q2 2020 Q3 2020 Q4 2020 Q1 2021 Q2 2021 Q3 2021
USAC Historical Leverage(1)
Manageable Leverage for Stability of Business
8.0x
6.0x 5.0x 5.0x
4.8x 5.0x 5.0x
4.5x 4.5x 4.5x 4.4x 4.6x 4.6x
4.3x
4.0x
2.0x
–
Q4 2018 Q1 2019 Q2 2019 Q3 2019 Q4 2019 Q1 2020 Q2 2020 Q3 2020 Q4 2020 Q1 2021 Q2 2021 Q3 2021
1. Historical leverage calculated as total debt divided by annualized quarterly Adjusted EBITDA for the applicable quarter, in accordance with our current Credit Agreement. Actual historical leverage may differ
based on certain adjustments.
20 © 2022 USA COMPRESSION PARTNERS, LP | CONFIDENTIALOperational and Financial Performance
Avg. Revenue Generating HP (000s) Revenue ($MM)
Post-CDM Post-CDM
Pre-CDM Acquisition Non-Predecessor (1) Pre-CDM Acquisition Non-Predecessor (1)
Acquisition (1)(2) Acquisition (1)(2)
4,000
3,279 $800
3,140 $698
$668
2,914
3,000 2,760 $584
$600
$473
2,000
1,409 1,378 1,506
$400
1,201 $271 $266 $280
902 $222
1,000 750
$200 $153
489 517 571 $119
371 456 $91 $95 $92 $99
$70
0 $0
2007 2008 2009 2010 2011 2012 2013 2014 2015 2016 2017 2018 2019 2020 Q3 2007 2008 2009 2010 2011 2012 2013 2014 2015 2016 2017 2018 2019 2020 9 mo
2021 2021
Total Capex ($MM) Adjusted EBITDA ($MM) & Margin Percentage(3)
Post-CDM Post-CDM
Pre-CDM Acquisition Non-Predecessor (1) Acquisition (1)(2) Pre-CDM Acquisition Non-Predecessor (1) Acquisition (1)(2)
$500 $420 $414 100%
$500
$388 $400 80%
$400 $320
$285 $300 60%
$300
$241 $200
$200
$180 $200 40%
$200 $154 $147 $156
$160
$133 $130 $119 $114
$93 $81
$100 $63 $100 $41 $53 $57 $52 $51 $63 20%
$30 $49 $41
$19
$0 $0 0%
2007 2008 2009 2010 2011 2012 2013 2014 2015 2016 2017 2018 2019 2020 9 mo 2007 2008 2009 2010 2011 2012 2013 2014 2015 2016 2017 2018 2019 2020 9mo
Maintenance Other Growth 2021 Adjusted EBITDA (LH) Adjusted EBITDA Margin (RH) 2021
1. Following the Transactions, the USA Compression Predecessor has been determined to be the historical predecessor of the Partnership for financial reporting purposes. The information presented above under the heading “Pre-CDM Acquisition
Non-Predecessor” represents information of USA Compression Partners, LP, which is not the predecessor of the Partnership, for periods prior to the Transactions and is presented for illustrative purposes only. See Slide 2 for more detail.
2. For 2018, represents the results of operations of the Partnership, which includes the results of operations of the USA Compression Predecessor for the three months ended March 31, 2018 and the results of operations of the Partnership, which
includes the USA Compression Predecessor, for the nine months ended December 31, 2018.
3. See "Basis of Presentation; Explanation of Non-GAAP Financial Measures" for information on calculations of Adjusted EBITDA. Adjusted EBITDA Margin Percentage is calculated as a percentage of revenue.
21 © 2022 USA COMPRESSION PARTNERS, LP | CONFIDENTIALMacro Thesis: The “Shift to Shale”
Shale Gas Expected to Continue to be the Primary Source of US Natural Gas
■ Shale Dominance: Production from shale shadows ■ Shale gas is typically produced at lower wellhead
all other sources pressures (0-50 PSIG) in contrast to conventional gas
– 2020 est. ~29 Tcfe of shale / tight gas production wells (100-300 PSIG)
(86% of total); growing to 92% by 2050 ■ Pipeline specifications remain constant – requiring gas
■ Pie Getting Bigger: EIA projecting ~43 Tcfe of total pressure to be increased significantly to move gas into
production by 2050 and through pipelines
■ As a result, to move the same amount of gas requires
Natural Gas Production by Type (1)
significantly more compression
Tcf Shale Production Drives Increasing Compression Requirements (1)
50
43 Tcfe
(HP)
45 350,000
Unconventional
40
Compression Required to Compress 1 Bcf/d of Gas
34 Tcfe 92%
USAC believes 300,000
35
compression needs for
30 86% unconventional basins are 250,000
19 Tcfe
25 Shale / Tight Gas up to 3X those of
200,000
20 conventional supplies
15 150,000
10 Lower 48 Offshore Conventional
100,000
5 Other lower 48 onshore
Other
0 50,000
2004
2014
2000
2002
2006
2008
2010
2012
2016
2018
2020
2022
2024
2026
2028
2030
2032
2034
2036
2038
2040
2042
2044
2046
2048
2050
0
Other Lower 48 offshore other Lower 48 onshore tight/shale gas (PSIG) 500 450 400 350 300 250 200 150 100 50 0
Well Pressure
Source: Ariel Corporation: compressor sizing protocol.
Source: U.S. Energy Information Administration, Annual Energy Outlook 2021. (1) Assumes Discharge Pressure = 1,200 PSIG.
22 © 2022 USA COMPRESSION PARTNERS, LP | CONFIDENTIALCompression Throughout the Value Chain
Midstream Compression Offers Cash Flow & Customer Stability
Lower (Sm. Volumes) Pressure Regime Higher (Lg. Volumes)
Crude Oil Wells
Rate-Base Applications
• Gas Lift Midstream Applications • Interstate Pipeline
• Gas Reinjection • Regional Gathering • Trunkline gathering
• Gas Processing Plant • Underground Gas Storage
Limited Compression
exposure • Central Gathering
for both
USAC & Gas
CDM fields Gas processing To Main
plant compressor
Transmission
Lines and Turbines
Regional gathering
USAC (and legacy CDM) have Storage Field
Natural Gas Wells made the strategic decision
• Wellhead
Compression not to pursue more volatile gas
• Gas Lift / Gas Reinjection wellhead equipment
23 © 2022 USA COMPRESSION PARTNERS, LP | CONFIDENTIALNon-GAAP Reconciliations
24 © 2022 USA COMPRESSION PARTNERS, LP | CONFIDENTIALNon-GAAP Reconciliations
25 © 2022 USA COMPRESSION PARTNERS, LP | CONFIDENTIALNon-GAAP Reconciliations, cont’d.
Notes: Represents the results of operations of the USA Compression Predecessor only for the three months ended March 31, 2018 and the results of operations of the Partnership, which includes the USA Compression
Predecessor, for the nine months ended December 31, 2018. See Slide 2 for more detail.
Following the Transactions, the USA Compression Predecessor has been determined to be the historical predecessor of the Partnership for financial reporting purposes. The information presented above under the
heading “Pre-CDM Acquisition Non-Predecessor” represents information of USA Compression Partners, LP, which is not the predecessor of the Partnership, for periods prior to the Transactions and is presented for
illustrative purposes only. See Slide 2 for more detail.
26 © 2022 USA COMPRESSION PARTNERS, LP | CONFIDENTIALNon-GAAP Reconciliations, cont’d.
27 © 2022 USA COMPRESSION PARTNERS, LP | CONFIDENTIALNon-GAAP Reconciliations, cont’d.
2021 Guidance
Guidance
Net income $5.0 to $15.0 million
Plus: Interest expense, net 130.0 million
Plus: Depreciation and amortization 241.0 million
Plus: Income tax expense 1.0 million
EBITDA $377.0 million to $387.0 million
Plus: Unit-based compensation expense and other 13.0 million
Adjusted EBITDA $390.0 million to $400.0 million
Less: Cash interest expense 120.5 million
Less: Current income tax expense 0.5 million
Less: Maintenance capital expenditures 20.0 million
Less: Distributions on Preferred Units 49.0 million
Distributable Cash Flow $200.0 million to $210.0 million
28 © 2022 USA COMPRESSION PARTNERS, LP | CONFIDENTIALBasis of Presentation; Explanation of Non-GAAP Financial Measures
This presentation includes the non-GAAP financial measures of Adjusted gross margin, Adjusted EBITDA, Distributable Cash Flow and Distributable Cash Flow Coverage Ratio.
EBITDA, a measure not defined under U.S. generally accepted accounting principles (“GAAP”), is defined by USAC as net income (loss) before net interest expense, depreciation and amortization
expense, and income tax expense (benefit). Adjusted EBITDA, which also is a non-GAAP measure, is defined by USAC as EBITDA plus impairment of compression equipment, impairment of goodwill,
interest income on capital lease, unit-based compensation expense (benefit), restructuring/severance charges, management fees, expenses under our operating lease with Caterpillar, certain
transaction expenses, loss (gain) on disposition of assets and other. The Partnership’s management views Adjusted EBITDA as one of its primary tools, to assess: (1) the financial performance of the
Partnership’s assets without regard to the impact of financing methods, capital structure or historical cost basis of the Partnership’s assets; (2) the viability of capital expenditure projects and the overall
rates of return on alternative investment opportunities; (3) the ability of the Partnership’s assets to generate cash sufficient to make debt payments and pay distributions; and (4) the Partnership’s
operating performance as compared to those of other companies in its industry without regard to the impact of financing methods and capital structure. The Partnership believes that Adjusted EBITDA
provides useful information to investors because, when viewed with GAAP results and the accompanying reconciliations, it provides a more complete understanding of the Partnership’s performance
than GAAP results alone. Management also believes that external users of its financial statements benefit from having access to the same financial measures that management uses in evaluating the
results of the Partnership’s business.
Adjusted gross margin, a non-GAAP measure, is defined as revenue less cost of operations, exclusive of depreciation and amortization expense. Management believes that Adjusted gross margin is useful
as a supplemental measure of the Partnership’s operating profitability. Adjusted gross margin is impacted primarily by the pricing trends for service operations and cost of operations, including labor
rates for service technicians, volume and per unit costs for lubricant oils, quantity and pricing of routine preventative maintenance on compression units and property tax rates on compression units.
Distributable Cash Flow, a non-GAAP measure, is defined as net income (loss) plus non-cash interest expense, non-cash income tax expense (benefit), depreciation and amortization expense, unit-based
compensation expense (benefit), impairment of compression equipment, impairment of goodwill, certain transaction expenses, severance charges, loss (gain) on disposition of assets, proceeds from
insurance recovery and other, less distributions on the Partnership’s Series A Preferred Units (“Preferred Units”) and maintenance capital expenditures. The Partnership’s management believes
Distributable Cash Flow is an important measure of operating performance because it allows management, investors and others to compare basic cash flows the Partnership generates (after
distributions on the Partnership’s Preferred Units but prior to any retained cash reserves by the Partnership’s general partner and the effect of the Distribution Reinvestment Plan (“DRIP”)) to the cash
distributions the Partnership expects to pay its common unitholders. See previous slides for Adjusted EBITDA reconciled to net income (loss) and net cash provided by operating activities, and net
income (loss) reconciled to Distributable Cash Flow.
This presentation contains a forward-looking estimate of Adjusted EBITDA and Distributable Cash Flow projected to be generated by the Partnership in its 2021 fiscal year. A forward-looking estimate of
net cash provided by operating activities and reconciliations of the forward-looking estimates of Adjusted EBITDA and Distributable Cash Flow to net cash provided by operating activities are not
provided because the items necessary to estimate net cash provided by operating activities, in particular the change in operating assets and liabilities, are not accessible or estimable at this time. The
Partnership does not anticipate the changes in operating assets and liabilities to be material, but changes in accounts receivable, accounts payable, accrued liabilities and deferred revenue could be
significant, such that the amount of net cash provided by operating activities would vary substantially from the amount of projected Adjusted EBITDA and Distributable Cash Flow.
Adjusted EBITDA, Adjusted gross margin and Distributable Cash Flow should not be considered an alternative to, or more meaningful than, net income (loss), operating income, cash flows from operating
activities or any other measure of financial performance presented in accordance with GAAP as measures of operating performance and liquidity. Moreover, Adjusted EBITDA, Adjusted gross margin and
Distributable Cash Flow as presented may not be comparable to similarly titled measures of other companies because other entities may not calculate such measures in the same manner.
The Partnership believes that external users of its financial statements benefit from having access to the same financial measures that management uses in evaluating the results of the Partnership’s
business.
Distributable Cash Flow Coverage Ratio, a non-GAAP measure, is defined as Distributable Cash Flow divided by distributions declared to common unitholders in respect of such period. We believe
Distributable Cash Flow Coverage Ratio is an important measure of operating performance because it allows management, investors and others to gauge our ability to pay cash distributions to common
unitholders using the cash flows we generate. Our Distributable Cash Flow Coverage Ratio as presented may not be comparable to similarly titled measures of other companies.
29 © 2022 USA COMPRESSION PARTNERS, LP | CONFIDENTIALYou can also read