USAID GRID-SCALE ENERGY STORAGE TECHNOLOGIES PRIMER - www.greeningthegrid.org | www.nrel.gov/usaid-partnership
←
→
Page content transcription
If your browser does not render page correctly, please read the page content below

USAID GRID-SCALE
  ENERGY STORAGE
  TECHNOLOGIES PRIMER

www.greeningthegrid.org | www.nrel.gov/usaid-partnership

USAID GRID-SCALE
  ENERGY STORAGE
  TECHNOLOGIES PRIMER
   Authors
   Thomas Bowen, Ilya Chernyakhovskiy, Kaifeng Xu, Sika Gadzanku, Kamyria Coney
   National Renewable Energy Laboratory

   July 2021

   A companion report to the USAID Energy Storage Decision Guide for Policymakers

www.greeningthegrid.org | www.nrel.gov/usaid-partnership
Prepared by

NOTICE
This work was authored, in part, by the National Renewable Energy Laboratory
(NREL), operated by Alliance for Sustainable Energy, LLC, for the U.S.
Department of Energy (DOE) under Contract No. DE-AC36-08GO28308.
Funding provided by the United States Agency for International Development
(USAID) under Contract No. IAG-17-2050. The views expressed in this report
do not necessarily represent the views of the DOE or the U.S. Government, or
any agency thereof, including USAID.

This report is available at no cost from the National Renewable Energy
Laboratory (NREL) at www.nrel.gov/publications.

U.S. Department of Energy (DOE) reports produced after 1991 and a growing
number of pre-1991 documents are available free via www.OSTI.gov.

                                                  Front cover: photo from iStock 506609532; Back cover: photo from iStock 506611252
                                                                                NREL prints on paper that contains recycled content.
Acknowledgments
       The authors are greatly indebted to several individuals for their support and guidance. We wish to thank
       Dominique Bain, Marcus Bianchi, Nate Blair, Anthony Burrell, Paul Denholm, Greg Stark, and Keith
       Wipke at the National Renewable Energy Laboratory (NREL), and Oliver Schmidt at Imperial College
       London for their reviews. And we wish to thank Isabel McCan, Christopher Schwing, and Liz Breazeale
       for communications, design, and editing support. Any errors or omissions are solely the responsibility of
       the authors.

       This work was funded by USAID.

                                                           v
This report is available at no cost from the National Renewable Energy Laboratory (NREL) at www.nrel.gov/publications.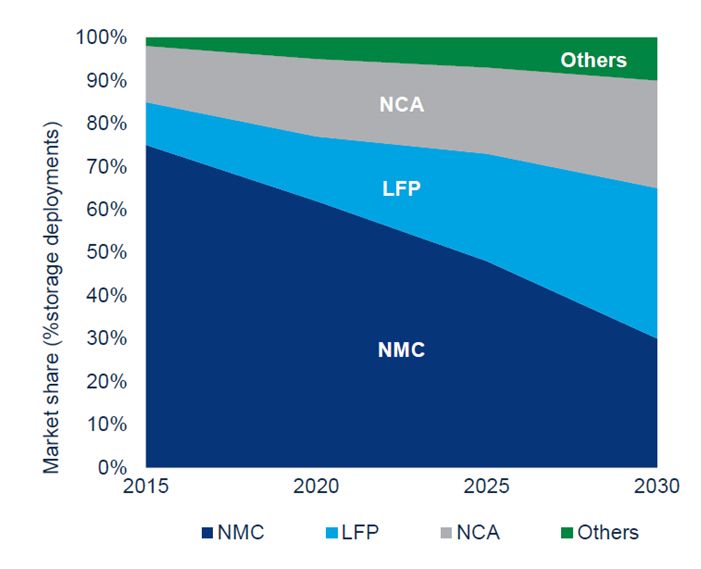
List of Acronyms
       A-CAES                                          adiabatic compressed air energy storage
       CAES                                            compressed air energy storage
       CHP                                             combined heat and power
       CSP                                             concentrated solar power
       D-CAES                                          diabatic compressed air energy storage
       FESS                                            flywheel energy storage systems
       GES                                             gravity energy storage
       GMP                                             Green Mountain Power
       LAES                                            liquid air energy storage
       LADWP                                           Los Angeles Department of Water and Power
       PCM                                             phase change material
       PSH                                             pumped storage hydropower
       R&D                                             research and development
       RFB                                             redox flow battery
       SMES                                            superconducting magnetic energy storage
       TES                                             thermal energy storage
       VRE                                             variable renewable energy

                                                          vi
This report is available at no cost from the National Renewable Energy Laboratory (NREL) at www.nrel.gov/publications.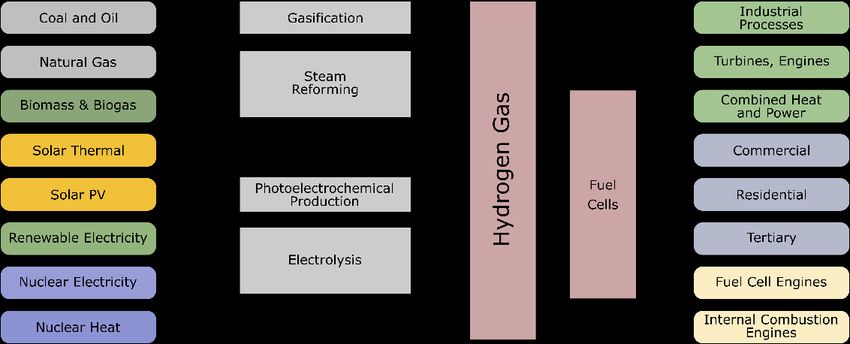
Table of Contents
       1  Introduction .......................................................................................................................................... 1
       2  Electrochemical Energy Storage Technologies .................................................................................. 6
          2.1 Lithium-ion Battery Energy Storage ............................................................................................. 8
          2.2 Flow Battery Energy Storage ...................................................................................................... 12
          2.3 Lead-Acid Battery Energy Storage ............................................................................................. 14
          2.4 Sodium-Sulfur Battery ................................................................................................................ 16
       3 Mechanical Energy Storage Technologies........................................................................................ 18
          3.1 Pumped Storage Hydropower (PSH) .......................................................................................... 19
          3.2 Flywheel Energy Storage ............................................................................................................ 21
          3.3 Compressed Air Energy Storage ................................................................................................. 23
          3.4 Gravity Energy Storage ............................................................................................................... 26
       4 Additional Energy Storage Technologies ......................................................................................... 28
          4.1 Hydrogen Energy Storage Systems ............................................................................................. 29
          4.2 Thermal Energy Storage (TES) ................................................................................................... 34
          4.3 Supercapacitors ........................................................................................................................... 36
          4.4 Superconducting Magnetic Energy Storage (SMES) .................................................................. 37
       Glossary ..................................................................................................................................................... 39
       References .................................................................................................................................................. 40

                                                                                     vii
This report is available at no cost from the National Renewable Energy Laboratory (NREL) at www.nrel.gov/publications.
List of Figures
Figure 1. Ecosystem of energy storage technologies and services ............................................................... 2
Figure 2. U.S. annual new installations of electrochemical energy storage by chemistry ............................ 8
Figure 3: Lithium-ion battery chemistry market share forecast, 2015 – 2030 ............................................ 10
Figure 4. Pathways in the hydrogen economy from feedstock to end application...................................... 32
List of Tables
Table 1. Qualitative Comparison of Energy Storage Technologies .............................................................. 3
Table 2. Comparison of Electrochemical Storage Technologies .................................................................. 6
Table 3. Advantages and Disadvantages of Select Electrochemical Battery Chemistries ............................ 7
Table 4. Operating Characteristics of Select Lithium-Ion Chemistries ........................................................ 9
Table 5. Comparison of Mechanical Storage Technologies ....................................................................... 18
Table 6. Typical Characteristics of Select Flywheel Technologies ............................................................ 21
Table 7. Methods for Producing Hydrogen ................................................................................................ 31
viii
This report is available at no cost from the National Renewable Energy Laboratory (NREL) at www.nrel.gov/publications.1 Introduction
Power systems worldwide are experiencing higher levels of variable renewable energy (VRE) as wind
and solar power plants connect to the grid. This trend is expected to continue as costs for VRE resources
decline and jurisdictions pursue more ambitious power sector transformation strategies with increased
VRE penetrations. 1 Higher penetrations of VRE can drive additional need for power system flexibility in
both short-term essential grid services and longer-term energy shifting and peaking capacity services
(Chernyakhovskiy et al. 2019). Energy storage is one of several sources of power system flexibility that
has gained the attention of power utilities, regulators, policymakers, and the media. 2 Falling costs of
storage technologies, particularly lithium-ion battery energy storage, and improved performance and
safety characteristics have made energy storage a compelling and increasingly cost-effective alternative to
conventional flexibility options such as retrofitting thermal power plants or transmission network
upgrades.
This primer is intended to provide regulators and policymakers with an overview of current and emerging
energy storage technologies for grid-scale electricity sector applications. Transportation sector and other
energy storage applications (e.g., mini- and micro-grids, electric vehicles, distribution network
applications) are not covered in this primer; however, the authors do recognize that these sectors strongly
interact with one another, influencing the costs of energy storage as manufacturing capacity scales up as
well as impacting electricity demand. The storage technologies covered in this primer range from well-
established and commercialized technologies such as pumped storage hydropower (PSH) and lithium-ion
battery energy storage to more novel technologies under research and development (R&D). These
technologies vary considerably in their operational characteristics and technology maturity, which will
have an important impact on the roles they play in the grid. Figure 1 provides an overview of energy
storage technologies and the services they can provide to the power system.
Several key operational characteristics and additional terms for understanding energy storage
technologies and their role on the power system are defined in the Glossary. Table 1 provides several
high-level comparisons between these technologies. Many of these characteristics are expected to change
as R&D for the technologies progresses. Some technology categories, such as lithium-ion or lead-acid
batteries, comprise multiple subtypes that each feature unique operational characteristics; comparisons of
subtypes within technologies are considered in their respective sections.
This report serves as a companion piece to the USAID Energy Storage Decision Guide for Policymakers,
which outlines important considerations for policymakers and electric sector regulators when comparing
energy storage against other means for power system objectives.
1
By power sector transformation, the authors refer to “a process of creating policy, market and regulatory
environments, and establishing operational and planning practices that accelerate investment, innovation and the use
of smart, efficient, resilient and environmentally sound technology options” (IEA 2019). For more information on
such power sector transformations, see Cox et al. (2020).
2
Power system flexibility is defined here as “the ability of a power system to reliably and cost-effectively manage
the variability and uncertainty of demand and supply across all relevant timescales, from ensuring instantaneous
stability of the power system to supporting long-term security of supply” (IEA 2018). For information on and
sources of power system flexibility, see IEA (2018) and IEA (2019).
1
This report is available at no cost from the National Renewable Energy Laboratory (NREL) at www.nrel.gov/publications.Figure 1. Ecosystem of energy storage technologies and services
2
This report is available at no cost from the National Renewable Energy Laboratory (NREL) at www.nrel.gov/publications.Table 1. Qualitative Comparison of Energy Storage Technologies
Source: (Chen et al. 2009; Mongird et al. 2019a; Mongird et al. 2020)
Typical
Development Duration
Stage for of Round-
Reaction
Category Technology Utility-Scale Cost Range Discharge Trip Lifetime
Time
Grid at Max Efficiency 3
Applications Power
Capacity
1,408-1,947
Widely ($/kW) Minutes to a Subsecond
Lithium-ion 86-88% 10 years
commercialized few hours to seconds
352-487 ($/kWh)†
1,995-2,438
Initial ($/kW) Several Subsecond
Flow 65%–70% 15 years
commercialization hours to seconds
Electro- 499-609 ($/kWh)†
Chemical 1,520-1,792
Batteries Widely ($/kW) Minutes to a
Lead-acid Seconds 79-85% 12 years
commercialized few hours
380-448 ($/kWh)†
2,394–5,170
Initial ($/kW) Several
Sodium-sulfur Subsecond 77%–83% 15 years
commercialization 599–1,293 hours
($/kWh)††
Several
1,504-2,422 Seconds to
($/kW) Several
Widely Minutes
PSH hours to 80+%* 40 years
commercialized 150-242 (depends on
days
($/kWh)††† technology
choice)
Compressed
973-1,259 ($/kW) Several
air energy Initial Several
hours to 52%** 30 years
Mechanical storage commercialization 97-126 ($/kWh)††† Minutes
days
(CAES)
1,080-2,880
($/kW) Seconds to
Widely
Flywheels a few Subsecond 86%–96% 20 years
commercialized 4,320-11,520 minutes
($/kWh)††
Insufficient data Several Several Insufficient Insufficient
Gravity R&D stage
hours Minutes data data
Hydrogen 2,793-3,488 Several
Chemical production Pilot stage ($/kW) 279-349 hours to Subsecond 35% 30 years
and fuel cells ($/kWh)†††† months
Thermal 1,700-1,800
Initial ($/kW) Several Several
Thermal energy 90+% 30 years
commercialization hours Minutes
storage 20-60 ($/kWh)
3
As some energy storage technologies rely on converting energy from electricity into another medium, such as heat
in thermal energy storage systems or chemical energy in hydrogen, we use efficiency here to refer to the round-trip
efficiency of storing and releasing electricity (electrons-to-electrons), as opposed to the efficiency of using
electricity to produce heat for heating needs or hydrogen for transportation fuel needs.
3
This report is available at no cost from the National Renewable Energy Laboratory (NREL) at www.nrel.gov/publications.930 ($/kW) Seconds to
Super- 10–15
R&D Stage a few Subsecond 92%
capacitors 74,480 ($/kWh) †† years
minutes
Electrical Superconduct
ing magnetic 200–300 ($/kW)
Initial
energy 1,000–10,000 Seconds Subsecond ~97% 20 years
commercialization
storage ($/kWh)
(SMES)
*: This refers to newer PSH installations and older PSH systems may have efficiencies closer to the 60-75% range.
**: As CAES relies on both electricity to compress air and a fuel (typically natural gas) to expand the air, its efficiency cannot be
readily compared to other storage technologies. The value used in this report represents the ratio of the output of electrical energy to
the combined input of electrical energy for the compressor and the natural gas input for expansion, using the heating value of
natural gas to convert its energy to how much electricity it could have produced (Mongird et al. 2019).
†
This range refers to a 10 MW 4-hour battery in 2020 costs. For lithium-ion, this refers to the NMC chemistry (see Section 2.1 for
additional information on lithium-ion chemistries). See Mongird et. al. (2020) for additional energy storage sizes and durations and
estimates for future years.
††
: This range refers to 2018 costs. See Mongird et. al. (2019) for future years.
†††
This range refers to 1000 MW 10-hour systems. See Mongird et. al. (2020) for additional energy storage sizes and durations and
estimates for future years.
††††
This range refers to 100 MW 10-hour systems. See Mongird et. al. (2020) for additional energy storage sizes and durations and
estimates for future years.
4
This report is available at no cost from the National Renewable Energy Laboratory (NREL) at www.nrel.gov/publications.USAID GRID-SCALE ENERGY STORAGE
TECHNOLOGIES PRIMER
Electrochemical Energy
Storage Technologies
www.greeningthegrid.org | www.nrel.gov/usaid-partnership2 Electrochemical Energy Storage Technologies
Electrochemical storage systems use a series of reversible chemical reactions to store electricity in the
form of chemical energy. Batteries are the most common form of electrochemical storage and have been
deployed in power systems in both front-of-the-meter and behind-the-meter applications, as well as in
electronics and transportation applications. Broadly speaking, batteries tend to have durations lasting up
to several hours and can change output in the subsecond to several minutes range.
Table 2. Comparison of Electrochemical Storage Technologies
Source: (Fan et al. 2020; DNV GL 2016; Kintner-Meyer et al. 2010; Diaz de la Rubia et al. 2015; Mongird et al.
2020)
Round- Energy Power Operating Cycle Life
Reaction
Technology Trip Density Density Temperature (Cycles)**
Time
Efficiency (Wh/kg) (W/kg) (°C)
Subsecond to 210–325* 4,000– -20–65 1,000–2,000*
Lithium-Ion 86-88%
seconds 6,500*
Flow Subsecond 65%–70% 10–50 0.5–2 5–45 12,000–14,000
Lead-Acid Seconds 79-85%% 30–50 30-50 18–45 500–1,000
Sodium-Sulfur Subsecond 77%–83% 150–240 120–160 300–350 ~4,500
*Values may vary across different cell designs, chemistries, and power electronics configurations. For operational
characteristics broken down into common lithium-ion chemistries, see Table 5.
**It should be noted that cycle life is intrinsically related to the behavior and environment of the storage system (e.g.,
some use cases can lead to lower cycle life as it stresses the storage system, and many electrochemical storage
technologies perform worse or suffer shorter cycle life outside their normal operating temperature range).
6
This report is available at no cost from the National Renewable Energy Laboratory (NREL) at www.nrel.gov/publications.Table 3. Advantages and Disadvantages of Select Electrochemical Battery Chemistries
Adapted from (Fan et al. 2020)
Storage Type Advantages Disadvantages
• Relatively high energy and power density • High upfront cost ($/kWh) relative to lead-
• Lower maintenance costs acid (potentially offset by longer lifetimes)
• Rapid charge capability • Poor high-temperature performance
Lithium-Ion • Many chemistries offer design flexibility • Safety considerations, which can increase
costs to mitigate
• Established technology with strong potential
for project bankability. • Currently complex to recycle
• Reliance on scarce materials.
• Long cycle life • Relatively low energy and power density.
Flow (Vanadium-
• High intrinsic safety
Redox)
• Capable of deep discharges.
• Low cost • Limited energy density
• Many different available sizes and designs • Relatively short cycle life
• High recyclability. • Cannot be kept in a discharged state for
long without permanent impact on
Lead-Acid performance
• Deep cycling can impact cycle life
• Poor performance in high temperature
environments.
• Toxicity of components
• Relatively high energy density • High operating temperature necessary
Sodium-Sulfur • Relatively long cycle life • High costs.
• Low self-discharge.
7
This report is available at no cost from the National Renewable Energy Laboratory (NREL) at www.nrel.gov/publications.2.1 Lithium-ion Battery Energy Storage
Technology Summary for Policymakers
Lithium-ion is a mature energy storage technology with established global manufacturing capacity
driven in part by its use in electric vehicle applications. The overlap between the transportation
and power system sectors have enabled steep price declines in technology costs for lithium-ion
batteries, driving higher deployments. In utility-scale power sector applications, lithium-ion has
been used predominantly for short-duration, high-cycling services such as frequency regulation,
although it is increasingly used to provide peaking capacity and energy arbitrage services in
certain jurisdictions. Lithium-ion has a typical duration in the 2- to 4-hour range, with price
competitiveness decreasing at longer durations. One major technical issue with lithium-ion is fire
safety, as the chemistry can suffer thermal runaway leading to fire concerns. Recent battery pack
technology and software innovations are addressing safety concerns related to thermal runaway.
Lithium-ion battery storage currently dominates the landscape for new, utility-scale installations for
electrochemical stationary storage applications and is only surpassed by pumped hydro storage for
cumulative capacity. Since 2010 in the United States, over 90% of annual additions of utility-scale
stationary battery storage in the power sector has been lithium-ion (Figure 2). This trend is driven by
several factors, including robust manufacturing capabilities, well-developed supply chains, increasing
demand in the transportation sector, and a precipitous drop in lithium-ion battery pack prices over the past
several years: lithium-ion battery pack prices declined 89% from 2010 to 2020 (Frith 2020). 4
Figure 2. U.S. annual new installations of electrochemical energy storage by chemistry
Source: (EIA 2019)
As with all battery energy storage technologies, lithium-ion batteries convert chemical energy contained
in its active materials directly into electrical energy through an electrochemical oxidation-reduction
reaction (Warner 2015). Lithium-ion batteries, however, have significantly higher energy densities
relative to other electrochemical storage technologies such as lead-acid and flow batteries, which allows
4
Note that this price decline refers only to battery pack prices, which reflect lithium-ion battery pack hardware costs
and do not include additional hardware components or soft costs that would accumulate when constructing a project.
8
This report is available at no cost from the National Renewable Energy Laboratory (NREL) at www.nrel.gov/publications.the same energy needs to be met with smaller and lighter batteries. Lithium-ion batteries are also able to
charge and discharge thousands of times before reaching the end of the battery pack life.
The primary safety concern surrounding lithium-ion batteries is fire-risks caused by “thermal runaway.”
Thermal runaway refers to a point at which the temperature inside the battery cells becomes hot enough to
cause self-sustaining heat generation, which can quickly lead to battery failure or even fires (Warner
2015). Even though thermal runaway is not unique to lithium-ion, lithium tends to have a lower runaway
temperature, which means thermal management and fire suppression are important factors to consider
when operating lithium-ion batteries, even though they may increase overall project costs. 5
Lithium-ion batteries can consist of various chemistry configurations and each chemistry exhibits slightly
different operating parameters. Table 4 compares the key operating metrics for a few of the common
lithium-ion chemistries (Warner 2015). Although Lithium Nickel Manganese Cobalt (NMC) is currently
the dominate chemistry, competing chemistries Lithium Nickel Cobalt Aluminum (NCA) and Lithium
Iron Phosphate (LFP) are expected to grow in popularity over the next several decades (Figure 3).
Table 4. Operating Characteristics of Select Lithium-Ion Chemistries
Source: (Warner 2019; DNV GL 2016; Mongird et al. 2020)
Energy Power Operating Self-
Cycle
Technology Density Density Temperature Discharge
Life
(Wh/L) (W/L) (°C) (%/month)
Lithium Iron Phosphate 220–250 4,500 -20 to +60 ~2,000 1,000 2%–10%
Lithium Nickel Cobalt Aluminum
5,000
Lithium Nickel Manganese Cobalt 325 6,500 -20 to +55 ~1,200 1%
5
Battery cell degradation that can lead to thermal runaway can begin at temperatures as low as 80°C. At 80°C,
lithium ions begin to react with chemicals in the electrolyte, decomposing layers around the anode in a heat-
generating reaction (exothermic) (Warner 2019).
9
This report is available at no cost from the National Renewable Energy Laboratory (NREL) at www.nrel.gov/publications.Figure 3: Lithium-ion battery chemistry market share forecast, 2015 – 2030
Source: (Wood Mackenzie 2020)
2.1.1 Current Applications
In addition to widespread electric mobility applications and consumer electronics, lithium-ion battery
storage is increasingly used for stationary energy storage applications, both in utility-scale and behind-
the-meter applications. Lithium-ion’s quick response time, long cycle life, and limited duration lend itself
well to shorter-term applications that may require frequent and deep cycling. 6 Currently, lithium-ion is
used in frequency response and other essential grid reliability services that help system operators maintain
balance between load and demand at short timescales (up to a few hours) (Bowen et al. 2019). Lithium-
ion batteries have also seen deployment for providing peaking capacity, charging during times of energy
surplus, and discharging during times of higher demand to help utilities meet peak demand. Due to its
limited duration, lithium-ion’s contribution to system peak demand strongly depends on the shape of the
demand curve (Denholm and Margolis 2018). Similarly, lithium-ion can also be used to reduce grid
congestion and defer transmission and distribution system upgrades by storing energy during times of
excess generation and meeting load locally during times of high demand.
2.1.2 Emerging Applications and R&D Efforts
Future improvements in lithium-ion batteries are primarily focused on increasing energy density,
increasing the power output of lithium-ion cells, making the batteries safer to operate, reducing overall
costs, and reducing reliance on scarce minerals. Two novel configurations currently being explored are
6
“Deep” and “shallow” cycling are used to qualitatively refer to the depth of discharge an energy storage system
experiences during operation. The depth of discharge refers to the share of the storage system’s capacity that has
been discharged and is inversely related to its state of charge. Although there is no set definition, deep cycling may
refer to operations when the storage system discharges the majority of its stored energy (such as while providing
prolonged peaking capacity) whereas shallow cycling refers to operations when the storage system alternates
between charging and discharging such that its state of charge remains relatively high (such as providing frequency
regulation). The depth of discharge can have significant effects on the lifetime of the storage system, and
technologies vary in their sensitivity to the depth of discharge they experience.
10
This report is available at no cost from the National Renewable Energy Laboratory (NREL) at www.nrel.gov/publications.solid-state lithium-ion batteries, which use solid electrolytes and have improved energy densities and
lower safety risks compared to liquid-electrolyte lithium-ion batteries, and lithium-air batteries, which
have improved energy densities and have the potential to be very low cost and could reduce reliance on
scarce minerals (Warner 2019).
2.1.3 Example Deployment
Lithium-ion has seen extensive global deployment in the energy sector. One prominent existing project is
the Hornsdale Power Reserve, a 100-MW/129-MWh lithium-ion battery in South Australia completed in
2017 for frequency regulation and transmission congestion relief. The South Australia power system is
relatively isolated and can disconnect from the larger Australian power system if the point of
interconnection is overloaded. One of the battery’s additional functions is to provide injections of power
to prevent the interconnection from disconnecting. On at least two occasions, during events when large
coal plants tripped offline, the Hornsdale Power Reserve responded within milliseconds to immediately
inject large amounts of power into the grid over a few minutes to support the grid frequency until other
power plants could increase their output, arresting the fall in frequency and potentially avoiding power
reliability issues and disconnection from the larger grid (AEMO 2018).
In 2018, the electric cooperative, United Power, completed the installation of a 4-MW/16-MWh (4-hour
duration) lithium-ion battery in Firestone, Colorado. The cooperative aims to store excess energy
overnight when demand is low and use it to meet peak demand during the day, reducing operating costs
for the utility. The local utility expects to be able to save $1 million per year in avoided wholesale
capacity charges (United Power 2018).
11
This report is available at no cost from the National Renewable Energy Laboratory (NREL) at www.nrel.gov/publications.2.2 Flow Battery Energy Storage
Technology Summary for Policymakers
Flow batteries are in the initial stages of commercialization. The technology is marked by long
durations, the ability to deeply discharge its stored energy without damaging the storage system,
and exceedingly long life cycles. Flow batteries may be uniquely situated for longer duration
services such as load following or peaking capacity. While flow batteries have higher upfront costs
than lithium-ion, their longer life cycle can lead to significantly lower lifetime costs. Flow batteries
are also typically safer and are less reliant on rare materials, depending on the specific chemistry.
Given flow batteries’ low energy and power density, these systems tend to be larger than other
equivalent storage technologies.
Flow battery energy storage is a form of electrochemical energy storage that converts the chemical energy
in electro-active materials, typically stored in liquid-based electrolyte solutions, directly into electrical
energy (Nguyen and Savinell 2010). There are various forms of established flow battery energy storage
technologies, including redox flow batteries (RFBs) and hybrid flow batteries. RFBs, which include
vanadium redox flow and polysulphide bromide flow batteries, have the electro-active material dissolved
in a liquid electrolyte that is stored external to the battery. The battery charges and discharges based on
redox reactions, which are chemical reactions between two electrolyte solutions at different oxidation
states. The electrolytes are typically liquid-based, separated by a membrane, and stored in large tanks.
Hybrid flow batteries, which include zinc-bromine and zinc-cerium flow batteries, have one of their
electro-active components deposited on a solid surface, as opposed to being dissolved in a liquid
electrolyte (Alotto, Guarnieri, and Moro 2014; Nguyen and Savinell 2010).
The global flow battery market is dominated by vanadium RFBs, which is the most studied and
commercialized flow battery type (Minke and Turek 2018; Weber et al. 2018). Zinc-bromine (Zn-Br) and
polysulphide bromide flow batteries have also been widely studied with some initial commercialization
but face technical and economic barriers that have stalled their commercialization. Zn-Br batteries are
relatively low cost and exhibit high energy density, high design flexibility, rapid charge, and high depth
of discharge capabilities, but suffer from low cycle-life, low energy efficiency, and dendrite formation,
which impacts performance. 7 Polysulphide bromides have rapid responses but suffer from expensive
material requirements, limited energy density, relatively low efficiencies (~60%–75%), and cross-
contamination concerns during long-term battery operation. These challenges currently make Zinc-
bromine and polysulphide bromide more expensive and inefficient than the more established vanadium
RFBs (Fan et al. 2020).
In principle, flow batteries have several advantages over other electrochemical storage technologies. As
the active electrolytic material is separated from the reactive electrodes in the battery, RFBs have a much
higher level of safety relative to other electrochemical energy storage technologies. This separation also
means that the energy and power capacity of RFBs are independently scalable and modular, with power
capacity dictated by the surface area of the electrodes and the energy capacity dictated by the size of the
tanks storing the electrolytic material. This flexibility in design means that RFBs can be readily
configured for specific needs and applications. RFBs also have stable and durable performance, as the
battery electrodes do not undergo any physical or chemical change during operation (Nguyen and Savinell
7
Dendrite formation refers to the accumulation of crystals within or on the surface of battery components, which
can impact the operation, reliability, and safety of the overall energy storage system.
12
This report is available at no cost from the National Renewable Energy Laboratory (NREL) at www.nrel.gov/publications.2010). Additional advantages include long cycle life, low fire risk due to low flammability of battery and
electrolyte materials, and easy maintenance relative to other energy storage technologies (Alotto,
Guarnieri, and Moro 2014; Fan et al. 2020). RFBs also exhibit a depth-of-discharge capability of nearly
100%, meaning the battery can discharge almost all of its stored energy without impacting system
performance or damaging the battery.
Relative to other electrochemical energy storage options, RFBs have lower energy and power densities,
and typically involve more space-intensive system infrastructure, which may limit them to large-scale,
stationary applications. RFBs also tend to have lower round-trip efficiencies compared to lithium-ion
batteries (Alotto, Guarnieri, and Moro 2014). The largest impediment to widespread adoption of RFB,
however, is currently its higher costs due in part to a lack of large-scale manufacturing capacity and the
need for pumps, sensors and other power and flow management systems (Nguyen and Savinell 2010).
2.2.1 Current Applications
Flow batteries are primarily deployed in utility-scale applications to provide a range of power quality and
energy management services, including support for grid integration of solar and wind, although total
deployment to date is minimal compared to pumped hydro and lithium-ion battery storage (Alotto,
Guarnieri, and Moro 2014). Vanadium RFBs have been used in a range of applications, including
provision of peak power and end-of-line voltage support, deferral of conventional transmission and
distribution upgrades, and load leveling at substations (Lotspeich 2002; Fan et al. 2020).
2.2.2 Emerging Applications and R&D Efforts
Ongoing R&D for RFBs aims to provide cost-effective longer duration storage for energy shifting, peak
shaving, and backup power applications. Ongoing research is mainly focused on:
• Lowering the costs of existing battery chemistries. For instance, Primus Power aims to reduce the
complexity and balance-of-system costs of zinc-bromine flow batteries by eliminating the need for a
membrane separator and separate electrolyte tanks (Primus Power and ARPA-E 2018).
• Developing newer battery chemistries with fewer raw materials and storage costs. For example,
United Technologies Research Center is currently researching how to develop high-performance flow
batteries using inexpensive reactants such as manganese (United Technologies Research Center and
ARPA-E 2018). Harvard University has also begun developing pilot RFB storage projects using
inexpensive, abundant, precious-metal-free organic materials with the aims of lowering RFB costs
while improving performance (Harvard University and ARPA-E 2016).
2.2.3 Example Deployment or Pilot Project
In California, the utility San Diego Gas & Electric developed a 2-MW/8-MWh vanadium RFB, which
will participate in California’s wholesale power markets as part of a 4-year pilot project. The focus of the
pilot is to test and evaluate the most profitable value streams for flow batteries in the commercial
wholesale market, and its role in grid integration (CAISO 2019). Researchers at NREL are analyzing this
battery’s potential value streams using data from performance in distribution support services and have
found significant potential savings in grid operational costs from peak shaving (due to transformer
upgrade deferral) and energy arbitrage (due to time-shifting energy purchases in the spot market)
(Nagarajan et al. 2018). 8
8
The ability for energy storage to provide multiple services across different timescales, at different times and to
different stakeholders is known as “value-stacking” and can allow energy storage to maximize its economic
potential. In California, regulators helped enable value-stacking by providing rules to utilities seeking to procure
services from energy storage (Bowen et al. 2019; CPUC 2018).
13
This report is available at no cost from the National Renewable Energy Laboratory (NREL) at www.nrel.gov/publications.2.3 Lead-Acid Battery Energy Storage
Technology Summary for Policymakers
Lead-acid energy storage is a mature, widely commercialized technology driven by its applications in
transportation. Lead-acid is marked by low upfront costs relative to newer technologies, including
lithium-ion; however, several characteristics, such as its short cycle life and its inability to remain
uncharged for long periods or to be deeply discharged without permanent damage, have limited its
applications in utility-scale power system applications. Ancillary services that require frequent,
shallow charging and discharging like frequency regulation may be better suited for lead-acid,
compared to less frequent, deeper discharge applications like peak demand reduction. Despite these
limitations, lead-acid is still used in off-grid applications such as in isolated microgrids, particularly
where upfront costs can be a barrier.
Lead-acid battery storage serves both stationary and transportation needs and is widely used in micro-grid
applications (Lockhart et al. 2019). The basic components of a typical rechargeable lead-acid battery
system include a lead dioxide (PbO2) positive electrode, a spongy lead (Pb) negative electrode, an
electrolyte solution made of higher concentration of aqueous sulfuric acid solution (H2SO4(aq)) and
water. There are several subtypes of lead-acid batteries, each with unique advantages and challenges,
including: vented lead-acid, valve-regulated lead-acid, absorbent glass mat, and hybrid systems such as
the “Ultrabattery®.”
Lead-acid technologies have a relatively low upfront capital cost compared to other battery technologies
such as lithium-ion; however, this technology has a comparably low energy density of around 30–50
Wh/kg and a relatively short life span of about 3–6 years (ADB 2018).
2.3.1 Current Applications
As of 2018, 75 MW of lead-acid batteries for grid-connected applications had been deployed worldwide,
which accounts for 2% of energy storage deployment when excluding pumped hydro (Mongird et al.
2019b). Although lead-acid batteries for medium- and large-scale energy storage applications have been
commercially available for decades, the low energy density and short cycle life currently limit the use of
this technology in widespread grid applications. Historically, utility-scale lead-acid batteries have been
used in peak shaving, frequency control, spinning reserve, voltage regulation, and standby power (Parker
2001). Currently, however, most of these grid-scale applications have been overtaken by lithium-ion.
Lead is a toxic metal and exposure can be dangerous for human health. To mitigate this risk, control
measures are required during lead-acid battery production, transportation, operation, and recycling
processes (WHO 2017). For example, the Commission of Environmental Cooperation of North America
has developed technical guidelines on environmentally sound management practices for the recycling of
spent lead-acid batteries (CEC 2016).
2.3.2 Emerging Applications and R&D Efforts
In recent decades, research efforts have focused on improving lead-acid battery performance. Two
developments that have been proposed to increase life cycle are hybrid systems and carbon-modified
system designs (Enos 2015). In general, R&D efforts and funding for lead-acid batteries have historically
been limited due to the technology’s maturity and the storage industry’s focus on new, emerging battery
chemistries; however, with new grid-scale applications available and increasing competition from
alternative chemistries such as lithium-ion, research efforts have increased in recent years. For instance,
14
This report is available at no cost from the National Renewable Energy Laboratory (NREL) at www.nrel.gov/publications.researchers at the University of California, Los Angeles have begun investigating new acid-based
chemistries to extend the lifetimes of traditional lead-acid batteries. Although this research is specifically
focused on transportation applications, such fundamental research could potentially be applied to grid-
scale applications as well (University of California, Los Angeles and ARPA-E 2017).
2.3.3 Example Deployment or Pilot Project
In 2012, East Penn Manufacturing developed a 3-MW Ultrabattery® lead-acid-supercapacitor hybrid
system that can provide frequency regulation and demand management services to the PJM
Interconnection, a wholesale market operator in the United States. When not supplying ancillary services
to the wholesale market, the storage system can provide customer-facing services such as demand
management to the local distribution utility, Met-Ed. The energy storage installation consists of several
containerized units that can be modulated or relocated should local power system conditions change.
During its initial 3 years of operation, the storage system was able to provide ancillary services in the
regulation market 53% of the time and had an average round-trip AC-AC efficiency of 81% (Seasholtz
2015).
In 2015, the Vermont utility Green Mountain Power (GMP) commissioned a 4-MW/3.4-MWh energy
storage system to provide ancillary services in the wholesale market and help integrate a 2.5-MW solar
PV installation. The storage system consists of a 2-MW lithium-ion battery and a 2-MW lead-acid
battery. The storage system is interconnected at the distribution system, and, when not selling services
into the wholesale market, it helps GMP reduce demand charges from the wholesale market by meeting
load locally. The storage system can also help a portion of GMP’s territory “island”, providing backup
power for a nearby designated emergency center. The lithium-ion component is typically used for
providing frequency regulation and smoothing the solar PV system’s output, given its higher efficiency
and cycle life, while both the lead-acid and lithium-ion components are used for peak shaving, with lead-
acid more suitable for longer discharging periods. The project has been able to successfully provide all
planned services with an estimated payback time of 8–10 years; however, GMP has stated that future
projects will likely consist only of lithium-ion batteries (Schoenung et al. 2017).
15
This report is available at no cost from the National Renewable Energy Laboratory (NREL) at www.nrel.gov/publications.2.4 Sodium-Sulfur Battery
Technology Summary for Policymakers
Sodium-sulfur is an energy storage technology in the initial commercialization phase, marked by
high energy density, low levels of self-discharge (which correspond to higher efficiencies), and
relatively long cycle life. These storage systems rely on common, abundant, and cheap materials,
which may help drive down costs relative to storage systems reliant on scare minerals. Despite
these advantages, sodium-sulfur has seen relatively little deployment due to its high operating
temperature requirements (300°–350°C). Given its long duration capability, on the scale of several
hours, and its high cycle life, sodium-sulfur may be well suited for longer duration services such
as peaking capacity and energy arbitrage.
Sodium-sulfur batteries are a type of high-temperature battery that relies on a reversible redox reaction
between molten sodium and sulfur to charge and discharge electricity. This high-temperature battery
utilizes a solid electrolyte operating at 300°C to manage reactions between liquid electrodes and has a fast
response time of around 1 millisecond (Tewari 2015). Sodium-sulfur battery systems are typically
designed to discharge energy at maximum power capacity in the 6–8 hours range. These systems also
have high energy densities, which can make them advantageous for areas with space constraints. In
addition, sodium-sulfur batteries have high reliability and can be easily installed, relocated, and
maintained; however, these batteries operate at high temperatures, which presents certain safety issues
that could limit applications. Several notable safety failures of deployed sodium-sulfur systems, which
caused fires, combined with declining lithium-ion costs, have led to declining deployments.
2.4.1 Current Applications
About 190 MW of sodium-sulfur battery capacity was deployed globally in 2018. Sodium-sulfur battery’s
high energy density make it a desirable technology for long-duration applications such as providing firm
capacity, energy arbitrage, and transmission system upgrade deferral. However, the high operating
temperatures of these systems typically makes them unsuitable for small-scale and behind-the-meter
applications.
2.4.2 Emerging Applications and R&D Efforts
Current R&D efforts focus on reducing the operating temperature of these systems and reducing corrosion
in the battery, which can lead to higher self-discharge rates. Reducing the operating temperature could
lead to a reduction in overall system costs. The intermediate temperature sodium-sulfur battery, an
advanced version of this technology, can be operated between 100°–200°C (Nikiforidis 2019; Lu et al.
2013). Recently, researchers with the University of Wollongong developed nanomaterials for improved
performance of room-temperature sodium-sulfur batteries (Long 2019).
2.4.3 Example Deployment or Pilot Project
In 2015, the Chugoku Electric Power Company installed a hybrid battery system as part of a
demonstration project in the Oki islands in Japan (Energia Economic & Technical Research Institute and
Chogoku Electric Power Company 2016). This project used a 2-MW/0.7-MWh lithium-ion battery in
combination with a 4.2-MW/25.2-MWh sodium-sulfur battery to address fluctuations in energy output
from a large, planned increase in renewable energy capacity in the island system. The hybrid system used
the lithium-ion system to address short-term fluctuations in VRE output and the sodium-sulfur system to
address longer term changes in the VRE output. The addition of the lithium-ion component also helped
reduce auxiliary (heating) and installed costs relative to a stand-alone sodium-sulfur battery system.
16
This report is available at no cost from the National Renewable Energy Laboratory (NREL) at www.nrel.gov/publications.USAID GRID-SCALE ENERGY STORAGE
TECHNOLOGIES PRIMER
Mechanical Energy
Storage Technologies
www.greeningthegrid.org | www.nrel.gov/usaid-partnership3 Mechanical Energy Storage Technologies
Mechanical energy storage systems, which include PSH, compressed air energy storage (CAES),
flywheels, and gravity have historically been the most common category of energy storage around the
world, in particular PSH. These systems either store energy in the kinetic energy of a spinning mass
(flywheels) or by forcing a mass or volume against a potential (e.g., by pumping water uphill in the case
of PSH, or pressurizing a gas in the case of CAES). These systems generate electricity by converting the
kinetic energy back into electricity or by allowing the mass or volume to work in the direction of the
potential (allowing water to flow downhill or gas to expand). Table 5 compares a few of these mechanical
systems along with key operating characteristics.
Table 5. Comparison of Mechanical Storage Technologies
Unique
Reaction Round-Trip
Technology Duration Geographic
Time Efficiency
Requirements
Several Separate
seconds to reservoirs with
Several hours to minutes adequate
PSH 80+%
days (depends on differences in
technology elevation
choice)
Typically requires
unique
Several hours to
CAES Several minutes 52%* impermeable
days
underground
caverns
Seconds to a few None
Flywheels Subsecond 93%–96% (high)
minutes
Gravity Energy Storage None
Several hours Several minutes Insufficient data
(GES)
*: As CAES relies on both electricity to compress air and a fuel (typically natural gas) to expand the air, its
efficiency cannot be readily compared to other storage technologies. The value used in this report represents the
ratio of the output of electrical energy to the combined input of electrical energy for the compressor and the
natural gas input for expansion, using the heating value of natural gas to convert its energy to how much
electricity it could have produced (Mongird et al. 2019).
18
This report is available at no cost from the National Renewable Energy Laboratory (NREL) at www.nrel.gov/publications.3.1 Pumped Storage Hydropower (PSH)
Technology Summary for Policymakers
PSH is the most developed and widely commercialized energy storage technology for power
sector applications globally. PSH is marked by large capacities and long durations that make it
well-suited for services such as load following or energy arbitrage, charging during times of
cheap power and meeting demand during system peaks. Despite its well-developed status, PSH is
limited by its geographic requirements and high upfront capital cost, which may be a strong
barrier to its continued deployment in certain contexts.
PSH facilities are typically large-scale facilities that use water resources at different elevations to store
energy for electricity generation. The basic components of a PSH unit include an upper reservoir, a lower
water reservoir, a penstock or tunnel, a pump/turbine, and a motor/generator. The motor/generator and
pump/turbine are located in a powerhouse that is connected to a local electrical substation.
PSH facilities can have open-loop or closed-loop water systems. An open-loop PSH facility has at least
one reservoir that is continuously connected and replenished with a naturally flowing water source. In
contrast, a closed-loop PSH facility uses two artificially constructed lower reservoirs, and the system must
be periodically replenished with water. In both configurations, the upper reservoir is replenished with
water pumped through the penstock from the lower reservoir. Electricity is generated when water is
released from the upper reservoir, traveling down through the penstock into the powerhouse where the
increased water pressure drives the turbine that powers the generator. Many new proposals tend to use
closed-loop designs because the regulatory oversight and development time is anticipated to be shorter
when not impacting existing natural waterbodies. Regardless, pumped hydropower requires locations
suitable to host these facilities, which may be difficult to find close to where the energy storage is needed
and electrical interconnection is available.
There is about 131 GW of PSH capacity currently in operation worldwide, representing about 97% of
global energy storage capacity. Furthermore, in many jurisdictions, there is already significant
hydropower resources, which could be operated as a flexible resource to reduce the need for other sources
of energy storage or which could potentially be converted or retrofitted to provide PSH capabilities.
Modern PSH facilities have long operational lives of 50–60 years and, while older systems typically had
efficiencies in the range of 60%–75%, newer installations can exceed 80% round trip efficiencies.
Over 70% of PSH plants currently installed in the United States were designed to provide daily energy
shifting with a duration in the range of 4 to 8 hours. One advantage of PSH compared to other storage
technologies is that increasing storage duration (i.e., higher energy capacity) is relatively inexpensive,
assuming favorable topology for the upper reservoir. During periods with low electricity demand and high
energy availability, electricity can be used to pump water to the upper reservoir. When demand for
electricity is highest, water can be released from the upper reservoir to generate electricity. 9 This daily
operational cycle helps reduce the need for peaking generation from more costly and potentially polluting
9
The presence of low cost variable renewable energy can play an important role in how energy storage systems,
including PSH are operated by changing the residual or net load that must be met by system operators. For instance,
high penetrations of solar PV may shift low demand periods from the night to the middle of the day. Denholm and
Margolis (2018) show that as solar PV penetration increases in California, shorter duration energy storage can help
meet peak demand. Increasing penetrations of solar PV have already begun affecting the pumping patterns of PSH
in California, with increasing pumping occurring in the day as more solar PV has been added (Somani et al. 2021).
19
This report is available at no cost from the National Renewable Energy Laboratory (NREL) at www.nrel.gov/publications.peaking resources. PSH plants can also serve as backup capacity in the case of generator and/or
transmission network outages elsewhere on the grid.
3.1.1 Emerging Applications and R&D Efforts
Most PSH facilities installed to date use fixed-speed pump-turbines, meaning that both the pumping and
generating units are designed to operate at a fixed rotational speed. Modern advances in fixed-speed
technologies can improve PSH response time (i.e., faster change from pumping to generating mode) and
operational flexibility, while emerging variable-speed configurations can generate/pump efficiently at
much wider ranges of power output, enabling the facility to provide essential grid reliability services
(DOE 2016).
Ternary PSH is a state-of-the-art design that provides increased operational flexibility. A ternary-PSH
facility combines the motor and generator into a single synchronous unit with the generator, turbine, and
pump rotating in the same direction on a single shaft. A torque converter enables simultaneous operation
of the pump and turbine and fast switching between pumping and generating modes at an estimated rate
of 20–40 MW/second, enabling greater operational flexibility and faster response for reliable grid
management (Corbus et al. 2018).
3.1.2 Example Deployment or Pilot Project
On the Spanish island of El Hierro, which has abundant wind resources and enough wind generating
capacity to meet 100% of the island’s energy needs, a PSH project has been successfully used to store
excess renewable energy to meet demand during periods of wind energy shortfall. In 2019, with the help
of the PSH system, a total of 54% of the island’s annual energy demand was met through renewable
energy. Furthermore, the PSH system was able to fully meet the island’s energy demand for 25 days in a
row, beating its previous 18-day record in 2018. Since its commissioning in 2014, the PSH project has
saved nearly 7,500 tons of diesel fuel and offset more than 24,000 tons of greenhouse gases that would
have otherwise been burned and emitted to balance electricity supply and demand (Gorona del Viento El
Hierro, S.A. 2021).
In the United States, two proposed projects include Goldendale, a 1,200-MW closed-loop project on the
Washington/Oregon border, and Banner Mountain, a 400-MW closed-loop project in Wyoming. Both
projects are interested in providing multiple services to a wide array of potential customers, making them
distinct from previous PSH projects that were owned by, deployed by, and served a single vertically
integrated utility. The Goldendale project will use conventional pumps while the Banner Mountain project
plans to use ternary pumps (DOE 2018b).
20
This report is available at no cost from the National Renewable Energy Laboratory (NREL) at www.nrel.gov/publications.3.2 Flywheel Energy Storage
Technology Summary for Policymakers
Flywheels are an established, widely commercialized energy storage technology, primarily used in
smaller-scale applications relative to other mechanical energy storage technologies like PSH or
CAES. Flywheels are characterized by rapid charging and discharging capabilities, relatively little
maintenance, long lifetimes, and short discharge durations. These systems are practical for
maintaining power quality in uninterruptible power supply applications and for short duration
services like grid frequency regulation. While costs are comparable to other technologies on a
power basis ($/kW), on an energy basis ($/kWh), flywheels are significantly more expensive than
comparable alternatives like batteries, which has limited their deployment outside specific
applications.
Flywheel technology is a mechanical device that is used to convert electricity to and from rotational
kinetic energy. Flywheel energy storage systems (FESS) consist of three main elements: a motor-
generator, low-friction bearings, and a rotor (also known as a flywheel). The motor-generator uses
electricity to accelerate the rotor to high speeds in a low-friction environment, storing kinetic energy.
When needed, the stored kinetic energy is converted back to electricity through deacceleration. Compared
to other energy storage mediums such as lithium-ion and lead-acid batteries, flywheels rely significantly
less on corrosive or toxic materials. Flywheels exhibit very long lifetimes and require relatively little
maintenance compared to other mechanical energy storage technologies. Table 6 describes a few key
operational characteristics for three main categories of flywheel storage.
Table 6. Typical Characteristics of Select Flywheel Technologies
Adapted from (Wicki and Hansen 2017)
Characteristics Low-Speed Flywheel High-Speed Flywheel Micro High-Speed
Operating Speed 10,000 rpm >10,000 rpm
Rotor Composition Steel Carbon fiber composite Carbon fiber composite
Bearings Rolling- Magnetic (low friction) Rolling-
element/mechanical ball element/mechanical ball
Typical Specific Energy ~5 Wh/kg Up to 100 Wh/kg ~10 Wh/kg
Lifetime 20 years 20 years 20 years
3.2.1 Current Applications
Flywheels can provide a range of grid stability support services, such as frequency regulation, as this
technology can provide high power for short durations and quick responses during charge-discharge
cycles (Wicki and Hansen 2017; Amiryar and Pullen 2017). Flywheels can also be used for maintaining
power quality by quickly absorbing or injecting power to maintain nominal voltage and frequency levels
(Arani, Zaker, and Gharehpetian 2017). At smaller scales, FESS has been used in uninterruptible power
supply applications in sensitive industries like health care, semiconductor manufacturing, and data
centers. The FESS rapidly responds to loss of power from the grid until slower, longer lasting resources
like diesel generators can come online.
21
This report is available at no cost from the National Renewable Energy Laboratory (NREL) at www.nrel.gov/publications.You can also read