Using deep learning to predict temporomandibular joint disc perforation based on magnetic resonance imaging
←
→
Page content transcription
If your browser does not render page correctly, please read the page content below
www.nature.com/scientificreports
OPEN Using deep learning to predict
temporomandibular joint disc
perforation based on magnetic
resonance imaging
Jae‑Young Kim1,6, Dongwook Kim2,6, Kug Jin Jeon3, Hwiyoung Kim4 & Jong‑Ki Huh5*
The goal of this study was to develop a deep learning-based algorithm to predict temporomandibular
joint (TMJ) disc perforation based on the findings of magnetic resonance imaging (MRI) and to
validate its performance through comparison with previously reported results. The study objects were
obtained by reviewing medical records from January 2005 to June 2018. 299 joints from 289 patients
were divided into perforated and non-perforated groups based on the existence of disc perforation
confirmed during surgery. Experienced observers interpreted the TMJ MRI images to extract
features. Data containing those features were applied to build and validate prediction models using
random forest and multilayer perceptron (MLP) techniques, the latter using the Keras framework, a
recent deep learning architecture. The area under the receiver operating characteristic (ROC) curve
(AUC) was used to compare the performances of the models. MLP produced the best performance
(AUC 0.940), followed by random forest (AUC 0.918) and disc shape alone (AUC 0.791). The MLP and
random forest were also superior to previously reported results using MRI (AUC 0.808) and MRI-based
nomogram (AUC 0.889). Implementing deep learning showed superior performance in predicting disc
perforation in TMJ compared to conventional methods and previous reports.
Disc perforation occurs in the late stage of temporomandibular joint (TMJ) disease. It may affect treatment
planning and can be useful in predicting the prognosis of the disease1–3. Magnetic resonance imaging (MRI) is
considered the gold standard for examination of disc of T MJs2,4. However, results among several reports predict-
ing disc perforation based on MRI vary and the diagnostic accuracy of MRI in detecting TMJ disc perforation
is known to be poor2,3,5–7.
Artificial intelligence (AI) technology is beginning to affect our daily lives, the field of medicine not excepted.
Indeed, the number of articles applying machine learning to medical research has been growing rapidly in recent
years8,9. Several studies have been also conducted to evaluate the diagnosis and prognosis in the field of oral and
maxillofacial surgery. Zhang et al. reported a model that predicts postoperative facial swelling after third molar
extraction with 98% accuracy using an artificial neural network10. Kim et al. also applied machine learning
technique to predict the occurrence of bisphosphonate related-osteonecrosis of the j aw11.
In addition, deep learning, a class of machine learning, is increasingly being applied in the field of diagnosis
and prediction related to medical imaging, yielding impressive results12. Yang et al. reported favorable result for
automated detection of cyst and tumor of the jaw in panoramic i mages13. Lee et al. reported that cephalometric
images can be applied for differential diagnosis of orthognathic surgery and orthodontic treatment based on
deep convolutional neural networks with 95.4 ~ 96.4% success rate14. More recently, there are many attempts for
diagnosis of osteoarthritis of the temporomandibular joint based on cone-beam computed tomographic image
using machine l earning15,16.
Although deep learning based on medical imaging has had a monumental impact, processing a stack of MRI
slices rather than a single image such as a fundus photograph requires considerable effort as well as significant
1
Department of Oral and Maxillofacial Surgery, Gangnam Severance Hospital, Yonsei University College of
Dentistry, Seoul, Republic of Korea. 2Department of Oral and Maxillofacial Surgery, Yonsei University College of
Dentistry, Seoul, Republic of Korea. 3Department of Oral and Maxillofacial Radiology, Yonsei University College of
Dentistry, Seoul, Republic of Korea. 4Department of Radiological Science, Yonsei University College of Medicine,
Seoul, Republic of Korea. 5Department of Oral and Maxillofacial Surgery, Gangnam Severance Hospital, Yonsei
University College of Dentistry, 211 Eonju‑ro, Gangnam‑gu, Seoul 06273, Republic of Korea. 6These authors
contributed equally: Jae-Young Kim and Dongwook Kim. *email: OMSHUH@yuhs.ac
Scientific Reports | (2021) 11:6680 | https://doi.org/10.1038/s41598-021-86115-3 1
Vol.:(0123456789)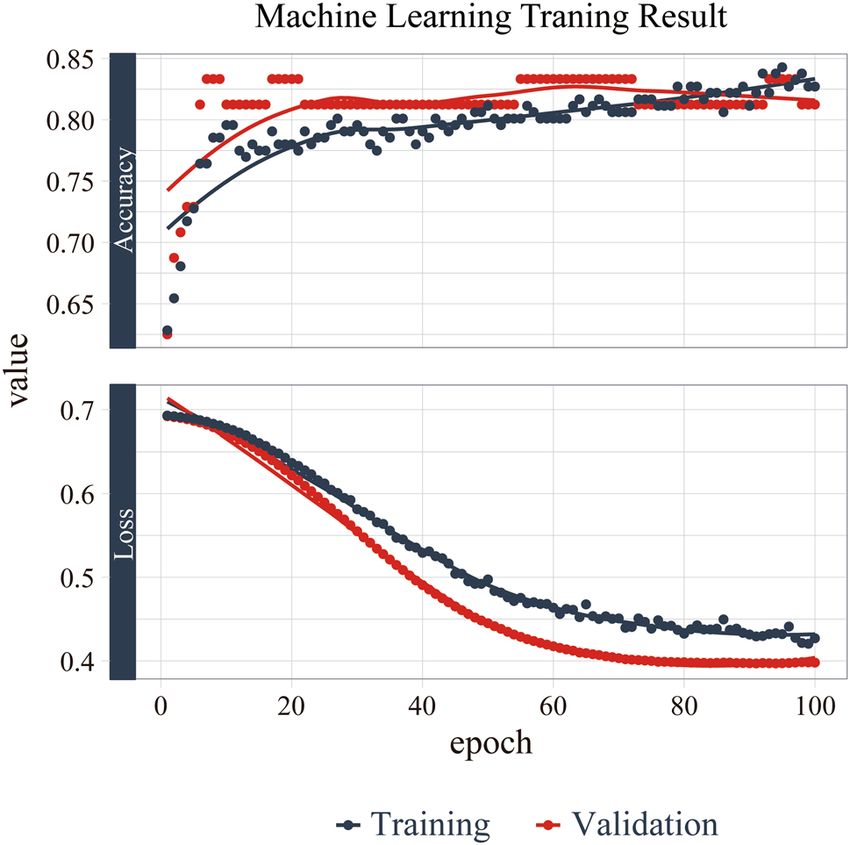
www.nature.com/scientificreports/
Non perforated group Perforated group p-value
Number of joints N = 168 N = 131
Age (year)*** < 0.001
Median [IQR] 27.0 [22.0; 33.0] 32.0 [26.5; 44.5]
Gender* 0.029
Male 30 (17.9%) 10 (8.4%)
Female 138 (82.1%) 120 (91.6%)
Shape of the disc*** < 0.001
Biconcave 30 (17.9%) 1 (0.8%)
Folded 46 (27.4%) 7 (5.3%)
Flattened 34 (20.2%) 17 (13.0%)
Eyeglass-shaped 40 (23.8%) 35 (26.7%)
Amorphous 18 (10.7%) 71 (54.2%)
Signal intensity of bone marrow*** < 0.001
Normal 152 (90.5%) 87 (66.4%)
Low 16 (9.5%) 44 (33.6%)
Fluid collection 0.178
Grade 0 82 (48.8%) 54 (41.2%)
Grade 1 58 (34.5%) 52 (39.7%)
Grade 2 24 (14.3%) 18 (13.7%)
Grade 3 4 (2.4%) 7 (5.3%)
Disc displacement*** < 0.001
Normal + ADcR 51 (30.4%) 7 (5.3%)
Early ADsR 56 (33.3%) 31 (23.7%)
Late ADsR 61 (36.3%) 93 (71.0%)
Joint space*** < 0.001
Normal 38 (22.6%) 7 (5.3%)
Narrowing 125 (74.4%) 91 (69.5%)
Bone to bone contact (close) 3 (1.8%) 12 (9.2%)
Bone to bone contact (open) 2 (1.2%) 21 (16.0%)
Changes of condyle and fossa*** < 0.001
2 or less features 149 (88.7%) 72 (55.4%)
2 or more features 19 (11.3%) 58 (44.6%)
Table 1. Characteristics of study objects. IQR Interquartile range, ADcR anterior displacement with reduction,
ADsR anterior displacement without reduction. *p < 0.05, **p < 0.01, ***p < 0.001.
computational resources in terms of memory and processing speed17–19. Moreover, despite the ability of deep
learning to extract features directly from data, predictions made solely by machines are limited in terms of
accuracy and reliability; moreover, they raise legal, ethical, and psychosocial i ssues8,9,12.
Thus in this study, experienced observers interpreted the TMJ MRI images to extract data on specific features
for use in building machine learning-based prediction models. The goal of this study was to construct machine
learning models to predict TMJ disc perforation based on experienced investigators’ MRI readings and the vali-
date the performance of the models. Random forest and multilayer perceptron (MLP), a class of deep learning
method, were used. There have been to our knowledge no published studies applying deep learning or machine
learning to TMJ disc perforation.
Results
A total of 299 temporomandibular joints from 289 patients involved in this study. The characteristics of the study
objects are shown in Table 1. In univariate analysis, there was significant difference statistically in all parameters
except fluid collection between non-perforated and perforated group. A multiple logistic regression analysis was
performed with parameters showing significance in the univariate analysis (Table 2). The factors significant in
multivariable analysis were increased age, disc shape (eyeglasses or amorphous), low signal intensity of bone
marrow in MRI, joint space, and changes in the condyle and fossa, consistent with a previous study5. Female
patients were approximately twofold more likely to have disc perforation than male patients. When disc shape
was amorphous, the possibility of disc perforation was increased almost 45-fold compared to normal disc shape.
The machine learning models were built based on the above results. The training progress is shown by plot-
ting the loss of each iteration in Fig. 1. Statistically significant factors from the above analyses were considered
when constructing the random forest and MLP models. MLP produced the highest performance (AUC 0.940),
Scientific Reports | (2021) 11:6680 | https://doi.org/10.1038/s41598-021-86115-3 2
Vol:.(1234567890)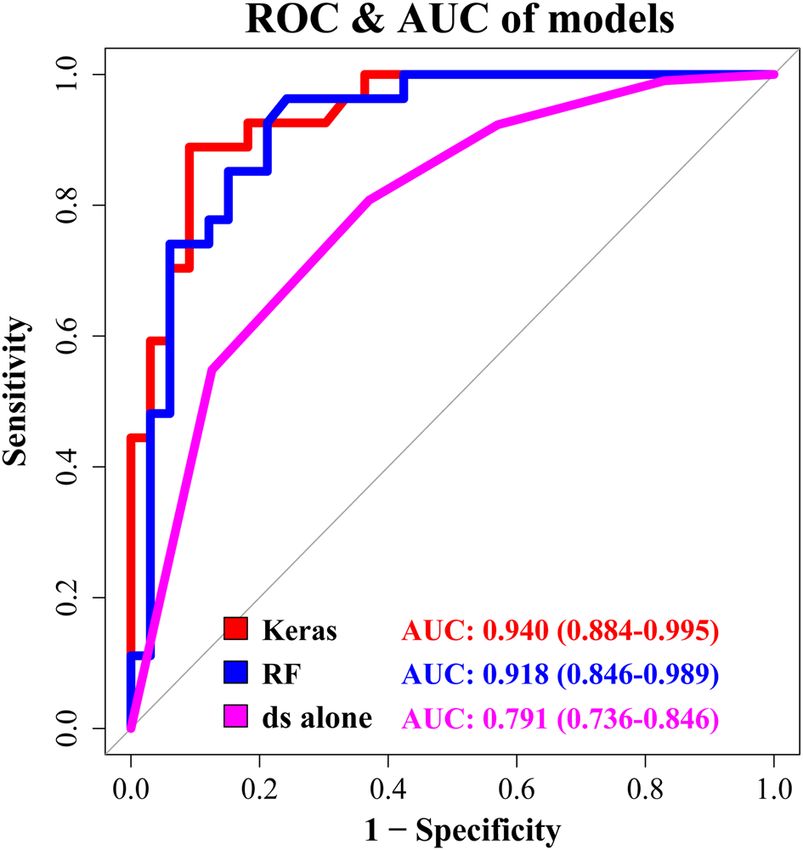
www.nature.com/scientificreports/
Univariate Multiple
Variables OR (95% CI) p-value OR (95% CI) p-value
Age 1.06 (1.04–1.09) 0.000*** 1.05 (1.02–1.09) 0.002**
Sex
Male 1 1
Female 2.37 (1.17–5.14) 0.021* 2.04 (0.76–5.83) 0.276
Shape of the disc
Biconcave 1 1
Folded 4.57 (0.76–87.59) 0.165 1.12 (0.13–24.74) 0.892
Flattened 15.00 (2.82–278.31) 0.011* 6.27 (0.98–123.82) 0.075
Eyeglasses-shaped 26.25 (5.19–479.44) 0.002** 11.72 (1.55–251.4) 0.040*
Amorphous 118.33 (22.97–2178.49) 0.000*** 44.92 (5.84–975.71) 0.002**
Signal intensity of bone marrow
Normal 1 1
Low 4.80 (2.61–9.25) 0.000*** 3.47 (1.48–8.56) 0.005**
Fluid collection
G0 1
G1 1.36 (0.82–2.27) 0.234
G2 1.14 (0.56–2.29) 0.716
G3 2.66 (0.76—10.55) 0.133
Disc displacement
Normal + ADcR 1
Early ADsR 4.03 (1.71–10.69) 0.002** 1.45 (0.45–4.93) 0.367
Late ADsR 11.11 (5.01–28.28) 0.000*** 0.94 (0.25–3.63) 0.898
Joint space
Normal 1 1
Narrowing 3.95 (1.79–10.02) 0.002** 3.21 (1.09–10.74) 0.066
Bone to bone contact (close) 21.71 (5.39–115.90) 0.000*** 9.19 (1.51–70.15) 0.047*
Bone to bone contact (open) 57 (13.09–413.06) 0.000*** 45.4 (6.53–497.03) 0.000***
Changes of condyle and fossa
2 or less 1 1
2 or more 6.23 (3.51–11.47) 0.000*** 3.79 (1.75–8.58) 0.002**
Table 2. Univariate and multiple logistic regression analyses. ADcR anterior displacement with reduction,
ADsR anterior displacement without reduction. *p < 0.05, **p < 0.01, ***p < 0.001.
followed by random forest (AUC 0.918) and disc shape alone (AUC 0.791). (Fig. 2, Table 3). The AUC of MLP
and random forest outperformed previous reports. (AUC 0.8083, AUC 0.8895).
The random forest model does yield the importance of the variables in each model, as shown in Fig. 3. Accord-
ing to the result of our model, shape of the disc appeared to have the most impact among the variables which
were significant in multiple logistic analysis.
The sensitivity and specificity of each model at its optimal cutoff is also investigated. MLP model showed
85.2% of sensitivity and 84.8% of specificity. Random forest model showed 96.3% of sensitivity and 75.8% of
specificity. They are summarized in Table 4.
Discussion
Presence of temporomandibular disc perforation does not necessarily mean the patient needs surgical interven-
tion. However, identification of TMJ disc perforation may affect treatment planning since it can be seen in the
late stage of TMJ arthrosis and the stage of internal derangement affects treatment planning2.
Although MRI is widely considered the gold standard in evaluating TMJ, clear criteria for diagnosing TMJ
disc perforation have not yet been proposed3,5,7. The diagnostic value of MRI for identifying the presence of a
perforated disc is reported to be limited, only a handful of reports having assessed it with ROC c urves2–4.
Previously, Shen et al. reported an AUC of 0.808 (95% CI 0.77–0.85) by diagnosing TMJ perforation with
MRI3. One thing to consider is that this study included 2524 joints, but only 207 joints were perforated. This
imbalance between the numbers of cases and controls allows high diagnostic accuracy, exceeding 90%, despite the
sensitivity being as low as 0%. In other words, if there are only 10 perforated joints among 100 joints, diagnostic
accuracy of 90% is easily achieved by simply diagnosing every joint as non-perforated, while none of the perfo-
rated joints are diagnosed correctly. The study still has significance in that it is the first report assessing efficacy
of MRI-based diagnosis of TMJ disc perforation based on ROC curve rather than only sensitivity and specificity.
The ROC curve is an efficient method for assessing a diagnostic test as it visualizes all possible combinations of
true positive rates and false positive rates.
Scientific Reports | (2021) 11:6680 | https://doi.org/10.1038/s41598-021-86115-3 3
Vol.:(0123456789)www.nature.com/scientificreports/
Figure 1. Training and validation curves. The training progress is shown by plotting the loss of each iteration.
The accuracy of the validation set is also plotted together for every epoch.
Figure 2. ROC and AUC of machine learning methods. MLP performed best (AUC 0.940), followed by
random forest (AUC 0.918) and disc shape alone (AUC 0.630). MLP multilayer perceptron, RF random forest,
ds shape of the disc.
Random forest (p-value) Disc space alone (p-value)
MLP 0.344 < 0.01*
Random forest < 0.01*
Table 3. Statistical significance of the difference between the areas under ROC curves. DeLong’s test and
Bootstrap test were used. MLP multilayer perceptron.
Scientific Reports | (2021) 11:6680 | https://doi.org/10.1038/s41598-021-86115-3 4
Vol:.(1234567890)www.nature.com/scientificreports/
Figure 3. Plot showing importance of the variables in the random forest model. The importance is determined
by the amount of reduction in uncertainty caused by arranging a variable in the tree structure. If a variable
causes a large reduction in uncertainty, it occurs high up in the classification hierarchy and should thus be
considered important.
Model Sensitivity Specificity Cutoff point of probability
MLP 85.2% 84.8% 0.508
Random forest 96.3% 75.8% 0.196
Disc shape alone 80.8% 63.0% 0.307
Table 4. Sensitivity and specificity of each model at optimal cutoff point. Optimal cutoff was considered the
point maximizing the sum of sensitivity and specificity. MLP multilayer perceptron.
A previous study which constructed a nomogram based on MRI findings reported the AUC to be 0.889
(95% CI 0.804–0.973)5. In this study, the best performing deep learning model showed an AUC of 0.940 (95%
CI 0.884–0.995). This is the highest result reported, despite being validated with mutually exclusive datasets
from the training set.
Deep learning is yielding quantum leaps in a wide range of technologies affecting our lives. Face recogni-
tion, voice-to-text, personal assistants, and natural language understanding have become commonplace, and
self-driving cars are on the horizon. The field of medicine is no exception: as the number of healthcare startups
using artificial intelligence is increasing, so are markets involving this technology rapidly emerging. Across the
board, medical imagery will likely constitute a primary input for practical applications using AI in healthcare.
Classic data-driven approaches in radiology depend on features seen as important from a human radiologist’s
point of view, such as density, heterogeneity of tumors, shape, etc20. Convolutional neural network (CNN), a class
of deep learning, automatically discovers the best features for a given task without requiring human-mediated
feature selection12,20. CNN reaches or sometimes exceeds human performance in specific tasks.
While this study implemented a deep learning approach to construct a TMJ disc perforation detection model,
feature selection and assessment were done by doctors and not by computer. A large amount of data is required
for a well-performing CNN, which automates the feature selection process. Machine learning will only get better
over time as data sets increase in size and computing power g rows21. Given the small amount of available data,
deep learning with human-crafted features performs b etter20. Moreover, it does not require extensive computing
power as well. Also, it has been noted that even minor changes to the input data, often invisible to human eye,
can result in dramatically different c lassifications20,22. Human verification is thus still required.
The “black box” nature of AI-based diagnosis, meaning the inability to identify the reason for each decision, is
another limitation9. Doctors will rarely follow the advice of a machine if they cannot see the reasoning underlying
that advice, especially when the responsibility for the patient remains with the clinicians9,23. There are ongoing
studies on this, some of them achieving a measure of interpretability. However, though not fully interpretable,
the random forest model does yield the importance of the variables in each model, as shown in Fig. 3.
In this study, temporomandibular disc perforation was confirmed by surgeon during open TMJ surgery. In
some cases, however, the perforation was not identified according to the size or location of disc perforation, which
is a limitation of this study. It is thought that the most optimal condition is to interpret and analyze all images
by AI technique, if disc perforation can be diagnosed more completely through image. Recently, Chauhari et al.
reported that super-resolution magnetic resonance images were created by deep learning and the images can
Scientific Reports | (2021) 11:6680 | https://doi.org/10.1038/s41598-021-86115-3 5
Vol.:(0123456789)www.nature.com/scientificreports/
iagnosis24. With the advancement of AI technology and the development of image technology, it is
be used for d
expected that image interpretation and prediction of AI alone in the future.
Machine learning approaches are increasingly finding application in the field of medicine and will benefit
patients whose doctors have learned to implement them. The history of medicine is replete with cases in which
new techniques have been adopted by a few with notable success and then become widespread. To aid readers
wishing to try out this new technology, we are sharing the R code used in this study as an attachment (Sup-
plementary Data).
Methods
Patients. 443 patients received open TMJ surgery between January 2005 and January 2018 at the Depart-
ment of Oral and Maxillofacial Surgery, Gangnam Severance Hospital, Yonsei University. The following criteria
were excluded: diagnosed tumors such as osteochondroma and synovial chondromatosis; a congenital deformity
such as hemifacial microsomia or hemifacial hyperplasia; the absence or inadequate quality of TMJ MRI; and
prior total TMJ replacement or arthroplasty.
This retrospective study was approved by the Institutional Review Board of Gangnam Severance Hospital
(No. #3-2018-0129) and complied with the tenets of the Declaration of Helsinki. Written or verbal informed
consent was not obtained from any participants because the IRB of Gangnam Severance Hospital waived the
need for individual informed consent, as this study had a non-interventional retrospective design and all data
were analyzed anonymously.
Following this selection process, 299 joints from 289 patients remained. These were divided into two groups,
perforation and non-perforation, based on the existence of disc perforation identified during surgery. The char-
acteristics of the study objects are shown in Table 1.
Statistical analyses. Comparison of parameters between groups in Table 1 were assessed using the chi
square test, Fisher’s exact test, and the Cochran-Armitage trend test for categorical variables. The Mann–Whit-
ney rank sum test was used for continuous variables. Statistical analyses were performed using the R program-
ming language (R Core Team, Vienna, Austria, 2018).
Magnetic resonance imaging. MRI was acquired on a 3.0-T Magnetom scanner (Achieva, Philips Medi-
cal, Best, The Netherlands) with 3-inch surface coils for the TMJs. For T1-weighted imaging, the following
parameters were used: repetition time, 450 ms; echo time, 20 ms; slice thickness, 3 mm; field of view, 120 mm;
and acquisition matrix size, 240 × 240. The parameters for T2-weighted imaging were as follows: repetition time,
2,900 ms; and echo time, 90 ms. Sagittal plane MRI was analyzed by two oral and maxillofacial surgeons and
an oral and maxillofacial radiologist with reference to previous s tudies3,5,7,25. All observers were experienced in
TMJ MRI interpretation. Images were interpreted at the same time and a final decision was made by consensus.
Disc shapes, bone marrow signal, relationship between the disc and condyle, joint space, and changes of con-
dyle and fossa were investigated. More detailed information and figures of each parameter have been described
in a previous r eport5. The data derived from these features were used to build a prediction model.
Disc shapes. “Biconcave” refers to the normal disc structure and position. “Folded” describes discs with
either a cap- or cup-shaped (∩ -or ∪ -shaped) configuration. A “flattened” disc has a loss of the voluminous
configuration of the anterior band, posterior band, or both. A disc shortened antero-posteriorly resembles a
pair of eyeglasses and was named as such. A deformed disc without a distinguishing configuration was classified
as “amorphous.” A disc falling into more than 2 of the above categories was classified into the more deformed
category.
Signal intensity of the bone marrow. Signal intensity of the bone marrow was assessed based on
T1-weighted images. When the signal intensity of the condyle was lower than that of the ramus or body of the
mandible, it was considered a low bone marrow signal; otherwise it was considered normal.
Fluid collection. Fluid collection was considered present if high signal intensity was observed within the
joint spaces on at least two consecutive T2-weighted sagittal MRI. The amount of collected fluid was divided into
4 grades, from G0 to G3, where G0 refers to no fluid, G1 limited to the verge of the disc, G2 extended over the
verge, and G3 when capsular expansion was observed.
Joint space. The narrowing of joint space between the condyle and fossa was divided into 4 categories:
normal, narrowing, bone-to-bone contact while mouth closed, and bone-to-bone contact on mouth opening.
Changes of condyle and fossa. The presence of the following 5 features of mandibular condyle and 1 fea-
ture of articular fossa, 6 features in all, were investigated: osteophyte, erosion, sclerosis, flattening, and superiorly
forming bony projection (spur) of mandibular condyle and signal changes of articular f ossa2,5,7. The number of
features were counted.
Machine learning. Prior to formulation of machine learning models, the data set was randomly divided
into two mutually exclusive sets, training (80%) and validation (20%)26. The training set was used to construct
the prediction model and the validation set was used to validate the performance of each model. Area under
Scientific Reports | (2021) 11:6680 | https://doi.org/10.1038/s41598-021-86115-3 6
Vol:.(1234567890)www.nature.com/scientificreports/
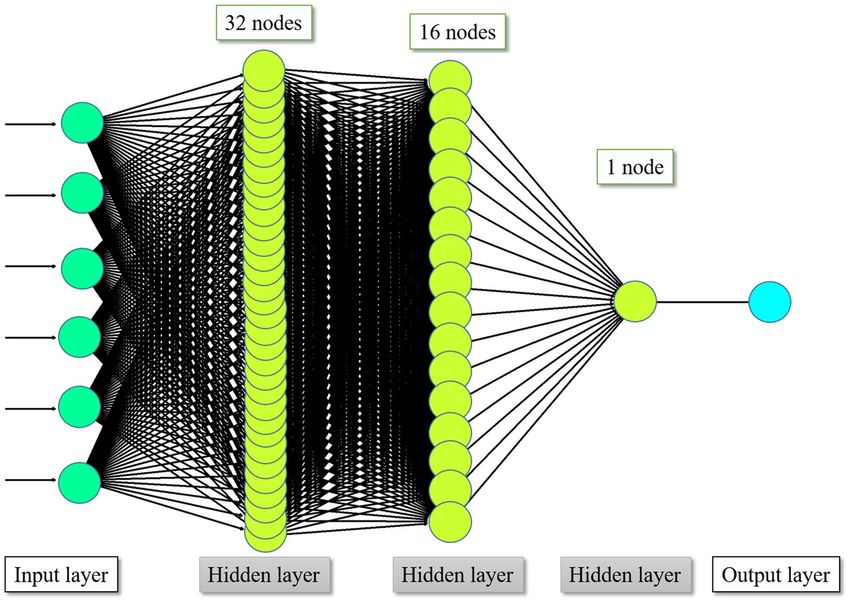
Figure 4. Architecture of multilayer perceptron (MLP). This deep neural network consists of an input layer,
three fully connected hidden layers with nodes numbering 32, 16, and 1, and an output layer. When a series
of training samples is presented to the network, a loss function measures the inaccuracy of the computed
prediction. All parameters are then slightly updated in the direction that will minimize the error, a process
called back-propagation.
the Receiver Operating Characteristic (ROC) curve (AUC) was used to compare the performance of the models
with one another, and also with those in previous reports.
A concise description of each machine learning algorithm is provided below. All machine learning models
were implemented using the Keras framework27 with the R programming language (R Core Team, Vienna,
Austria, 2016)26.
Random forest. Random forest is a tree-based machine learning algorithm which creates subsets of deci-
sion trees and combines weak outputs of the trees to yield highly accurate results by calculating the vote of each
tree28. Each decision tree predicts the value of a target variable based on several input variables by repeated
classification, also known as recursive partitioning28,29. The subsets are created by multiple iterations of random
sampling, 500 times in this study. The R package randomForest was employed28.
Multilayer perceptron (MLP). Multilayer perceptron (MLP) is a class of artificial neural network (ANN)
with multiple, or deep, layers of nodes. Each neuronal node connects with others in patterns similar to those
in animal neurons and uses a non-linear activation function. This non-linear characteristic makes it possible to
distinguish linearly inseparable data. The Keras framework27, a recent deep learning interface, was employed to
construct an MLP model in this study.
The MLP model architecture used in this study, illustrated in Fig. 4, is composed of an input layer, three fully
connected hidden layers and an output layer. The input layer refers to input data such as features extracted from
TMJ MRI. The hidden layers are those where the input features are computed. The node in the output layer
represents the computed prediction r esult27.
A neural network is trained by adjusting the weights and biases of each node. These parameters are repeat-
edly adjusted via an optimization algorithm called gradient d escent27. Each time predictions are computed from
a given data sample (forward propagation), the network performance is assessed through a loss function that
measures the error of the prediction. Each network parameter is then adjusted in small increments in the direc-
tion that minimizes the loss, a process called back-propagation27,30. This MLP learning process is shown in Fig. 1.
Conclusion
Implementing deep learning showed superior performance in predicting disc perforation in TMJ compared to
conventional methods and previous reports.
Scientific Reports | (2021) 11:6680 | https://doi.org/10.1038/s41598-021-86115-3 7
Vol.:(0123456789)www.nature.com/scientificreports/
Received: 28 October 2020; Accepted: 8 March 2021
References
1. Dimitroulis, G. The prevalence of osteoarthrosis in cases of advanced internal derangement of the temporomandibular joint: A
clinical, surgical and histological study. Int. J. Oral Maxillofac. Surg. 34, 345–349 (2005).
2. Kuribayashi, A., Okochi, K., Kobayashi, K. & Kurabayashi, T. MRI findings of temporomandibular joints with disk perforation.
Oral Surg. Oral Med. Oral Pathol. Oral Radiol. Endod. 106, 419–425 (2008).
3. Shen, P. et al. Magnetic resonance imaging applied to the diagnosis of perforation of the temporomandibular joint. J. Craniomaxil-
lofac. Surg. 42, 874–878 (2014).
4. Limchaichana, N., Petersson, A. & Rohlin, M. The efficacy of magnetic resonance imaging in the diagnosis of degenerative and
inflammatory temporomandibular joint disorders: A systematic literature review. Oral Surg. Oral Med. Oral Pathol. Oral Radiol.
Endod. 102, 521–536 (2006).
5. Kim, J. Y., Jeon, K. J., Kim, M. G., Park, K. H. & Huh, J. K. A nomogram for classification of temporomandibular joint disk perfora-
tion based on magnetic resonance imaging. Oral Surg. Oral Med. Oral Pathol. Oral Radiol. 125, 682–692 (2018).
6. Rao, V. M. & Bacelar, M. T. MR imaging of the temporomandibular joint. Neuroimaging Clin. N. Am. 14, 761–775 (2004).
7. Yura, S., Nobata, K. & Shima, T. Diagnostic accuracy of fat-saturated T2-weighted magnetic resonance imaging in the diagnosis
of perforation of the articular disc of the temporomandibular joint. Br. J. Oral Maxillofac. Surg. 50, 365–368 (2012).
8. Burt, J. R. et al. Deep learning beyond cats and dogs: Recent advances in diagnosing breast cancer with deep neural networks. Br.
J. Radiol. 91, 20170545 (2018).
9. Fazal, M. I., Patel, M. E., Tye, J. & Gupta, Y. The past, present and future role of artificial intelligence in imaging. Eur. J. Radiol. 105,
246–250 (2018).
10. Zhang, W., Li, J., Li, Z. B. & Li, Z. Predicting postoperative facial swelling following impacted mandibular third molars extraction
by using artificial neural networks evaluation. Sci. Rep. 8, 12281 (2018).
11. Kim, D. W., Kim, H., Nam, W., Kim, H. J. & Cha, I. H. Machine learning to predict the occurrence of bisphosphonate-related
osteonecrosis of the jaw associated with dental extraction: A preliminary report. Bone 116, 207–214 (2018).
12. Chartrand, G. et al. Deep learning: A primer for radiologists. Radiographics 37, 2113–2131 (2017).
13. Yang, H. et al. Deep learning for automated detection of cyst and tumors of the jaw in panoramic radiographs. J. Clin. Med. 9, 1839
(2020).
14. Lee, K.-S., Ryu, J.-J., Jang, H. S., Lee, D.-Y. & Jung, S.-K. Deep convolutional neural networks based analysis of cephalometric
radiographs for differential diagnosis of orthognathic surgery indications. Appl. Sci. 10, 2124 (2020).
15. Bianchi, J. et al. Osteoarthritis of the Temporomandibular Joint can be diagnosed earlier using biomarkers and machine learning.
Sci. Rep. 10, 8012 (2020).
16. Lee, K. S. et al. Automated detection of TMJ osteoarthritis based on artificial intelligence. J. Dent. Res. 99, 1363–1367 (2020).
17. Akkus, Z., Galimzianova, A., Hoogi, A., Rubin, D. L. & Erickson, B. J. Deep learning for brain MRI segmentation: State of the art
and future directions. J. Digit. Imaging 30, 449–459 (2017).
18. Işin, A., Direkoǧlu, C. & Şah, M. Review of MRI-based brain tumor image segmentation using deep learning methods. Proc.
Comput. Sci. 102, 317–324 (2016).
19. Plis, S. M. et al. Deep learning for neuroimaging: A validation study. Front. Neurosci. 8, 229 (2014).
20. Savadjiev, P. et al. Demystification of AI-driven medical image interpretation: Past, present and future. Eur. Radiol. 29, 1616–1624
(2018).
21. Chockley, K. & Emanuel, E. The end of radiology? Three threats to the future practice of radiology. J. Am. Coll. Radiol. 13,
1415–1420 (2016).
22. Szegedy, C. et al. Intriguing properties of neural networks. arXiv preprint arXiv 1312, 6199 (2013).
23. Teach, R. L. & Shortliffe, E. H. An analysis of physician attitudes regarding computer-based clinical consultation systems. Comput.
Biomed. Res. 14, 542–558 (1981).
24. Chaudhari, A. S. et al. Utility of deep learning super-resolution in the context of osteoarthritis MRI biomarkers. J. Magn. Reson.
Imaging 51, 768–779 (2020).
25. Huh, J. K., Kim, H. G. & Ko, J. Y. Magnetic resonance imaging of temporomandibular joint synovial fluid collection and disk
morphology. Oral Surg. Oral Med. Oral Pathol. Oral Radiol. Endod 95, 665–671 (2003).
26. Kim, W. et al. Development of novel breast cancer recurrence prediction model using support vector machine. J. Breast Cancer
15, 230–238 (2012).
27. Chollet, F., Allaire, J. J. & others R Interface to Keras (GitHub, 2017).
28. Breiman, L. Random forests. Mach. Learn. 45, 5–32 (2001).
29. Breiman, L., Friedman, J., Stone, C. J. & Olshen, R. A. Classification and Regression Trees (Chapman & Hall, 1984).
30. Rumelhart, D. E., Hinton, G. E. & Williams, R. J. Learning Internal Representations by Error Propagation (California Univ San
Diego La Jolla Inst for Cognitive Science, 1985).
Author contributions
The authors contributed to this study as “J.Y.K. and D.W.K. investigated data and wrote manuscript; J.Y.K. and
K.J.J. read magnetic resonance imaging; H.K. revised the code for artifical intelligence; J.K.H. revised and edited
final manuscript". All authors reivewed the manuscriptAll authors have read and agreed to the published version
of the manuscript.
Competing interests
The authors declare no competing interests.
Additional information
Supplementary Information The online version contains supplementary material available at https://doi.org/
10.1038/s41598-021-86115-3.
Correspondence and requests for materials should be addressed to J.-K.H.
Reprints and permissions information is available at www.nature.com/reprints.
Publisher’s note Springer Nature remains neutral with regard to jurisdictional claims in published maps and
institutional affiliations.
Scientific Reports | (2021) 11:6680 | https://doi.org/10.1038/s41598-021-86115-3 8
Vol:.(1234567890)www.nature.com/scientificreports/
Open Access This article is licensed under a Creative Commons Attribution 4.0 International
License, which permits use, sharing, adaptation, distribution and reproduction in any medium or
format, as long as you give appropriate credit to the original author(s) and the source, provide a link to the
Creative Commons licence, and indicate if changes were made. The images or other third party material in this
article are included in the article’s Creative Commons licence, unless indicated otherwise in a credit line to the
material. If material is not included in the article’s Creative Commons licence and your intended use is not
permitted by statutory regulation or exceeds the permitted use, you will need to obtain permission directly from
the copyright holder. To view a copy of this licence, visit http://creativecommons.org/licenses/by/4.0/.
© The Author(s) 2021
Scientific Reports | (2021) 11:6680 | https://doi.org/10.1038/s41598-021-86115-3 9
Vol.:(0123456789)You can also read