Using distance sampling with camera traps to estimate the density of group-living and solitary mountain ungulates
←
→
Page content transcription
If your browser does not render page correctly, please read the page content below
Using distance sampling with camera traps to
estimate the density of group-living and solitary
mountain ungulates
RANJANA PAL, TAPAJIT BHATTACHARYA, QAMAR QURESHI
S T E P H E N T . B U C K L A N D and S A M B A N D A M S A T H Y A K U M A R
Abstract Throughout the Himalaya, mountain ungulates Introduction
are threatened by hunting for meat and body parts, habitat
loss, and competition with livestock. Accurate population
estimates are important for conservation management but U ngulates are an integral component of Himalayan
mammalian fauna and play an essential role in shaping
ecosystems by influencing vegetation structure (McNaughton,
most of the available methods to estimate ungulate densities
are difficult to implement in mountainous terrain. Here, ; Bagchi & Ritchie, ) and as primary prey for large
we tested the efficacy of the recent extension of the point predators (Bagchi & Mishra, ; Sathyakumar et al., a).
transect method, using camera traps for estimating density Population estimates are important for effective conservation
of two mountain ungulates: the group-living Himalayan management (Singh & Milner-Gulland, ; Suryawanshi
blue sheep or bharal Pseudois nayaur and the solitary et al., ). Methods to estimate animal abundance include
Himalayan musk deer Moschus leucogaster. We deployed distance sampling (Buckland et al., ), track count (Sulk-
camera traps in – for the bharal (summer: loca- ava & Liukko, ), dung count (Laing et al., ), the
tions; winter: ) in the trans-Himalayan region (,– abundance induced heterogeneity model (Royle & Nichols,
, m) and in – for the musk deer (summer: ), repeated count (Royle, ) and the double observer
locations; winter: ) in subalpine habitats (,– method (Forsyth & Hickling, ; Suryawanshi et al., ;
, m) in the Upper Bhagirathi basin, Uttarakhand, Suryawanshi et al., ). In mountains, however, rugged
India. Using distance sampling with camera traps, we esti- and steep terrain, inaccessibility and harsh weather conditions
mated the bharal population to be . ± SE . individuals/ make these techniques less effective (Singh & Milner-Gulland,
km (CV = .) in summer and . ± SE . individuals/ ).
km (CV = .) in winter. For musk deer, the estimated As a consequence, several studies on mountain ungulates
density was . ± SE . individuals/km (CV = .) in have used an indirect index of abundance (e.g. Schaller et al.,
summer and . ± SE . individuals/km (CV = .) in ; Sathyakumar, ; Bagchi & Mishra, ; McCarthy
winter. The high variability in these estimates is probably et al., ; Suryawanshi et al., ) as an alternative to ab-
a result of the topography of the landscape and the biology solute abundance. However, these estimates are less reliable
of the species. We discuss the potential application of dis- and highly dependent on the assumption of constant de-
tance sampling with camera traps to estimate the density tection probability throughout the survey period (Yoccoz
of mountain ungulates in remote and rugged terrain, and et al., ). In addition, small population sizes, cryptic and
the limitations of this method. elusive behaviour, and patchy distribution of Himalayan
ungulates limit the number of observations that can be
Keywords Bharal, camera trapping, density estimates, made for a given survey effort (Singh & Milner-Gulland,
musk deer, point transect method, subalpine, trans- ). Forest-dwelling mountain ungulates may have activity
Himalaya, Upper Bhagirathi basin peaks at night (Cavallini, ; Bhattacharya et al., a)
Supplementary material for this article is available at and are rarely detected during day-time surveys.
doi.org/./SX Distance sampling is one of the most popular methods
for assessing the density of large herbivores in tropical
forests (Buckland et al., ). However, meeting the un-
SAMBANDAM SATHYAKUMAR (Corresponding author, orcid.org/0000-0003- derlying assumptions of this method in the mountains is
2027-4706), RANJANA PAL ( orcid.org/0000-0002-6011-104X) and QAMAR difficult (Corlatti et al., ), which can lead to underesti-
QURESHI Wildlife Institute of India, Chandrabani, Dehradun, Uttarakhand
248001, India. E-mail ssk@wii.gov.in mation of population sizes. In the mountains, non-random
TAPAJIT BHATTACHARYA ( orcid.org/0000-0002-1154-4033) Durgapur Government
locations of non-linear transects, inaccurate measurements
College, Durgapur, India of sighting distance and angle, and elusive behaviour of tar-
STEPHEN T. BUCKLAND ( orcid.org/0000-0002-9939-709X) The Centre for get species violate the assumptions underlying conventional
Research into Ecological and Environmental Modelling, University of St distance sampling (O’Neill, ; Singh & Milner-Gulland,
Andrews, St Andrews, UK
). Furthermore, the structure of mountainous terrain
Received January . Revision requested May . can hamper animal detectability, as animals hidden behind
Accepted July .
This is an Open Access article, distributed under the terms of the Creative Commons Attribution licence (http://creativecommons.org/licenses/by/4.0/), which permits unrestricted re-use,
Downloadeddistribution,
from https://www.cambridge.org/core. IP address:
and reproduction in any medium, provided 94.175.106.18, onis31properly
the original work May 2021 at 09:26:36, subject to the Cambridge Core terms of use, available at
cited.
https://www.cambridge.org/core/terms. https://doi.org/10.1017/S003060532000071X
Oryx, Page 1 of 9 © The Author(s), 2021. Published by Cambridge University Presson behalf of Fauna & Flora International doi:10.1017/S003060532000071X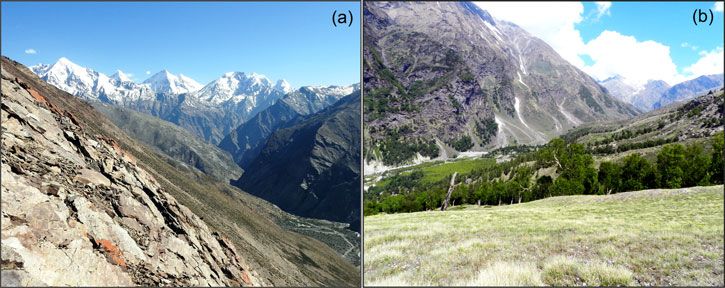
2 R. Pal et al.
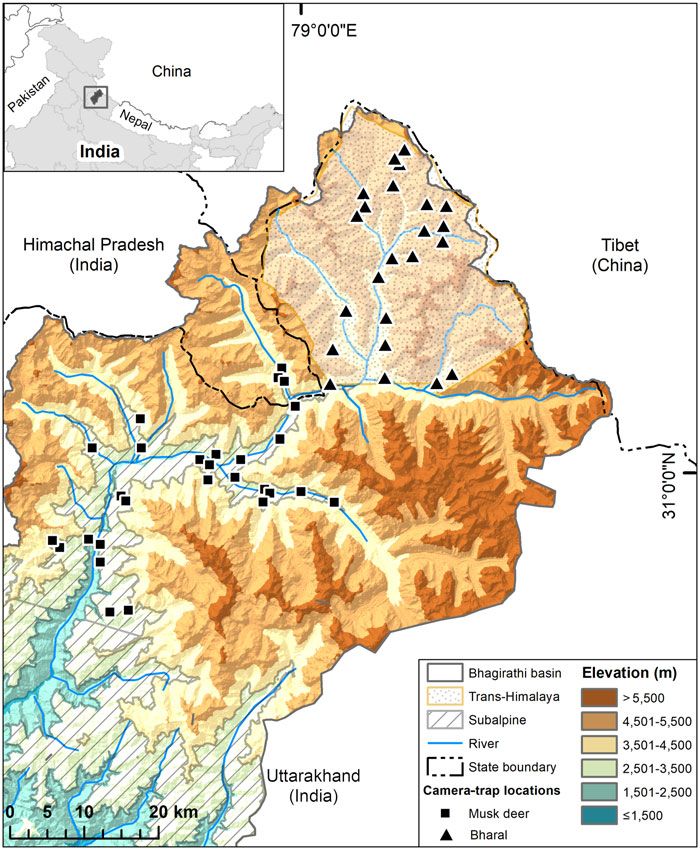
FIG. 1 Study area in the
trans-Himalayan region and
subalpine region of the Upper
Bhagirathi basin, with the locations
of camera traps used for estimating
densities of the bharal Pseudois
nayaur, and Himalayan musk deer
Moschus leucogaster, respectively.
The inset map shows the location of
the Bhagirathi basin in Uttarakhand
State, Western Himalaya, India.
rocks or in valleys could remain undetected, irrespective of blue sheep or bharal Pseudois nayaur and the Himalayan musk
their distance from the observer. deer Moschus leucogaster, both of which are affected by
Camera traps are an efficient tool for detecting elusive anthropogenic impacts (Mishra et al., ; Bhattacharya
and rare species in remote habitats (Burton et al., ; & Sathyakumar, ). The bharal is a social species of
Rovero & Zimmermann, ), and extending the point the Caprinae subfamily. It is associated with alpine and
transect method to accommodate data from camera traps steppe mountain pastures, and subalpine slopes devoid
could help solve some of the issues related to the violation of tree cover (,–, m; Prater, ; Sathyakumar
of the assumptions underlying classic distance sampling & Bhatnagar, ). The species is categorized as Least
(Howe et al., ). Distance sampling with camera traps Concern on the IUCN Red List and listed in Schedule I of
has recently been tested for estimating the populations the Indian Wildlife (Protection) Act, . In contrast, the
of Maxwell’s duiker Philantomba maxwellii (Howe et al., Himalayan musk deer is solitary and sedentary, remain-
) and the western chimpanzee Pan troglodytes versus ing within a defined home range throughout the year. The
(Cappelle et al., ) in Côte d’Ivoire. However, the efficacy musk deer, a primitive deer-like ruminant, is a member of
of this technique in mountainous terrain has yet to be tested. the family Moschidae. In the Indian Himalayan region, the
Mountain ungulates are threatened by hunting for meat southern side of the Greater Himalaya, it is restricted to areas
and body parts (Sathyakumar et al., a,b), habitat loss between , m and the treeline (Green, ; Sathyakumar
(Namgail et al., ; Kittur et al., ) and competition et al., b). It is categorized as Endangered on the IUCN
with livestock (Mishra et al., ; Bhattacharya et al., b) Red List (Timmins & Duckworth, ) and listed in the
throughout the Himalaya. Here, we focused on the Himalayan Indian Wildlife (Protection) Act, , in Schedule I.
Oryx, Page 2 of 9 © The Author(s), 2021. Published by Cambridge University Presson behalf of Fauna & Flora International doi:10.1017/S003060532000071X
Downloaded from https://www.cambridge.org/core. IP address: 94.175.106.18, on 31 May 2021 at 09:26:36, subject to the Cambridge Core terms of use, available at
https://www.cambridge.org/core/terms. https://doi.org/10.1017/S003060532000071X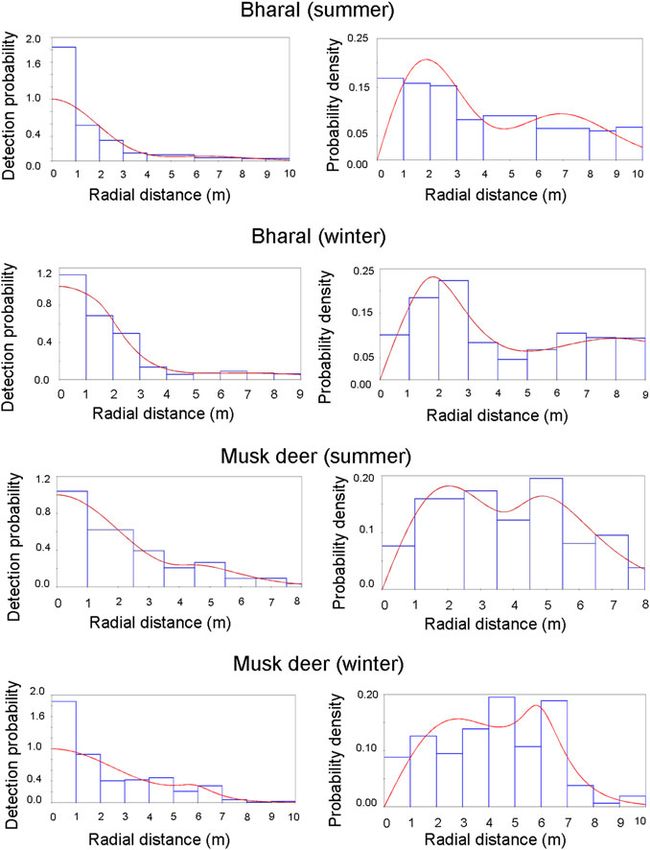
Distance sampling with camera traps 3
PLATE 1 The study was conducted
in the trans-Himalayan part
(Nilang valley) of Gangotri
National Park characterized by
dry alpine scrub vegetation, broken
terrain, deep gorges, high gradient
slopes, and narrow valleys (a), and
in the subalpine portion of the Park
and Uttarkashi Forest Division (b)
within Uttarakhand State, India.
Here, we tested the efficacy of the extension of the series, Cuddeback, De Pere, USA) to capture the bharal at
distance sampling method to accommodate camera-trap locations during summer (May–September ; ,
data for estimating the density of the group-living bharal trap nights) and locations during winter (October –
in the trans-Himalayan region (,–, m) and the January ; , trap nights) in the trans-Himalayan re-
solitary Himalayan musk deer in the subalpine region gion of Gangotri National Park (Fig. ). For the Himalayan
(,–, m) of the Upper Bhagirathi basin. We exam- musk deer, we set up camera traps in subalpine habitat, at
ined the field applicability and possible limitations of this locations during summer (May–September ; ,
method for estimating the density of these two ungulates trap nights) and locations during winter (October –
in mountainous terrain. January ; trap nights). Camera traps were mounted
– cm above the ground, and programmed to trigger
Study area immediately and record an image followed by a -s video
when movement was detected.
We carried out this study in the trans-Himalayan part Distance analysis requires calculating distance of the tar-
(Nilang valley) of Gangotri National Park, in the subalpine get species from the observer, in our case from the camera.
portion of the Park and Uttarkashi Forest Division within To estimate the distance of photo-captured individuals from
Uttarakhand State, India (Fig , Plate ). Nilang valley is the camera trap, we calibrated image measurements against
characterized by broken terrain, deep gorges, steep slopes actual measurements during camera installation. For this,
(. °) and narrow valleys (Bhardwaj et al., ). The study we took measurements using a calibration pole of known
area does not have permanent human settlements, but the height at known distances from the camera, in the centre
alpine and subalpine zones are seasonal grazing ground and along both sides of the camera’s field of view. This cali-
for livestock from lower parts of the Bhagirathi basin. bration was done for a total of camera traps, and we consid-
Tourists also use the area in summer (June–September). ered the measurements taken at these locations representative
Nilang valley forms the international boundary with Tibet for others with similar topography and field of view.
and is controlled by military personnel. There is a network
of snow-fed tributaries of the Jadh Ganga, which drains the
Data analysis
area to meet the Bhagirathi River. We surveyed areas of dry
alpine scrub vegetation at ,–, m for the bharal, and Test for sampling bias To test whether we had sampled all
subalpine habitats dominated by Betula utilis, Pinus wallichi- elevations and topographic features according to their avail-
ana, Quercus semecarpifolia and Cedrus deodara, at ,– ability in the landscape, we compared elevation, ruggedness,
, m, for the Himalayan musk deer. slope and aspect of camera-trap locations and randomly
generated points using a non-parametric Mann–Whitney
Methods U test for scale variables (elevation, slope, ruggedness) and
Bonferroni confidence intervals for the categorical variable
Data collection (aspect). We resampled elevation data from the Shuttle
We divided the study area into grid cells of × km. In each Radar Topography Mission, at km resolution (Jarvis et al.,
grid cell, we generated random points using a sampling ). We calculated slope, ruggedness and aspect informa-
tool in ArcGIS . (Esri, Redlands, USA), and selected tion using spatial analyst from the Digital Elevation Model
accessible points for the placement of camera traps. Some in ArcGIS.
randomly generated locations were inaccessible because of
precipitous terrain or the presence of seasonal pastoral Availability for detection With camera traps, we can only
nomad camps. We deployed camera traps (Cuddeback blue estimate the density of populations that are available for
Oryx, Page 3 of 9 © The Author(s), 2021. Published by Cambridge University Presson behalf of Fauna & Flora International doi:10.1017/S003060532000071X
Downloaded from https://www.cambridge.org/core. IP address: 94.175.106.18, on 31 May 2021 at 09:26:36, subject to the Cambridge Core terms of use, available at
https://www.cambridge.org/core/terms. https://doi.org/10.1017/S003060532000071X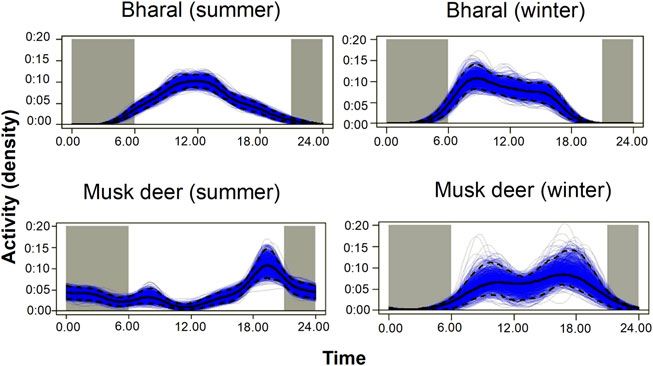
4 R. Pal et al.
FIG. 2 Kernel density estimates of daily
activity pattern of the bharal and the musk
deer in summer and winter in the Upper
Bhagirathi basin.
detection (Howe et al., ). If the population surveyed is to correct the naïve density estimate by dividing it by propor-
not available for detection during the data collection pe- tion of time active, using Distance . (Thomas et al., ).
riod selected for analysis, temporal sampling effort is over-
estimated, and as a result, density could be underestimated
(Cappelle et al., ). To avoid this bias, either the sam- Density estimation Distance sampling with camera traps
pling period should be defined as the time during which requires calculating the distance between the animal and the
the entire population was available for detection (peak ac- camera at snapshot moments to ensure that animal movement
tivity period) or the proportion of time when animals were does not bias the distribution of detection distances (Howe
available for detection should be included as a parameter in et al., ). We thus defined a finite set of snapshot moments
the model (Howe et al., ). In our study, the bharal was ( s apart) within the sampling period (as suggested in Howe
active during .–., without a marked peak in activity et al., ). For each snapshot moment when the species
(Fig. ). The Himalayan musk deer was active at night was captured, we estimated the radial distance between each
(.–.) in summer and during the day (.–.) animal and the camera trap, using a regression equation
in winter (Fig. ). We used the active period of each species developed from the field calibration. In this equation, the de-
as the sampling period for the analysis. We corrected for pendent variable was the ratio of the actual height of an indi-
the bias caused by animals being unavailable for detection vidual to its height in the photograph, and the explanatory
by calculating the mean proportion of animals that were variable was the distance at which the individual was photo-
active during the period selected for analysis and incor- captured (see Supplementary Material for details). We ob-
porating this proportion in the density estimates. For tained information on actual heights for different age and
example, for the bharal we first plotted the number of sex classes of the bharal by comparing the camera-trap photos
independent captures (i.e. at least a -minute interval of the species with the height of the calibration pole height. We
between subsequent captures) to visualize the activity pat- identified eight, , two and comparable photographs of
tern of the species (Fig. ). We assumed that if all animals adult males, adult females, subadults and fawns, respectively.
were active throughout the day, then the curve would be a We calculated the mean height as . ± SE . cm (adult
flat line between . and .. On the other hand, if all male), . ± SE . cm (adult female) and . ± SE . cm
the animals were active around . (at the highest point (subadult) and . ± SE . cm (fawn). For adult Himalayan
of the curve), then this flat line will coincide with the curve musk deer we used a mean height of cm (Sathyakumar
at .. We calculated both the areas under the imaginary et al., b) to estimate their distance from the camera.
flat line and under the actual activity curve shown in Fig. . Density was estimated following the equation for
We then calculated the mean proportion of animals that camera-trap point transects (Howe et al., ):
are active between . and . by dividing the propor-
tion of the area under the actual activity curve by the area
K
nk
under the imaginary flat line, where animal activity reaches k=1 1
D̂ = ×
a peak. The estimated mean proportion of animals that are
K A
active during the period selected for analysis was . pw2 ek P̂k
k=1
in summer and . in winter for the bharal. For the
Himalayan musk deer it was . in summer and . in where nk is the number of observations of animals at a point
winter. We used the proportion of time animals are active k (camera-trap location), ek is the temporal effort, and P̂k is
Oryx, Page 4 of 9 © The Author(s), 2021. Published by Cambridge University Presson behalf of Fauna & Flora International doi:10.1017/S003060532000071X
Downloaded from https://www.cambridge.org/core. IP address: 94.175.106.18, on 31 May 2021 at 09:26:36, subject to the Cambridge Core terms of use, available at
https://www.cambridge.org/core/terms. https://doi.org/10.1017/S003060532000071XDistance sampling with camera traps 5
the estimated probability of obtaining an image of an animal points (Supplementary Fig. ). Encounter rates were highly
that is within θ degrees (angle covered by the camera’s field variable amongst locations and did not show any spatial
of view), K is the total number of camera-trap locations and autocorrelation for the bharal (Moran’s I P: . in summer,
w (truncation distance) in front of the camera at a snapshot . in winter) or the musk deer (Moran’s I P: . in summer,
of the moment. The effort at a point k was measured as . in winter).
ek = θ Tk/ πt where θ/π describes the fraction of a circle
covered by a camera, Tk is the period of camera deployment
(in seconds), and t is the unit of time used to determine a Density estimates
finite set of snapshot moments within Tk (also in seconds). The bharal was photo-captured by out of camera
We defined the period of camera deployment as the time the traps deployed in summer, and out of in winter.
target species was expected to be active during the sampling We obtained , snapshots in videos in summer
period. For the bharal, this was a -hour period per day and snapshots in videos in winter. In summer,
(.–.) in both seasons and for the Himalyan musk one of the cameras contributed a large number of captures
deer a -hour period per day (.–.) in summer (c. % of the total dataset). This particular camera was
and a -hour period per day (.–.) in winter. /A placed on a steep slope with cliffs on both sides, and
is the availability correction factor. close (– m) to an intensively used bharal trail along a
Seven camera traps malfunctioned because of technical
stream. Consequently, a large number of observations by
errors and were not included in the final analysis. For the
this camera were within – m as most of the bharals fol-
analysis in Distance, we modelled the detection from using
lowed the path to move up or down the slope. Because of
the same functions as Howe et al. (): half normal with ,
this bias, the initially estimated density of . ± SE .
or Hermite polynomial adjustment terms; hazard rate
individuals/km had a high CV (.). We removed
with , , or cosine adjustments; uniform with or cosine
this camera from the final analysis to get an estimate
adjustments. As model selection methods based on Akaike’s
with reduced bias. Amongst the summer captures, we
information criterion (AIC) tend to favour overly complex
found an excess of distances close to the camera (Fig. ).
models because of overdispersion in the data, we selected
The hazard-rate model is more sensitive than the half-
models using a recently proposed two-step procedure
normal model to this excess, resulting in an implausible
(Howe et al., ): () Firstly, the best model is selected
rapid fall-off in the detection probability. Therefore, we
on the basis of AIC adjusted for overdispersion (QAIC)
used the second-best model (Table ), the half-normal
within each key function, where the overdispersion param-
model, for estimating bharal density in summer (. ± SE
eter (Ĉ) is calculated from the ratio between the χ statistics
. individuals/km, CV = .). In winter, the best model
of the most parameterized model for each key function and
was the hazard-rate model, and the second-best half-
its degrees of freedom (χ/df). () Secondly, the best model
normal model resulted in the same density estimates
is selected with the smallest values of the χ goodness-of-fit
(. ± SE . individuals/km, CV = .; Table ).
statistic divided by its degrees of freedom (across QAIC-
Himalayan musk deer were captured by out of
selected models, one from each key function). We used
cameras in summer and out of cameras in winter. We
the point transect distance sampling method in Distance
obtained snapshots in videos in summer and
(Thomas et al., ) for all analyses.
snapshots in videos in winter. Himalayan musk deer
data did not show the heterogeneity in capture probabil-
Results ities amongst cameras that we observed for the bharal,
nor any evidence of bias in terms of distances (Fig. ). The
Sampling bias test best model was the hazard-rate model with cosine adjust-
ment in both seasons (Table ), and estimated density was
In case of the Himalayan musk deer, the elevation, rugged- . ± SE . individuals/km (CV = .) in summer and .
ness and slope of sampled camera-trap locations were not ± SE . individuals/km (CV = .) in winter (Table ).
biased: the mean values of sampled locations were not sig-
nificantly different from the mean elevation, ruggedness
and slope of random points in both seasons (P . . Discussion
in each case, Mann–Whitney U test; Supplementary
Fig. ). Bonferroni confidence intervals indicated no par- Our estimates of bharal density in summer (. ± SE .
ticular aspect category was preferred for sampling in winter individuals/km) and winter (. ± SE . individuals/km)
or summer (Supplementary Fig. ). Similarly, in the case of were similar. Estimates of bharal densities from three differ-
the bharal, the ruggedness, elevation and slope of the sam- ent locations in Spiti, the nearest trans-Himalayan landscape
pled camera locations were not different from the mean (using standardized double observer method; Suryawanshi
ruggedness, elevation, slope and aspect of the random et al., ) were ., . and ./km. Estimates of bharal
Oryx, Page 5 of 9 © The Author(s), 2021. Published by Cambridge University Presson behalf of Fauna & Flora International doi:10.1017/S003060532000071X
Downloaded from https://www.cambridge.org/core. IP address: 94.175.106.18, on 31 May 2021 at 09:26:36, subject to the Cambridge Core terms of use, available at
https://www.cambridge.org/core/terms. https://doi.org/10.1017/S003060532000071X6 R. Pal et al.
FIG. 3 Detection probability and
probability density for the models
selected for estimating density. The bars
show the data distribution, and the line
represents the model fit. The heights of
the bars are scaled so that they cover the
same total area as the area under the
line, to show how well the detection
function fits the data.
densities in our study are low compared to those of Spiti can coverage of the entire survey area in a short period, a require-
be expected because of differences in habitat type and topog- ment that could not be fulfilled in our study because parts of
raphy. The Spiti landscape comprises vast trans-Himalayan the study area were inaccessible and visual coverage was
meadows (Biotic Province B; Rodgers et al., ), whereas insufficient (Plate ).
our study area consists primarily of narrow valleys and gorges The density of Himalayan musk deer was higher in sum-
with rough terrain and barren slopes (Biotic Province C; mer (. ± SE . individuals/km) than winter (. ± SE .
Kumar et al., ; Plate ). The differences of bharal density individuals/km). The analysis of seasonal habitat use in the
estimates and mean group sizes (. in Nilang valley vs . study area also showed a trend of decline in captures at high
in Kibber, Spiti) between these two areas may thus be a result elevations (Pal et al., ) in winter, possibly because musk
of differences in habitat quality. In addition, Nilang valley deer migrate to lower altitudes during periods of heavy
is affected by anthropogenic disturbances such as hunting snowfall. Similar seasonal movements were also observed
(Bhardwaj et al., ), livestock grazing (Chandola, ; in other areas (Anwar & Minhas, ; Dendup & Lham,
RP pers. obs., ) and presence of free-ranging dogs (Pal ). Other studies using the silent drive count meth-
et al., ). The differences could also be caused by different od in Kedarnath Wildlife Sanctuary estimated musk deer
survey techniques. We were unable to estimate bharal density density to be . ± SE . individuals/km in –
using the point count distance method because of insufficient (Sathyakumar, ), . individuals/km in –
observations. The double observer method used to estimate (Sathyakumar & Malik, ) and . individuals/km in
bharal density in trans-Himalayan habitat requires visual (S. Sathyakumar, unpubl. data). These studies may have
Oryx, Page 6 of 9 © The Author(s), 2021. Published by Cambridge University Presson behalf of Fauna & Flora International doi:10.1017/S003060532000071X
Downloaded from https://www.cambridge.org/core. IP address: 94.175.106.18, on 31 May 2021 at 09:26:36, subject to the Cambridge Core terms of use, available at
https://www.cambridge.org/core/terms. https://doi.org/10.1017/S003060532000071XDistance sampling with camera traps 7
TABLE 1 Details of the top three models used to estimate the densities of the bharal Pseudois nayaur and the Himalayan musk deer Moschus
leucogaster in summer and winter in the Upper Bhagirathi basin, Uttarakhand, India, showing key functions (defining parametric shapes
for the detection function), adjustment types (to allow for departures from the parametric shape), the number of adjustment terms selected
(order), overdispersion factor (Ĉ), Akaike’s information criterion adjusted for overdispersion (QAIC), and density estimates with standard
error (SE) and coefficient of variance (CV).
Key function Adjustment type Order Ĉ QAIC Estimate ± SE CV
Bharal (summer)
Hazard 0 2.93 1,083.87 1.61 ± 0.60 0.38
Half normal Hermite polynomial 2 29.23 118.05 0.51 ± 0.10 0.31
Uniform Cosine 1 123.98 33.06 0.16 ± 0.05 0.30
Bharal (winter)
Hazard Cosine 1 5.51 626.89 0.64 ± 0.20 0.37
Half normal Hermite polynomial 2 8.71 400.63 0.64 ± 0.20 0.37
Uniform Cosine 2 31.24 118.95 0.35 ± 0.10 0.36
Musk deer (summer)
Hazard Cosine 1 6.30 287.50 0.42 ± 0.10 0.34
Half normal 0 8.12 381.97 0.29 ± 0.10 0.34
Uniform Cosine 1 9.63 279.80 0.26 ± 0.10 0.34
Musk deer (winter)
Hazard Cosine 1 4.28 172.03 0.10 ± 0.05 0.48
Half normal 0 4.54 119.78 0.10 ± 0.05 0.47
Uniform Cosine 1 4.67 142.58 0.08 ± 0.03 0.46
overestimated musk deer densities as the drive count meth- individuals recorded at shorter distances. However, such
od is known for overestimating the density of animals incidents were relatively rare in our study (six occasions).
(Takeshita et al., ). In addition, they were carried out Herd behaviour also affects captures, as bharals tend to
in a small portion (c. . km) of a protected area; small follow the first individual when moving together. Because
study areas combined with a bias towards good habitat qual- we analysed individual distances from the camera, this can
ity can result in highly overestimated densities (Suryawanshi cause heaping in the distances recorded (Fig. ).
et al., ). Distance sampling with camera traps requires setting the
Our density estimates are associated with high coefficients cameras in burst or video mode. Our effort to implement
of variation. This high variability is probably caused by land- this method in the Greater Himalayan alpine habitats failed
scape topography and species biology. The fit of the model because cameras were continuously triggered by grass
for the solitary Himalayan musk deer was better than for movements in the field of view (RP, pers. obs., ). We
the group-living bharal. Here, we discuss some of the issues had to discard data from four camera traps in this study
we faced using sampling with camera traps, and make sugges- for the same reason. Mounting cameras higher off the
tions as to how these can be addressed in future studies. ground could help minimize this problem. In addition,
For the bharal, the main problem that caused bias in the the imprecise (high CV) estimates suggest that more sam-
distances at which individuals were captured was the inad- pling locations are required to improve precision (Howe
equate camera view because of slopes. The ruggedness of the et al., ; Cappelle et al., ).
landscape also influences the approach angle and the dis- The ability of camera sensors to detect moving animals
tance covered by the cameras: those on hilltops or at the base may vary depending on camera type and placement, tem-
of a hill covered distances of – m, whereas cameras on perature, and humidity (Hofmeester et al., ). Different
hill slopes covered distances of – m (depending on the camera models can be tested at a site to assess the ability
slope). Topographic variability probably also influenced to detect animals. There could be inconsistencies between
detection probability and the estimated angle of the cam- the theoretical and actual angle of view θ, which can lead
era view. Future studies in similar landscapes could use to biased estimates. This can result in underestimates if
statistical tests to examine the effects of these parameters sensors are less sensitive to movements near the edges of the
more thoroughly. camera’s field of view (i.e. the effective angle can be smaller
Another issue encountered with the group-living bharal than the assumed angle). This can be addressed with field
was that animals grazing close to the camera blocked the tests to estimate the effective angle θ, which can then be ac-
view of animals that were further away. This can make it counted for in the analysis. Imprecise measures of distance
impossible to calculate the distance from the camera for should not be an issue if they are appropriately binned in
individuals in the background, leading to a bias towards distances for the analysis (Buckland et al., ). However,
Oryx, Page 7 of 9 © The Author(s), 2021. Published by Cambridge University Presson behalf of Fauna & Flora International doi:10.1017/S003060532000071X
Downloaded from https://www.cambridge.org/core. IP address: 94.175.106.18, on 31 May 2021 at 09:26:36, subject to the Cambridge Core terms of use, available at
https://www.cambridge.org/core/terms. https://doi.org/10.1017/S003060532000071X8 R. Pal et al.
imprecise estimates of the target species’ availability for Author contributions Conception of study: SS, RP, TB, QQ; data
detection can cause erroneous estimates. Care should thus collection: RP; data analysis: RP, STB, TB; writing: all authors; revi-
sions: QQ, STB, SS.
be taken in selecting the appropriate time period of animal
activity and availability for detection (Howe et al., ). Conflicts of interest None.
Distance sampling with camera traps has paved the way
for a new analytical approach to estimate the abundance of Ethical standards This work was carried out with permission from
both group-living and solitary mountain ungulates in rug- Uttarakhand Forest Department (Letter no. 836/5-6) and abided by
ged and inaccessible terrains of the Himalaya. It can to the Oryx guidelines on ethical standards.
some extent overcome the logistic constraints associated
with rugged terrain and harsh weather that affect other
methods such as point counts and transects sampling. References
These traditional methods are difficult to implement effec-
ANWAR, M. & M I N H A S , R.A. () Distribution and population status
tively in a high-altitude, rugged and remote landscape be- of Himalayan musk deer (Moschus chrysogaster) in the Machiara
cause they require cover of most vantage points in a single National Park, AJ and K. Pakistan Journal of Zoology, , –.
day or within a defined, short period of time (Singh & B A G C H I , S. & M I S H R A , C. () Living with large carnivores:
Milner-Gulland, ). In addition, the low number of de- predation on livestock by the snow leopard (Uncia uncia).
tections often limits the conventional analytical process. Journal of Zoology, , –.
B A G C H I , S. & R I T C H I E , M.E. () Herbivore effects on above- and
Indirect observations such as dung counts can be useful belowground plant production and soil nitrogen availability in the
but require estimation of the decay rate, which is often dif- trans-Himalayan shrub-steppes. Oecologia, , –.
ficult to obtain (Buckland, ; Kuehl et al., ). Distance B H A R D WA J , M., U N I YA L , V.P. & S A N YA L , A.K. () Estimating
sampling with camera traps can work for longer periods in relative abundance and habitat use of Himalayan blue sheep
the field and may help to overcome the challenges presented Pseudois Nayaur in Gangotri National Park. Galemys: Boletín
Informativo de la Sociedad Española para la Conservación y Estudio
by low numbers of detections and observer bias (Cappelle de los Mamíferos, , –.
et al., ). An important advantage of camera traps over B H AT TA C H A R YA , T. & S A T H Y A K U M A R , S. () Natural resource use
conventional distance sampling is that they are better suited by humans and response of wild ungulates. Mountain Research and
to monitor solitary, elusive and nocturnal species such as the Development, , –.
Himalayan musk deer. Camera traps have been extensively B H AT TA C H A R YA , T., B A S H I R , T., P O U DYA L , K., S AT H YA K U M A R , S. &
S A H A , G.K. (a) Distribution, occupancy and activity patterns
used to survey the snow leopard Panthera uncia. A slight
of goral (Nemorhaedus goral) and serow (Capricornis thar) in
modification in the sampling design (modified camera Khangchendzonga Biosphere Reserve, Sikkim, India. Mammal
placement) could help gain information on its main prey Study, , –.
species, including the bharal, the ibex Capra sibirica, the B H AT TA C H A R YA , T., K I T T U R , S., S AT H YA K U M A R , S. & R AWAT , G.S.
argali Ovis ammon and the musk deer. (b) Diet overlap between wild ungulates and domestic livestock
in the Greater Himalaya: implications for management of grazing
Despite these advantages, there are limitations to the use of
practices. Proceedings of the Zoological Society, , –.
camera traps, including the high cost of the cameras and the B U C K L A N D , S.T., A N D E R S O N , D.R., B U R N H A M , K.P., L A A K E , J.L.,
extensive time required to process photographs and videos. B O R C H E R S , D.L. & T H O M A S , L. () Introduction to Distance
Substantial numbers of camera traps would be required to Sampling: Estimating Abundance of Biological Populations.
improve the precision of density estimates derived from Oxford University Press, Oxford, UK.
distance sampling with camera traps (Cappelle et al., ). B U C K L A N D , S.T., R E X S T A D , E.A., M A R Q U E S , T.A. & O E D E KO V E N , C.S.
() Distance Sampling: Methods and Applications. Springer
Despite the high initial cost, we believe this approach could International Publishing, Cham, Switzerland.
help improve abundance estimations for both group living B U R T O N , A.C., N E I L S O N , E., M O R E I R A , D., L A D L E , A., S T E E N W E G , R.,
and solitary mountain ungulates in rough, mountainous ter- F I S H E R , J.T. et al. () Wildlife camera trapping: a review and
rain where conventional techniques cannot be implemented. recommendations for linking surveys to ecological processes.
Journal of Applied Ecology, , –.
Acknowledgements This work is part of a project initiated un- C A P P E L L E , N., D E S P R É S -E I N S P E N N E R , M., H O W E , E.J., B O E S C H , C. &
der the National Mission for Sustaining the Himalayan Ecosystem K Ü H L , H.S. () Validating camera trap distance sampling for
(NMSHE) Programme funded by the Department of Science and chimpanzees. American Journal of Primatology, , e.
Technology, Government of India (grant no.: DST/SPLICE/CCP/ C AVA L L I N I , P. () Survey of the goral Nemorhaedus goral
NMSHE/TF-2/WII/2014[G]). The Miriam Rothschild Travel Bursary (Hardwicke) in Himachal Pradesh. Journal of Bombay Natural
Programme provided funding for a 4-week internship for R. Pal with S. History Society, , –.
T. Buckland at St Andrews University, UK. We thank the Director and C H A N D O L A , S. () Vegetational inventory of cold desert habitat of
Dean of the Wildlife Institute of India for their guidance and support; Nilang area of Jadh Ganga catchment (Uttarkashi) in Garhwal
D.V.S. Khati, Principal Chief Conservator of Forests and Chief Himalaya. PhD thesis, Hemvati Nandan Bahuguna Garhwal
Wildlife Warden, Uttarakhand, for granting research permission; University, Uttarakhand, India.
Sandeep Kumar, Divisional Forest Officer and former Deputy C O R L AT T I , L., F A T T O R I N I , L. & N E L L I , L. () The use of block
Director, Gangotri National Park, and Shrawan Kumar for their sup- counts, mark–resight and distance sampling to estimate population
port and cooperation; and L. Corlatti for reviewing the manuscript. size of a mountain-dwelling ungulate. Population Ecology, , –.
Oryx, Page 8 of 9 © The Author(s), 2021. Published by Cambridge University Presson behalf of Fauna & Flora International doi:10.1017/S003060532000071X
Downloaded from https://www.cambridge.org/core. IP address: 94.175.106.18, on 31 May 2021 at 09:26:36, subject to the Cambridge Core terms of use, available at
https://www.cambridge.org/core/terms. https://doi.org/10.1017/S003060532000071XDistance sampling with camera traps 9
D E N D U P , P. & L H A M , C. () Winter distribution and poaching of R O Y L E , J.A. () N-mixture models for estimating population size
musk deer, Moschus chrysogaster and Moschus leucogaster in Jigme from spatially replicated counts. Biometrics, , –.
Dorji National Park, Bhutan. International Journal of Conservation R O Y L E , J.A. & N I C H O L S , J.D. () Estimating abundance from
Science, , –. repeated presence–absence data or point counts. Ecology, , –.
F O R S Y T H , D.M. & H I C K L I N G , G.J. () An improved technique for S AT H YA K U M A R , S. () Habitat ecology of major ungulates in
indexing abundance of Himalayan thar. New Zealand Journal of Kedarnath Musk Deer Sanctuary. PhD thesis, Saurashtra University,
Ecology, , –. Rajkot, Gujrat, India.
G R E E N , M.J.B. () Aspects of the ecology of the Himalayan musk S AT H YA K U M A R , S. & B H AT N A G A R , Y.V. () Mountain Ungulates
deer. PhD thesis, University of Cambridge, Cambridge, UK. ENVIS Bulletin: Wildlife and Protected Areas. Wildlife Institute of
H O F M E E S T E R , T.R., R O W C L I F F E , J.M. & J A N S E N , P.A. () A simple India, Dehradun, India.
method for estimating the effective detection distance of camera SATHYAKUMAR, S., B H AT T AC H A R Y A , T., B A S H I R , T. & P O U DY A L , K.
traps. Remote Sensing in Ecology and Conservation, , –. (a) Developing Spatial Database on the Mammal
H O W E , E.J., B U C K L A N D , S.T., D E S P R É S -E I N S P E N N E R , M.L. & K Ü H L , Distributions and Monitoring Programme for Large Carnivores,
H.S. () Distance sampling with camera traps. Methods in Prey Populations, and their Habitats in Khangchendzonga
Ecology and Evolution, , –. Biosphere Reserve. Project report, Wildlife Institute of India,
H O W E , E.J., B U C K L A N D , S.T., D E S P R É S -E I N S P E N N E R , M.L. & K Ü H L , Dehradun, India.
H.S. () Model selection with overdispersed distance sampling S AT H YA K U M A R , S., G O P A L , S.R. & J O H N S I N G H , A.J.T. (b) Musk
data. Methods in Ecology and Evolution, , –. deer. In Mammals of South Asia. Volume (eds A.J.T. Johnsingh &
J A R V I S , A., G U E VA R A , E., R E U T E R , H.I. & N E L S O N , A.D. () N. Manjrekar), pp. –. Universities Press, Hyderabad, India.
Hole-Filled SRTM for the Globe, Version . CGIAR-CSI SRTM S AT H YA K U M A R , S. & M A L I K , P.K. (). Release of Captive
m Database, CGIAR Consortium for Spatial Information. Himalayan Musk Deer in Kedarnath Wildlife Sanctuary, Western
srtm.csi.cgiar.org [accessed August ]. Himalaya. Final report, Wildlife Institute of India, Dehradun, India.
K I T T U R , S., S AT H YA K U M A R , S. & R AWAT , G.S. () Assessment of S C H A L L E R , G.B., J U N R A N G , R. & M I N G J I A N G , Q. () Status of the
spatial and habitat use overlap between Himalayan tahr and snow leopard Panthera Uncia in Qinghai and Gansu Provinces,
livestock in Kedarnath Wildlife Sanctuary, India. European China. Biological Conservation, , –.
Journal of Wildlife Research, , –. S I N G H , N.J. & M I L N E R -G U L L A N D , E.J. () Monitoring ungulates
K U E H L , H.S., T O D D , A., B O E S C H , C. & W A L S H , P.D. () in Central Asia: current constraints and future potential. Oryx,
Manipulating decay time for efficient large-mammal density , –.
estimation: gorillas and dung height. Ecological Applications, S U L K AVA , R.T. & L I U K KO , U.M. () Use of snow-tracking methods
, –. to estimate the abundance of otter (Lutra lutra) in Finland with
K U M A R , A., A D H I K A R I , B.S. & R AWAT , G.S. () Biogeographic evaluation of one-visit census for monitoring purposes. Annales
delineation of the Indian trans-Himalaya: need for revision. Zoologici Fennici, , –.
Current Science, , –. S U R Y AWA N S H I , K.R., B H AT N A G A R , Y.V. & M I S H R A , C. () Why
L A I N G , S.E., B U C K L A N D , S.T., B U R N , R.W., L A M B I E , D. & A M P H L E T T , should a grazer browse? Livestock impact on winter resource use
A. () Dung and nest surveys: estimating decay rates. Journal by bharal Pseudois nayaur. Oecologia, , –.
of Applied Ecology, , –. S U R Y AWA N S H I , K.R., B H AT N A G A R , Y.V. & M I S H R A , C. ()
M C C A R T H Y , K.P., F U L L E R , T.K., M I N G , M., M C C A R T H Y , T.M., Standardizing the double-observer survey method for estimating
W A I T S , L. & J U M A B A E V , K. () Assessing estimators of snow mountain ungulate prey of the Endangered snow leopard. Oecologia,
leopard abundance. Journal of Wildlife Management, , –. , –.
M C N A U G H T O N , S.J. () Grazing as an optimization process: grass– S U R Y AWA N S H I , K.R., K H A N YA R I , M., S H A R M A , K., L K H A G VA J AV , P. &
ungulate relationships in the Serengeti. The American Naturalist, M I S H R A , C. () Sampling bias in snow leopard population
, –. estimation studies. Population Ecology, , –.
M I S H R A , C., VA N W I E R E N , S.E., K E T N E R , P., H E I T KO N I G , I.M.A. & S U R Y AWA N S H I , K.R., M U D A P P A , D., K H A N Y A R I , M., R A M A N , T.R.S.,
P R I N S , H.H.T. () Competition between domestic livestock and R A T H O R E , D., K U M A R , M.A. & P AT E L , J. () Population
wild bharal Pseudois nayaur in the Indian trans-Himalaya. Journal assessment of the Endangered Nilgiri tahr Nilgiritragus hylocrius
of Applied Ecology, , –. in the Anamalai Tiger Reserve, using the double-observer survey
N A M G A I L , T., F O X , J.L. & B H AT N A G A R , Y.V. () Habitat shift and method. Oryx, , –.
time budget of the Tibetan argali: the influence of livestock grazing. T A K E S H I T A , K., I K E D A , T., T A K A H A S H I , H., Y O S H I D A , T., I G O TA , H.,
Ecological Research, , –. M AT S U U R A , Y. & K A J I , K. () Comparison of drive counts and
O’N E I L L , H. () Designing robust ranger based monitoring mark-resight as methods of population size estimation of highly
strategies for the saiga antelope Saiga tatarica tatarica. PhD thesis, dense sika deer (Cervus Nippon) populations. PLOS ONE,
Imperial College London, London, UK. , e.
P A L , R., T H A K U R , S., A R Y A , S., B H AT TA C H A R YA , T. & S AT H Y A K U M A R , T H O M A S , L., B U C K L A N D , S.T., R E X S TA D , E.A., L A A K E , J.L.,
S. () Mammals of the Bhagirathi basin, Western Himalaya: S T R I N D B E R G , S., H E D L E Y , S.L. et al. () Distance software: design
understanding distribution along spatial gradients of habitats and and analysis of distance sampling surveys for estimating population
disturbances. Oryx, published online July . size. Journal of Applied Ecology, , –.
P R A T E R , S.H. () The Book of Indian Mammals. Bombay Natural T I M M I N S , R.J. & D U C K W O R T H , J.W. () Moschus leucogaster. In
History Society, Mumbai, India. The IUCN Red List of Threatened Species : e.TA.
R O D G E R S , W.A., P A N WA R , H.S. & M AT H U R , V.B. () Wildlife dx.doi.org/./IUCN.UK.-.RLTS.TA.en
Protected Area Network in India: A Review. Executive summary, [accessed June ].
st edition. Wildlife Institute of India, Dehradun, India. Y O C C O Z , N.G., N I C H O L S , J.D. & B O U L I N I E R , T. () Monitoring of
R O V E R O , F. & Z I M M E R M A N N , F. () Camera Trapping for Wildlife biological diversity in space and time. Trends in Ecology &
Research. Pelagic Publishing Ltd, Exeter, UK. Evolution, , –.
Oryx, Page 9 of 9 © The Author(s), 2021. Published by Cambridge University Presson behalf of Fauna & Flora International doi:10.1017/S003060532000071X
Downloaded from https://www.cambridge.org/core. IP address: 94.175.106.18, on 31 May 2021 at 09:26:36, subject to the Cambridge Core terms of use, available at
https://www.cambridge.org/core/terms. https://doi.org/10.1017/S003060532000071XYou can also read