Global Ecology and Conservation - Biofund
←
→
Page content transcription
If your browser does not render page correctly, please read the page content below
Global Ecology and Conservation 18 (2019) e00627

                                                      Contents lists available at ScienceDirect

                                            Global Ecology and Conservation
                                   journal homepage: http://www.elsevier.com/locate/gecco

Original Research Article

Cost-benefit analysis of increasing sampling effort in a baited-
camera trap survey of an African leopard (Panthera pardus)
population
Allan Tarugara a, b, *, Bruce W. Clegg a, Edson Gandiwa b, Victor K. Muposhi b
a
    Malilangwe Wildlife Reserve, Private Bag 7085, Chiredzi, Zimbabwe
b
    School of Wildlife Ecology and Conservation, Chinhoyi University of Technology, Private Bag 7724, Chinhoyi, Zimbabwe

a r t i c l e i n f o                                  a b s t r a c t

Article history:                                       The use of baits at camera trap stations has been shown to increase capture rates in
Received 7 February 2019                               population surveys of large carnivores. This study set out to establish the most cost-
Received in revised form 9 April 2019                  effective density and duration of sampling for baited-camera trapping (BCT) of leopards
Accepted 9 April 2019
                                                       in a semi-arid savanna environment. To determine this, we used batches of 30 BCT stations
                                                       (sampling occasions) to survey a population of leopards (Panthera pardus) at Malilangwe
                                                       Wildlife Reserve in south-eastern Zimbabwe from July to October 2017. We applied
                                                       combinations of low to high sampling densities (2e7 occasions) and short to long sam-
                                                       pling durations (2e14 days) and observed the effects on population estimates and cost of
                                                       conducting the survey. Sixty-one leopards were identified from 4596 photographs
                                                       collected over 2940 camera days. At the highest level of sampling (7 occasions and 14
                                                       days), 50 out of the 61 recorded individuals were captured more than twice indicating a
                                                       near-complete survey, so the population estimate at this level (61; 95% CI ¼ 61e67) was
                                                       used as a benchmark to gauge accuracy of estimates from lower levels of effort. Accuracy
                                                       and precision of population estimates stabilized over a range of efforts with 4 occasions
                                                       and 9 days being the most cost-effective and sampling beyond this point incurring
                                                       increased costs but negligible benefits. A minimum cost of US$47 km2 was required to
                                                       obtain a reliable estimate with running costs responding more to changes in sampling
                                                       density than sampling duration. We concluded that using BCT stations at a density of 0.24
                                                       cameras km2 for 9 days is optimal for censusing leopards in semi-arid savannas. Con-
                                                       ducting a cost-benefit analysis may help researchers allocate resources and time within
                                                       budget and technical constraints, ensuring that effort is not expended beyond what is
                                                       economically or ecologically necessary.
                                                       © 2019 The Authors. Published by Elsevier B.V. This is an open access article under the CC
                                                                          BY-NC-ND license (http://creativecommons.org/licenses/by-nc-nd/4.0/).

1. Introduction

   Ecologists use census data to make informed decisions regarding the management of wildlife populations (Bissett et al.,
2012; Roy et al., 2016). This is especially important where the target species is of conservation concern, such as leopards

  * corresponding author. Malilangwe Wildlife Reserve, Private Bag 7085, Chiredzi, Zimbabwe.
    E-mail addresses: allantarugara@gmail.com (A. Tarugara), bruce@malilangwe.org (B.W. Clegg), egandiwa@gmail.com (E. Gandiwa), vkmuposhi@gmail.
com (V.K. Muposhi).

https://doi.org/10.1016/j.gecco.2019.e00627
2351-9894/© 2019 The Authors. Published by Elsevier B.V. This is an open access article under the CC BY-NC-ND license (http://creativecommons.org/
licenses/by-nc-nd/4.0/).
2                                   A. Tarugara et al. / Global Ecology and Conservation 18 (2019) e00627

(Panthera pardus Linnaeus, 1758), which are currently listed as vulnerable by the International Union for the Conservation of
Nature (IUCN, 2018). Censusing leopard populations has traditionally been done using spoor and scat counts (Stander, 1998).
However, due to the species' solitary and elusive nature, estimates from these methods are often unreliable (Gusset and
Burgener, 2005; Pirie et al., 2015). Since Karanth (1995) pioneered the use of camera-traps to estimate tiger (Panthera
tigris) numbers in India, population studies of carnivore species that were previously difficult to survey have increased rapidly
(Sollmann et al., 2013; O'Connor et al., 2017). Advances in digital camera technology have also promoted the wide-scale
adoption of the methodology by increasing portability and lowering hardware costs (Rovero et al., 2013; Trolliet et al.,
2014). Camera-trapping is currently the most successful tool available to survey individually identifiable cats (Royle et al.,
2017; Devens et al., 2018).
    An understanding of how changes in sampling effort influence the accuracy and precision of population estimates is
especially important for species that are difficult to survey (Si et al., 2014). Camera-trap surveys of rare or elusive carnivores
usually suffer from low capture rates (Belbachir et al., 2015; Braczkowski et al., 2016; Rocha et al., 2016). This is a concern,
because a low sample size precludes in depth population analyses (O'Connell et al., 2010; Tobler et al., 2013). To improve
capture rates, researchers have increased sampling intensity (Sun et al., 2014; Brassine and Parker, 2015), extended sampling
periods (Tobler et al., 2013; Gerber et al., 2014) and adopted the use of baits at camera stations (Gerber et al., 2012; Grant,
2012; du Preez et al., 2014; Roy et al., 2016).
    Baited camera-trapping (BCT) has been shown to improve capture rates of leopards (du Preez et al., 2014). However,
optimal density and duration of sampling for BCT has not been determined. Since increasing sampling effort has cost im-
plications, establishing the optimal sampling intensity for different environments is an important step towards improving the
cost effectiveness of the BCT method. We hypothesised that increasing sampling effort would initially result in significant
improvements to the accuracy and precision of population estimates, but a point would be reached beyond which further
gains are negligible. Given that high levels of sampling would also increase the cost of the survey, what then is the optimal
sampling effort for BCT for leopards in different savanna environments? This study sought to fill this information gap by
testing the effect of varying sampling effort in a semi-arid Zimbabwean savanna. Our objectives were twofold, first we tested
the effect of different combinations of sampling density and duration on the accuracy and precision of population estimates
and second, we carried out a cost-benefit analysis to determine the optimal sampling density and duration for BCT for
leopards in the study environment.

2. Material and methods

2.1. Study area

   The study was conducted at Malilangwe Wildlife Reserve (MWR), a medium-sized (490 km2), fenced, protected area in
south-eastern Zimbabwe (20 580 and 21150 S and 31470 and 32 010 E) (Fig. 1). MWR is a non-hunting property whose main
objectives are conservation, ecotourism, and community development. Altitude ranges from 290 m to 500 m above sea level
(Traill and Bigalke, 2007). Rainfall, which is highly variable (mean ¼ 565 mm per annum, n ¼ 66, CV ¼ 34%), is seasonal, with
approximately 84% falling between November and March. Droughts are frequent. The average minimum and maximum
monthly temperatures range from 13.4  C (July) to 23.7  C (December), and 23.2  C (June) to 33.9  C (November), respectively
(Clegg, 2010).
   Alluvium, forest sandstone, gneiss and basalt are the dominant geological substrates. Vegetation cover is diverse, ranging
from grassland to dry, deciduous woodland, with 38 vegetation types occurring on soils ranging from 90% sand to 40% clay
(Clegg and O'Connor, 2012). The main prey species (density in parentheses) are impala (Aepyceros melampus, 13.6 km2), nyala
(Tragelaphus angasii, 0.38 km2) and bushbuck (Tragelaphus sylvaticus, 0.22 km2). Competing predators include lion (Pan-
thera leo, n ¼ 48), spotted hyena (Crocuta, n ¼ 60), wild dog (Lycaon pictus, n ¼ 27) and cheetah (Acinonyx jubatus, n ¼ 11)
(Clegg, 2017).

2.2. Ethical considerations

   To collect home range data, five male and five female leopards were trapped and fitted with Followit Global Positioning
System (GPS) collars (Followit, Lindesberg, Sweden) from May 07 to June 20, 2017. Immobilization procedures were carried
out by a certified para-veterinarian (license number: 2017/25) following professional guidelines stipulated by the American
Society of Mammalogists (Sikes and Animal Care and Use Committee of the American Society of Mammalogists, 2016). Impala
meat was used as bait and culling was done by licensed hunters in accordance with Zimbabwean regulations (Government of
Zimbabwe, 1975). MWR has a healthy impala population (±6658 over 490 km2) (Clegg, 2017) and the number taken off as
baits did not exceed the annual management quota of 300. All animal handling operations in this study were cleared by the
Chinhoyi University of Technology Ethics Committee (clearance certificate number: 01/17).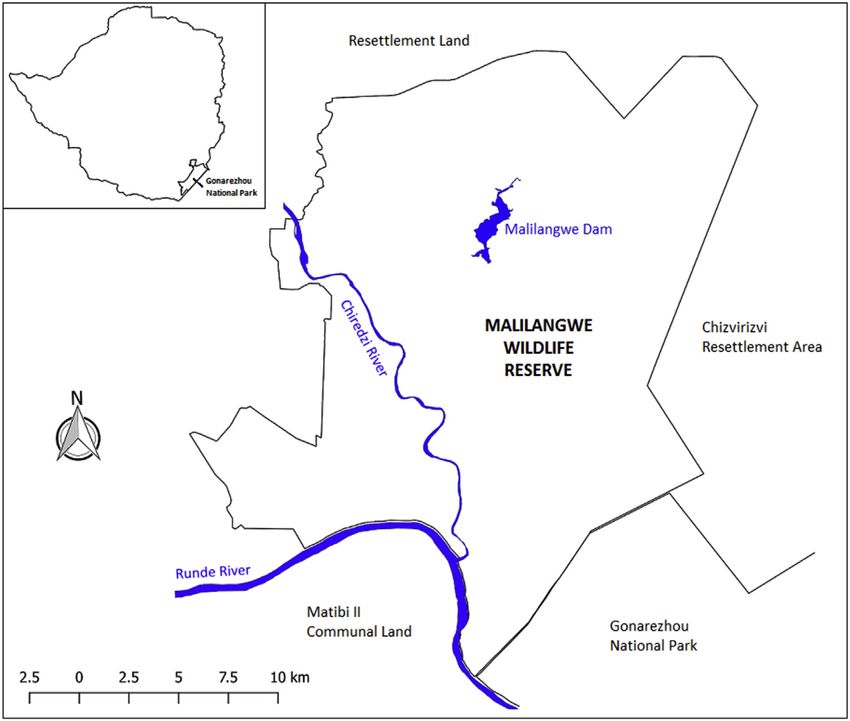
A. Tarugara et al. / Global Ecology and Conservation 18 (2019) e00627                    3

                         Fig. 1. Map showing the location of study area, Malilangwe Wildlife Reserve, south-east Zimbabwe.

2.3. Study design for investigating effect of survey effort on population estimates

2.3.1. Density and positioning of baited-camera traps
    Data were collected over seven sampling occasions. Each occasion comprised a 14-day period during which 30 baited-
camera traps were setup across the study area. To avoid bias, each set of 30 baits was evenly distributed across the
reserve in a stratified-random pattern. This was done by overlaying a grid of 210 squares (each representing 1.53  1.53 km)
onto the study area map in Quantum GIS v2.18 (QGIS Development Team, 2016) and then subsampling the grid, without
replacement, to obtain 7 sets of 30 evenly distributed squares. In each square, a sample point was placed at random. A baited
camera trap was then setup at the closest road intersection to this point. This was done to increase the probability of the bait
being found because leopards frequently move along roads (Funston et al., 2010; Mills et al., 2013). In squares without road
intersections, the baited-camera trap was placed next to the closest road. In cases where there were no roads, placement was
as close as possible to the nearest road in one of the adjoining grid cells. Since trap sites were visited using a vehicle, placing
them near roads facilitated access and also complied with MWR's policy of no off-road driving. Sampling intensity was
incrementally increased by 0.06 cameras km2 every 14 days, starting at an initial camera density of 0.06 cameras km2 (30
stations) and ending at a maximum of 0.43 cameras km2 (210 stations).
    Collared individuals were tracked in the field using VHF telemetry and GPS data downloaded with a UHF receiver (August
08, 2017 to January 29, 2018). These data were used to calculate home range sizes using 95% kernel density estimation in QGIS.
Knowledge of home range sizes of leopards is important as it is informative on detection rates at different camera spacings
(Wegge et al., 2004; Maffei et al., 2011).

2.3.2. Camera-trap setup
    Bait sites were located in the field using a GPS device. Impala intestines soaked in blood and stomach contents were
dragged along the road for the last 300 m of the route to the site in anticipation that leopards would pick up the scent and
follow the trail. At the site, two trees spaced 2e4 m apart were selected; one for the bait and the other for the camera. A
skinned impala carcass was secured to the bait tree with wire. Skinning prolonged bait life by delaying decomposition. A
forked leading pole was placed against the bait-tree to provide easy access for leopards (Fig. 2). To prevent feeding by spotted
hyena, baits were hung such that the back legs of the carcass were at least 2 m above the ground. Baits were also covered with
leafy branches to camouflage them from vultures. A Cuddeback C2 infra-red camera (Cuddeback, WI, USA), housed in a metal
box for protection, was secured to the camera tree to the right of each bait, with its line of sight at 90 to the leading pole.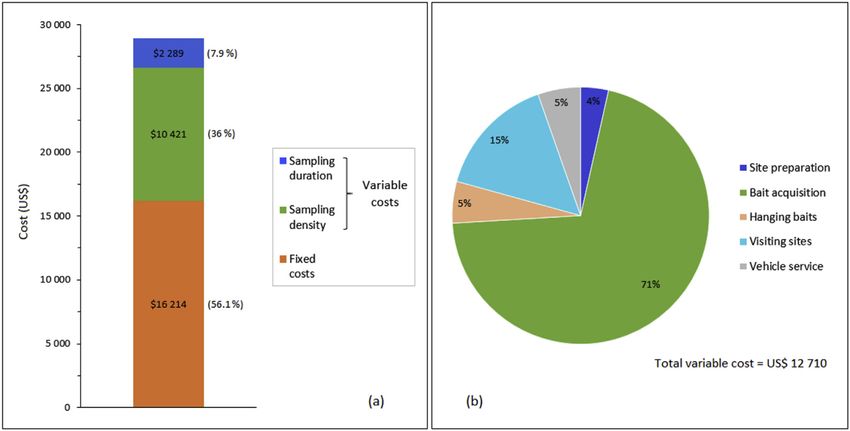
4                                    A. Tarugara et al. / Global Ecology and Conservation 18 (2019) e00627

                                  Fig. 2. Arrangement of bait, leading pole and camera for the BCT method.

When a leopard climbed up the pole to feed, the sensor triggered the camera and a photograph was taken. Due to its position
to the right of the leading pole, the camera consistently took a photograph of the animal's right profile (Grant, 2012). The
minimum interval between photographs was set to 1 min and the picture quality to 5 megapixels. Camera-trapping began
with sampling occasion 1 and then progressed to occasions 2, 3, 4 up to 7. Logistical constraints prevented all 30 baited-
cameras being setup in a single day, so this was done in batches of 15 over two consecutive days. Baits that were removed
by lions before leopards encountered them were replaced. Trapping stations were visited every third day and photographs
downloaded from the cameras. On the 15th day, baits were taken down, memory cards erased and the cameras moved to the
sites for the next sampling occasion. Camera trapping was done in 98 days, from the 1st of July to the 22nd of October 2017.

2.4. Determining survey cost

    For each day of fieldwork, the time spent (in hours), distance travelled (kilometres) and personnel involved were recorded.
This information was used to calculate the fuel and labour costs of site preparation, culling of impala, hanging, monitoring and
removal of baits and vehicle services. Fixed (hardware) and variable (running) costs were calculated separately. Following du
Preez et al. (2014), a 10% contingency was added to fixed costs to cater for failure and destruction of equipment. For each
sampling occasion, 40 impala baits were required, 30 for hanging and 10 for replacements. In this study, baits were not a cost
as they were provided free by MWR. However, such may not be the case for other studies as bait of other forms may need to be
procured. To cater for this, we assigned the value (US$30) of a goat (Capra hircus) (most affordable and accessible alternative
to impala) to each bait in our cost calculations, following Balme et al. (2014). BCT requires a minimum of two people to carry
out the work and labour cost was calculated using the hourly rate for the lowest paid employee at MWR.

2.5. Data analyses

   Photographs were scrutinised, and individual leopards identified from their unique spot patterns. The resulting identikit
was used to construct capture histories for each combination of sampling density (2e7 occasions) and duration (2e14 days).
The histories were then fed into CAPTURE software (White and Burnham, 1999) and population estimates, with 95% confi-
dence intervals, generated for each density-duration combination using maximum likelihood capture-recapture analyses. A
constant capture probability model was used to ensure comparability between population estimates. The probability (P) of
detecting a leopard present at the time of the survey was calculated as;
              .
      P ¼ Mtþ1 Nb;

Where Mtþ1 ¼ total number of leopards identified by the survey, and Nis  b the population estimate (Anwar et al., 2010; Sharma
and Jhala, 2011).
    Trap stations were visited at 3-day intervals so costs (US$) were calculated for each level of sampling density at durations
of 3, 6, 9, 12 and 14 days. The relative influence of sampling density and duration on total cost was investigated by comparing
standardized coefficients derived using the multiple linear regression routine of SPSSv16 (SPSS Inc, 2007). The relationship
between cost and the accuracy and precision of the reliable population estimates was then explored by overlaying the
population estimates onto a contoured cost surface.
A. Tarugara et al. / Global Ecology and Conservation 18 (2019) e00627                           5

3. Results

    Two hundred and ten baited-camera trap sites collected data over seven, 14-day, sampling occasions, over a period of 98
days. The cumulative survey effort was 2940 camera-days and of these, 17 were lost to camera failure. All cases of camera
failure were due to elephant (Loxodonta africana) damage. Lions and vultures (Gyps spp.) often robbed baits, while hyenas
sometimes knocked off the leading pole. A total of 7070 photographs of leopards were recorded, with 65% being usable for
individual identification. Each leopard's spot patterns were unique and as such the right flank of each individual leopard was
different to any other animal. If the right-side profile was photographed, individuals could be unambiguously distinguished
from each other. This applied even where the photographs contained partial shots of a leopard or when posture varied. The
leading pole ensured that feeding leopards were consistently aligned broadside in photographs, thereby revealing the
presence or absence of male external genitalia (du Preez et al., 2014). In this way, the sex of each adult individual was easily
determined. A total of 61 individual leopards (Mtþ1), (33 females, 23 males and 5 sub-adults), were photographed over the
study period (Table 1) and of these, 50 were captured 2 or more times. The adult sex ratio was 1 male to 1.4 females. Because
the scrotum is less distinct in males
6                                             A. Tarugara et al. / Global Ecology and Conservation 18 (2019) e00627

Fig. 3. Response of population estimates to increasing sampling density (sampling occasions) and duration (days). Maps depict positions of the baited-camera
traps for the different levels of sampling density. Error bars represent 95% confidence intervals calculated by CAPTURE. The region of stabilized estimates is shown
in red. The dashed horizontal line represents the assumed true population. (For interpretation of the references to colour in this figure legend, the reader is
referred to the Web version of this article.)

Table 2
Fixed costs for the study.

                                  number                     US$
Equipment
                                                             unit price                   Sub-total                   Contingency (10%)                  Total
    Camera traps                  30                         339                          10 170                      1017                               11 187
    Metal housing                 30                         69                           2070                        207                                2277
    3-pack mount                  30                         60                           1800                        180                                1980
    Image viewer                  1                          143                          143                         14.3                               157.3
    8G SD cards                   30                         8                            240                         24                                 264
    Batteries (AA)                480                        0.66                         317                         31.7                               348.7
                                                                                                                                                         16 214

Table 3
Variable costs (US$) for the study. To get total cost, at each combination of sampling density and duration, add the value of fixed costs.

                                                         Sampling duration (days)

                                                         3                       6                       9                       12                      14
    Sampling occasion                 1                  1554                    1619                    1685                    1750                    1816
                                      2                  3108                    3239                    3370                    3501                    3631
                                      3                  4662                    4858                    5055                    5251                    5447
                                      4                  6216                    6478                    6739                    7001                    7263
                                      5                  7770                    8097                    8424                    8751                    9078
                                      6                  9324                    9717                    10 109                  10 502                  10 894
                                      7                  10 878                  11 336                  11 794                  12 252                  12 710
A. Tarugara et al. / Global Ecology and Conservation 18 (2019) e00627 7
Fig. 4. Summary of survey costs. Proportion of fixed versus variable costs (a). Categorization of variable costs by activity (b).
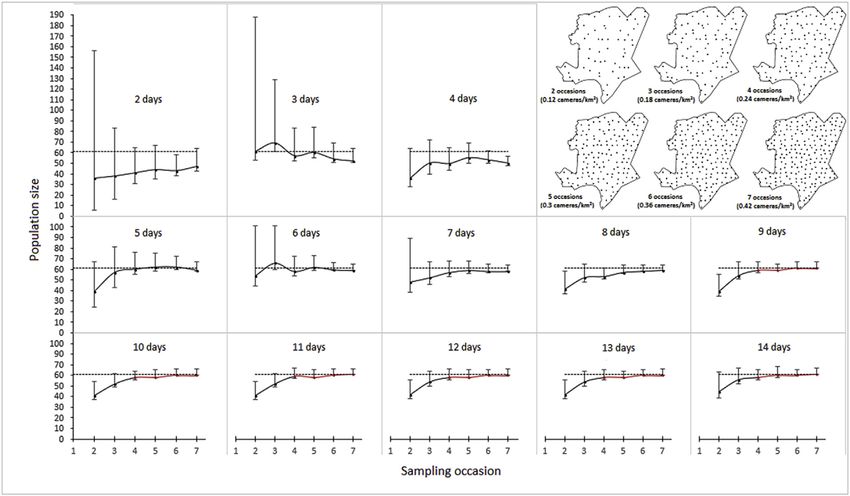
Fig. 5. Contour plot showing the total cost of achieving stabilized population estimates (95% confidence intervals in parentheses) in relation to varying sampling
density (sampling occasions) and duration (days).
4. Discussion
This study investigated the effect of varying sampling density and duration on the accuracy and precision of population
estimates and explored the cost-effective level of sampling for surveying leopards using the BCT method in MWR. Accuracy
and precision of population estimates stabilized over a range of efforts, with 4 occasions and 9 days being the most cost-
effective. Sampling beyond this point resulted in increased costs but negligible benefits. This outcome was expected.8 A. Tarugara et al. / Global Ecology and Conservation 18 (2019) e00627
4.1. Effect of sampling effort on population estimates
Gerber et al. (2014) have shown that when a large proportion of individuals are captured two or more times, the estimate
is likely to be close to the true population. In this study, 50 out of the 61 individuals were captured 2 or more times, indicating
a near-complete survey. It has already been established that high camera densities (Sun et al., 2014; Brassine and Parker,
2015), long sampling durations (Wegge et al., 2004; Si et al., 2014; O'Connor et al., 2017) and use of baits (Grant, 2012; du
Preez et al., 2014; Roy et al., 2016) can increase the probability that most individuals in the population are captured. Even
where detection rates are low, all individuals will eventually be recorded if sampling duration is long enough (Gerber et al.,
2014). In this study, we showed that the required sampling period to achieve a near-complete survey can be significantly
reduced by using a high sampling density of baited-cameras (0.24 km2). With this sampling strategy a near-complete survey
was achieved over an area of 490 km2 in just over a month, which is considerably shorter than most camera surveys for
leopards. A near-complete survey is desirable because there is less reliance on statistical extrapolation, and a short survey
period reduces the risk of violating closure. Baits helped in this regard as leopards were attracted to them, positioned ideally
in front of cameras and stayed at sites for longer, allowing the collection of a large number of identifiable photographs over a
short period of time. Where surveys are near-complete, the true population size, sex ratio and age structure can be confi-
dently estimated. Studies that do not have a reference for the true population often assume that software will correctly
extrapolate results. This study, however, shows that at low samples sizes CAPTURE software may not reliably estimate
population size.
4.2. Relationship between sampling effort and cost
We observed a subtle tradeoff between sampling density and duration that was less intuitive, and when related to cost,
this relationship had implications for the most cost-effective sampling strategy. Accuracy and precision stabilized over a range
of sampling densities and durations but cost over this range varied because the magnitudes of the effects of density and
duration on expense were different. For example, a strategy of 7 days and 5 sampling occasions resulted in a reliable estimate.
If, however, sampling duration was increased to 9 days, then only 4 sampling occasions were required. Given that a unit
increase in sampling density was nine times more expensive than a unit increase in duration, the 9 days and 4 occasions
strategy was the more cost-effective option. It is possible that the two-day increase in duration was long enough to allow
events that may have precluded detection of individuals, such as mating or feeding on a kill, to be completed. In addition,
leopards cover great distances (up to 17 km per night, and 33 km over 24 h) during their search efforts or territorial patrols
(Seidensticker and Lumpkin, 2004). Therefore with 2 baited cameras per smallest leopard home range (9 km2 at MWR) at the
4 sampling occasions level of effort, it is likely that actively roaming leopards that were previously not captured be detected
over two additional days of sampling. Increases in duration beyond 9 days provided no further reduction in cost, because 4
sampling occasions were still required to derive a reliable estimate. For this reason, increasing sampling duration beyond 9
days was not recommended for the study environment.
4.3. Challenges
A potential source of bias was introduced when lions and vultures consumed baits before leopards had an adequate chance
of finding them. Lions could ably climb trees and all attempts to prevent them from accessing baits failed. Continual
replenishment of baits would appear to be the only solution to this problem. Hyenas often visited camera stations and
sometimes knocked over the leading pole in their attempts to feed at the bait. Since the pole facilitated the correct positioning
of a leopard in a photograph, this reduced the number of usable pictures. Poles that had been knocked over were repositioned
during routine monitoring of camera stations. It is possible that activity of competing predators at camera stations may have
prevented some age or sex classes from being recorded. Infra-red cameras traps produce black and white night-time images
and are prone to motion blur. In this study, rosette patterns from both day and night images were sufficiently clear such that
individual leopards were easily identified. Due to the use of baits at camera stations, few images were blurred as leopards
were often stationary when photographed. Over the 14 days of sampling, each camera station therefore provided numerous
photographs of the same leopard from which identification could be made.
Where hunting is practiced, baits are often used to attract leopards and this can lead to baits being associated with risk. A
limitation of the BCT method, therefore, is the possible exclusion of bait-shy leopards from being recorded. However, in a
comparison between baited and unbaited surveys on two sites sampled in a hunting area, du Preez et al. (2014) recorded
more leopards at baited than at unbaited camera stations, suggesting that leopards were not bait-shy. Based on this, we
concluded that the proportion of bait-shy leopards in our non-hunted study population was very low and that our total
estimate of 61 represented a near-complete survey. A survey of this nature is labor and time intensive and logistically difficult
to carry out. Proper preparation and organization are key to effectively carrying out such a survey.
4.4. Implications
Absence of reference cost-structures can limit the adoption or funding of some methodologies. While baited-camera
trapping is costly, its fixed costs are lower than the conventional unbaited approach because, for the same level ofA. Tarugara et al. / Global Ecology and Conservation 18 (2019) e00627 9
sampling, only half the number of cameras are required (du Preez et al., 2014). Additionally, running costs of unbaited camera
surveys can be higher as sampling periods must be extended to collect sufficient data because of the low detection rates. Baits,
which are a key component of the BCT technique, constituted a significant proportion of cost (31% of total and 71% of running
costs). If baits can be acquired for free or at a cheaper price, this can significantly lower costs. Nevertheless, it is our position
that the benefits realized from using baits in this study outweigh the cost of their procurement. We believe that the large
number of identifiable pictures collected and high capture rates would not have been possible without baits. Where appli-
cable, we therefore recommend using baits to improve capture rates.
The study was conducted in a semi-arid tropical savanna and the findings may have relevance for leopard surveys in
similar environments. Although we cannot extensively comment on the generalizability of BCT, we believe that the meth-
odology presented here may be applicable for similarly marked, individually identifiable carnivores such as jaguar (Panthera
onca), ocelot (Leopardalis pardus) and clouded leopards (Neofelis nebulosa). The BCT method may be limited when surveying
tigers and snow leopards (Panthera uncia). Although tigers may readily take baits, it is likely that they do not balance well on a
leading pole because they are heavy. In this study, it was noted that where lions visited camera sites they could not balance on
the leading pole and therefore tigers being larger, may have the same challenge. In the case of snow leopards, BCT may not be
suitable due to the lack of adequate trees in the environment in which they exist.
The potential of the BCT method to provide novel data on leopards requires further investigation. Because the method
ensures that individuals are consistently positioned at right angles to a camera's field of view, there may be scope for
measuring morphometric dimensions of leopards from photographs collected by BCT. In addition, feeding at baits may
simulate natural kills and by coupling camera data with GPS collar telemetry gender differences in leopard behavior and
interspecific carnivore interactions around baits could be explored.
5. Conclusions
Baited-camera trapping can improve the amount and quality of data collectable from leopard surveys. We concluded that
using baited-camera stations at a density of 0.24 km2 for 9 days is optimal and cost effective for BCT surveys of leopards in
semi-arid environments. This study confirmed our hypothesis that increasing sampling effort initially improves the accuracy
and precision of population estimates, but a point will be reached beyond which further gains are negligible. Conducting a
cost-benefit analysis may help researchers allocate resources and time within budget and technical constraints, ensuring that
effort is not expended beyond what is economically or ecologically necessary. This study is the first to robustly investigate the
interplay between sampling effort, accuracy and precision of estimates, and cost in BCT surveys of large carnivores.
Conflicts of interest
The authors declare no conflict of interest.
Acknowledgements
We thank The Malilangwe Trust for funding this research and Chinhoyi University of Technology for granting the ethical
clearance. We acknowledge Dusty Joubert for conceptualizing the baited camera-trapping method and Colin Wenham for
immobilizing target leopards for collaring. Philmon Chivambu, Nathan Chinhondo and Pandeni Chitimela for assistance in
data collection. The authors declare no competing interests.
References
Anwar, M., Kumar, H., Vattakaven, J., 2010. Status of Tigers in Pilibhit Forest Division, Terai Arc Landscape. WWF-India, Uttar Pradesh, India, pp. 1e44.
Balme, G., Hunter, L., Braczkowski, A., 2012. Applicability of age-based hunting regulations for African leopards. PLoS One 7, e35209.
Balme, G., Hunter, L., Robinson, H., 2014. Baited camera-trap surveys e marginally more precise but at what cost? A response to du Preez et al. Biol. Conserv.
179, 144e145.
Belbachir, F., Pettorelli, N., Wacher, T., Belbachir-Bazi, A., Durant, S.M., 2015. Monitoring rarity: the critically endangered Saharan cheetah as a flagship
species for a threatened ecosystem. PLoS One 10, e0115136.
Bissett, C., Bernard, R., Parker, D., 2012. The response of lions (Panthera leo) to changes in prey abundance on an enclosed reserve in South Africa. Acta
Theriol. 57, 225e231.
Braczkowski, A.R., Balme, G.A., Dickman, A., Fattebert, J., Johnson, P., Dickerson, T., Macdonald, D.W., Hunter, L., 2016. Scent lure effect on camera-trap based
leopard density estimates. PLoS One 11, e0151033.
Brassine, E., Parker, D., 2015. Trapping elusive cats: using intensive camera trapping to estimate the density of a rare african felid. PLoS One 10, 1e15.
Clegg, B., O'Connor, T., 2012. The vegetation of Malilangwe wildlife reserve, south-eastern Zimbabwe. Afr. J. Range Forage Sci. 29, 109e131.
Clegg, B.W., 2010. Habitat and Diet Selection by the African Elephant at the Landscape Level: a Functional Integration of Multi-Scale Foraging Processes.
University of the Witwatersrand, p. 180.
Clegg, B.W., 2017. Large Mammal Population Estimates for Malilangwe Wildlife Reserve: 5th - 14th October 2017. Internal Management Report for the
Malilangwe Trust, p. 41.
Devens, C., Tshabalala, T., McManus, J., Smuts, B., 2018. Counting the spots: the use of a spatially explicit captureerecapture technique and GPS data to
estimate leopard (Panthera pardus) density in the Eastern and Western Cape, South Africa. Afr. J. Ecol. 1e10.
du Preez, B.D., Loveridge, A.J., Macdonald, D.W., 2014. To bait or not to bait: a comparison of camera-trapping methods for estimating leopard Panthera
pardus density. Biol. Conserv. 176, 153e161.
Funston, P., Frank, L., Stephens, T., Davidson, Z., Loveridge, A., Macdonald, D., Durant, S., Packer, C., Mosser, A., Ferreira, S., 2010. Substrate and species
constraints on the use of track incidences to estimate African large carnivore abundance. J. Zool. 281, 56e65.10 A. Tarugara et al. / Global Ecology and Conservation 18 (2019) e00627
Gerber, B.D., Ivan, J.S., Burnham, K.P., 2014. Estimating the abundance of rare and elusive carnivores from photographic-sampling data when the population
size is very small. Popul. Ecol. 56, 463e470.
Gerber, B.D., Karpanty, S.M., Kelly, M.J., 2012. Evaluating the potential biases in carnivore capture-recapture studies associated with the use of lure and
varying density estimation techniques using photographic-sampling data of the Malagasy civet. Popul. Ecol. 54, 43e54.
Government of Zimbabwe, 1975. Parks and Wild Life Act (Amended 1982). Government Printer, Harare, p. 103.
Grant, T.-L., 2012. Leopard Population Density, Home Range Size and Movement Patterns in a Mixed Landuse Area of the Mangwe District of Zimbabwe.
Rhodes University, p. 134.
Gusset, M., Burgener, N., 2005. Estimating larger carnivore numbers from track counts and measurements. Afr. J. Ecol. 43, 320e324.
IUCN, 2018. The IUCN Red List of Threatened Species. Version 2018-1. Downloaded on 03 September 2018.
Karanth, K.U., 1995. Estimating tiger Panthera tigris populations from camera-trap data using capture-recapture models. Biol. Conserv. 71, 333e338.
Maffei, L., Noss, A.J., Silver, S.C., Kelly, M.J., 2011. Abundance/density case study: jaguars in the Americas. In: O'Connell, A.F., Nichols, J.D., Karanth, K.U. (Eds.),
Camera Traps in Animal Ecology: Methods and Analyses. Springer, pp. 119e144.
Mills, L.S., Tempa, T., Cheng, E., 2013. Wildlife Research Techniques in Rugged Mountainous Asian Landscapes.
O'Connell, A.F., Nichols, J.D., Karanth, K.U., 2010. Camera Traps in Animal Ecology: Methods and Analyses. Springer Science & Business Media.
O'Connor, K.M., Nathan, L.R., Liberati, M.R., Tingley, M.W., Vokoun, J.C., Rittenhouse, T.A., 2017. Camera trap arrays improve detection probability of wildlife:
investigating study design considerations using an empirical dataset. PLoS One 12, e0175684.
Pirie, T.J., Thomas, R.L., Fellowes, M.D.E., 2015. Limitations to recording larger mammalian predators in savannah using camera traps and spoor. Wildl. Biol.
22, 13e21.
QGIS Development Team, 2016. QGIS Geographic Information System. Open Source Geospatial Foundation version 2.18.
Rocha, D., Ramalho, E., Magnusson, W., 2016. Baiting for carnivores might negatively affect capture rates of prey species in camera-trap studies. J. Zool. 300,
205e212.
Rovero, F., Zimmermann, F., Berzi, D., Meek, P., 2013. Which camera trap type and how many do I need?" A review of camera features and study designs for a
range of wildlife research applications. Hystrix 24, 148e156.
Roy, M., Qureshi, Q., Naha, D., Sankar, K., Gopal, R., Jhala, Y.V., 2016. Demystifying the Sundarban tiger: novel application of conventional population
estimation methods in a unique ecosystem. Popul. Ecol. 58, 81e89.
Royle, J.A., Gopalaswamy, A.M., Dorazio, R.M., Nichols, J.D., Jathanna, D., Parameshwaran, R., Karanth, K.U., 2017. Concepts: assessing tiger population
dynamics using capture-recapture sampling. In: Karanth, K.U., Nichols, J.D. (Eds.), Methods for Monitoring Tiger and Prey Populations. Springer, pp.
163e189.
Seidensticker, J., Lumpkin, S., 2004. Cats in Question: the Smithsonian Answer Book. Smithsonian Books.
Sharma, R.K., Jhala, Y.V., 2011. Monitoring tiger populations using intensive search in a capture-recapture framework. Popul. Ecol. 53, 373e381.
Si, X., Kays, R., Ding, P., 2014. How long is enough to detect terrestrial animals? Estimating the minimum trapping effort on camera traps. PeerJ 2 e374.
Sikes, R.S., Animal Care and use committee of the American society of Mammalogists, 2016. 2016 guidelines of the American society of Mammalogists for
the use of wild mammals in research and education. J. Mammal. 97, 663e688.
Sollmann, R., Mohamed, A., Kelly, M.J., 2013. Camera trapping for the study and conservation of tropical carnivores. Raffles Bull. Zool. 28, 21e42.
SPSS Inc, 2007. SPSS Version 16.0. SPSS Incorporated, Chicago, IL.
Stander, P.E., 1998. Spoor counts as indices of large carnivore populations: the relationship between spoor frequency, sampling effort and true density. J.
Appl. Ecol. 35, 378e385.
Sun, C.C., Fuller, A.K., Royle, J.A., 2014. Trap configuration and spacing influences parameter estimates in spatial capture-recapture models. PLoS One 9,
e88025.
Tobler, M.W., Carrillo-Percastegui, S.E., Hartley, A.Z., Powell, G.V., 2013. High jaguar densities and large population sizes in the core habitat of the south-
western Amazon. Biol. Conserv. 159, 375e381.
Traill, L.W., Bigalke, R.C., 2007. A presence-only habitat suitability model for large grazing African ungulates and its utility for wildlife management. Afr. J.
Ecol. 45, 347e354.
Trolliet, F., Vermeulen, C., Huynen, M.-C., Hambuckers, A., 2014. Use of camera traps for wildlife studies: a review. Biotechnol. Agron. Soc. Environ. 18,
446e454.
Wegge, P., Pokheral, C.P., Jnawali, S.R., 2004. Effects of trapping effort and trap shyness on estimates of tiger abundance from camera trap studies. Anim.
Conserv. 7, 251e256.
White, G.C., Burnham, K.P., 1999. Program MARK: survival estimation from populations of marked animals. Bird Study 46, 120e139.You can also read