UVM ScholarWorks University of Vermont
←
→
Page content transcription
If your browser does not render page correctly, please read the page content below
University of Vermont
UVM ScholarWorks

UVM Honors College Senior Theses Undergraduate Theses

2021

Using Twitter to Understand Humor as Stress Relief during the
COVID-19 Outbreak
Matthew B. O'Donnell
University of Vermont

Follow this and additional works at: https://scholarworks.uvm.edu/hcoltheses

Recommended Citation
O'Donnell, Matthew B., "Using Twitter to Understand Humor as Stress Relief during the COVID-19
Outbreak" (2021). UVM Honors College Senior Theses. 425.
https://scholarworks.uvm.edu/hcoltheses/425

This Honors College Thesis is brought to you for free and open access by the Undergraduate Theses at UVM
ScholarWorks. It has been accepted for inclusion in UVM Honors College Senior Theses by an authorized
administrator of UVM ScholarWorks. For more information, please contact donna.omalley@uvm.edu.
Using Twitter to Understand Humor as Stress Relief

 during the COVID-19 Outbreak

 Matthew O’Donnell

 University of Vermont College of Engineering & Mathematical Sciences

 Honors College Thesis

Advisor: Sheila Weaver, Senior Lecturer | Department of Mathematics and Statistics

 2020-2021
1

Abstract 2
Background 3
 Humor as Personal Resiliency 3
 Pitfalls of Humor as Stress Relief 5
 Humor, Social Media, and COVID-19 7
Methods 11
 Data Collection 11
 Relationship Between Tweets and Case Numbers 13
 Exploring Time of Day and Location of English Tweets 15
 Preliminary Sentiment Analysis 17
 COVID-19 Humor and Humor Tendencies Survey 17
 Market Basket Analysis of Twitter Text 19
 Clustering Using K-Means 21
Results and Discussion 24
 Humor Usage in Survey Respondents 24
 Analysis of Self-reported Humorous COVID-19 Topics 27
 Market Basket Analysis 29
 Cluster Analysis 32
Concluding Remarks 35
Acknowledgements 37
References 38
Appendix 1: Survey Questions 42
Appendix 2: Market-Basket Analysis Results 45
Appendix 3: UVM Institutional Review Board Approval of Survey 46
Appendix 4: Research Information and Consent Form for Survey Respondents 47
2

Abstract

 Using humor as a means of deflecting from stress or anxiety is a widely-occurring

practice and takes many different forms, well documented in studies of first-responders or

emergency service personnel, for example. This paper attempts to quantify this phenomenon in

light of the COVID-19 pandemic by analyzing a large body of Tweets between March and June

2020. In the paper, different methods are used to categorize pieces of text and determine whether

humor as a form of personal resiliency occurs on social media, how common this is, and how it

manifests itself. The paper also analyzes an original survey administered to around 200

respondents to explore more specifically how individuals use humor to respond to stress,

particularly dark humor, and what Covid-related topics were sources of humor.
3

Background

Humor as Personal Resiliency

One of the ever-present elements of human psychology and interaction is the tendency to use

humor to cope with difficult or stressful situations. Studies on personal resiliency, psychological

wellbeing and quality of life, especially during times of stress or adversity, have documented the

use of humor to cope with extremely traumatic events often encountered by emergency service

personnel like police, firefighters, or those in medical settings (Kuiper, 2012). People who work

in stressful environments or undergo a traumatic event are frequently found to employ humor to

relieve tension and to promote this sense of personal resiliency. This type of humor is often

characterized as “dark” or “gallows” humor, or humor that makes light of a situation others may

find to be taboo or painful to discuss otherwise. Observational studies involving such workers in

high-stress settings are limited; moreover, despite being high in ecological validity, they lack an

experimental control needed to draw any firm conclusions (Kuiper, 2012). They do seem to

indicate a phenomenon that many of us know to be true: reacting to negative situations with

humor (or even irreverence) is a powerful technique in our arsenal and is omnipresent in a

society with its fair share of anxiety-inducing moments.

 A notable example of this usage of humor was reported in a 2001 study, in which 62

repatriated Vietnam prisoners-of-war were interviewed 25 years after the conclusion of the

Vietnam War. Over half of the veterans in the study showed very little psychological or social

problems, and humor seems to have played a major role in their prevention (Henman, 2001).

While trapped inside the prisoner camps, the VPOWs taught themselves to weaponize humor to

fight back against their captors and unify themselves; by remaining positive in the bleakest of
4

situations, they kept their sanity. By defining humor as an element of communication and by

thinking of resilience as a communication phenomenon, the links between humor and resilience

become more apparent (Henman, 2001).

 Humor affords the opportunity for exploring cognitive alternatives in response to

stressful situations. A study published in 2002 in the International Journal of Humor Research

explored this idea by surveying first-year college students, separating them into groups based on

their humor level or tendencies. The researchers found that individuals in the sample with

self-reported better senses of humor tended to report lower levels of stress, despite having a

similar number of everyday problems compared to those in the low-humor group (Abel, 2002).

The study emphasizes that using humor in these situations is primarily to “redefine” or

“reappraise” a negative situation into a positive one, particularly attempting to find some

meaning in the stressful events and recognizing that they are part of one’s personal growth (Abel,

2002).

 In 2009, a study was published investigating the connection between humor and

long-term physical and mental health. The researchers studied 74 individuals with systemic

sclerosis, a chronic autoimmune disease, and found that there was a slight inverse relationship

between the amount of humor measured in an individual and the overall pain levels and

psychological distress (Merz, 2009). The authors suggest that while humor is an inexpensive and

accessible form of treatment, it is not necessarily a significant therapeutic solution for most

people with chronic illness (Merz, 2009).

 One possible reason for why studies involving humor as a coping strategy are

inconclusive is that there are multiple types of humor, each with different mechanisms and

outcomes. A study done in 2012 examined the differences in outcomes between positive or
5

good-natured humor and negative or mean-spirited humor and how it relates to emotion

regulation. In the study, participants were shown “negative” pictures (e.g., skulls, corpses,

soldiers, dental exams, or dangerous animals) specifically chosen to be negatively valenced and

arousing, and instructed to use either positive or negative humor in response to the picture

(Samson, 2012). By having participants rate their emotions afterward, the researchers could

determine whether the use of humor was successful in regulating negative emotion, and whether

there was a difference between those who used positive humor and those who used negative

humor. The researchers found that those who were directed to use positive or good-natured

humor to combat anxiety were far more successful at doing so than those who used negative or

mean-spirited humor (Samson, 2012). A possible reason for this could be that positive humor is

closely related to reappraising the negative situation, as suggested by other research, while

negative humor serves to distance oneself from the situation and prevents one from seeing the

bright side, if any, of the negative event (Samson, 2012).

 The negative humor described in the previous study is a little different than what we

typically think of as dark or gallows humor, humor that touches on topics that are normally

considered sensitive or taboo. Whereas the participants in the study were asked to respond to the

pictures in a hostile or superior way or in a way that mocked others, black humor can be more

self-deprecating and often serves to connect with others through relatable unpleasant experiences

that so happen to be shared.

Pitfalls of Humor as Stress Relief

There can be pitfalls with using humor as a resource to combat anxiety or trauma. Case studies

detailing first-responders’ use of humor also mention instances in which this technique is
6

maladaptive for the individual, particularly when it inappropriately masks emotions or pain, or

alienates others by being too cynical (Kuiper, 2012). It is also easy to see how gallows humor is

inappropriate in some situations or in the presence of people who are not predisposed to

appreciate it.

 This idea is explored more in depth in a 2010 study of service providers from five

different AIDS service organizations. In the study, 25 individuals were interviewed about their

use of humor in the workplace, specifically the role that humor plays in managing stress they

experienced as HIV service providers (Kosenko, 2012). The study found that the participants

usage of humor could be grouped into different categories: sexual humor, gay humor, gallows

humor, humorous gripes, and humorous teasing (Kosenko, 2010). In a workplace such as this

where the topics of sex and/or illness are prevalent, “sexual” or “gay” humor makes sense, as

does gallows humor, which is much more translatable to other environments than the former.

One participant remarked that by making jokes and laughing about uncomfortable topics like

bodily functions, serious illness, or death releases that stress; otherwise, it would stay bottled up

inside (Kosenko, 2010). The researchers identify that this specific type of humor used by HIV

service providers served to boost morale and reduce tension within the workplace, but there are

certainly drawbacks.

 Interviewees reported that using gallows humor in difficult or tragic situations was

sometimes a defense mechanism that hindered emotional adjustment; for example, by joking

about the tragic death of a client, one service worker said his use of humor was to avoid dealing

with emotional upset, and he failed to work through the difficult emotions and overcome them

(Kosenko, 2010). Another maladaptive function of using humor in these situations is that it

serves as a distraction, sometimes going as far as to inhibit productivity and detract from job
7

performance in a number of ways. Many interviewed believed that humor had the potential to go

too far that it distracted from optimal care provision, causing the provider to lose the right

perspective about the case (Kosenko, 2010). The final maladaptive function of humor mentioned

in the article was its propensity to alienate certain groups. While gallows humor in particular can

create a sense of solidarity between a staff or organization, it can alienate those who are new to

the organization as they struggle to adapt to an environment where such practices are tolerated.

Cliques might develop as a result of those with a tendency to appreciate dark jokes gravitating

towards each other, or patients or customers who are not predisposed to such humor may find it

off-putting (Kosenko, 2010).

Humor, Social Media, and COVID-19

 Coronavirus-related humor can certainly be considered dark humor, specifically because

it touches on serious topics like sickness and death. It can also be considered “disaster humor”,

which is humor that emerges in the wake of a large-scale incident. Notable examples of disaster

humor occurred during the AIDS outbreaks of the 1980s, the death of Princess Diana, or even in

earlier times such as after the sinking of the Titanic (Bischetti et al., 2020). A study was also

done in 2020 to try and understand the extent to which individuals use humor during the

COVID-19 pandemic, especially during lockdown or quarantine circumstances. The researchers

conducted a large-scale survey in Italy (one of the countries most affected by the early

coronavirus outbreak) gauging exactly how funny a joke or meme about the virus was and just

how aversive joking about this topic in particular is compared to a more benign topic (Bischetti

et al.). They found that humor inspired by COVID-19 was not more or less enjoyable because it

is not uniformly different from non-Covid humor and is generally more dependent on the form it
8

takes (memes or images are generally funnier than verbal quips or comic strips) (Bischetti et al.,

2020). Additionally, Covid humor was characterized by a moderate and increasing level of

aversiveness across the different humor forms, and the most unpleasant instances were those that

instanced death or transmission of illness, especially to a loved one (Bischetti et al., 2020.

 The COVID-19 pandemic has seen over 100 million people infected since its emergence

in late 2019, with over 29 million of those cases coming in the United States as of early March

2021. The coronavirus has completely changed how we interact with each other, by necessitating

social distancing and remote socialization. The role of social media in many people’s lives has

thus been greatly increased because of its ability to quickly spread information and its ability to

connect people across great distances. Since the first reported cases of coronavirus 2019, social

media platforms like Facebook and Twitter have been instrumental in disseminating information

and guidance related to the disease (Merchant, 2020). These platforms provide an unprecedented

amount of content, much of which is informational, but each may amplify or spread rumors or

questionable information (Cinelli et al., 2020). The ongoing health crisis makes it difficult for

individuals to find reliable information online, forcing them to sift through both high-quality

expert information and potentially life-threatening misinformation (Gallagher et al., 2020).

 This idea is explored more in depth in a 2020 article examining the relationship between

humor and information. Humor is a constant in daily life, appearing in things like television

advertisements and programs like Saturday Night Live and the Colbert Report (Yeo et al., 2020).

Studies have shown that humor is also commonplace on social media platforms, and it has the

potential to be used as a defense against misinformation (Yeo et al., 2020). One reason for this is

that humor can draw attention to subjects in a way that no other tool can, particularly imagery
9

like memes or comics; additionally, thoughtful jokes require the audience to use cognitive

resources to fully understand the joke (Yeo et al., 2020).

 The coronavirus outbreak has created serious havoc in the economic conditions, physical

health, and working conditions around the world but has also created a niche in the minds of

people everywhere (Rajput et al., 2020). There is no doubt that the pandemic has had a serious

impact on our psychological states as well, even since its onset in early 2020. It so happens that

social media is an excellent tool for attempting to capture these emotions by analyzing content

humans post. Sentiment analysis, often known as opinion mining, refers to natural language

processing techniques used to try and understand the underlying feeling behind a piece of text.

Sentiment analysis models focus on the overall feeling of a piece of text data, (where it can be

positive, negative, or neutral), but also on feelings and emotions, urgency, or even a person’s true

intentions.

 Researchers have already analyzed social media platforms like Twitter to try and

understand the sentiments of struggling populations during the pandemic. By the first week of

March 2020, several countries like China, Italy, Spain, and Australia were struggling with the

COVID-19 pandemic, resorting to strict measures like nationwide lockdown (Barkur et al.,

2020). India was among those countries, locked down for three weeks during March and April

2020. Using 24,000 Tweets collected with the hashtag(s) #IndiaLockdown and

#IndiafightsCorona, the researchers found that the population’s feelings were quite surprising:

even though there was negativity, fear, disgust, and sadness about the lockdown, the prominent

sentiment was positive (Barkur et al.). Despite several frightening realities for many, especially

minimum-wage workers, the majority of Indians trusted that their government was doing the

right thing and that these drastic measures would flatten the outbreak curve (Barkur et al., 2020).
10

 Twitter reported a 34 percent increase in daily average user growth during the first

months of the pandemic, so there is no shortage of data available to analyze (Schwartz).

Researchers have also found by analyzing Twitter that anxiety, depression, stress, and suicidal

thoughts have become more abundant since the beginning of the pandemic (Schwartz). This is

likely the result of the COVID-19 pandemic lasting much longer than anticipated; before

vaccines were developed, the situation seemed dire as many were unsure how long it would last.
11

Methods

Data Collection

Twitter is an extremely valuable source of information for sentiment analysis in the aggregate, as

Twitter data is public and immensely vast. The data used in this project were originally sourced

from Harvard Dataverse, an online research data repository (Kerchner et al.). Consisting of

around 240 million Tweets that used the hashtag #Coronavirus, #Coronaoutbreak, or #COVID19,

the data were collected between March 3, 2020 and June 10 , 2020, when the coronavirus began

to impact the United States in a major way. During this time, businesses and institutions closed

or went remote. People began to isolate indoors, and many took to social media platforms like

Twitter to share information or vent their frustrations.

 The data I obtained were thus in the form of Tweet IDs , a unique 19-digit number, which

I “hydrated”, or converted, back into full-fledged Tweet Objects using Hydrator, a third-party

application, to automate the process. Each object contains the text of the Tweet itself as well as

other attributes, such as the user ID, the date and time the Tweet was posted, the language of the

text, the number of likes and reTweets the post received, and the user’s location. The Tweets

collected were all public Tweets, meaning they would show up in search results and are able to

be viewed by anyone, as opposed to private Tweets, which are able to be viewed only by one’s

approved followers. Twitter allows the use of such public Tweets so long as the text body of any

given individual Tweet is not shared as part of the research. All preprocessing and data analysis

was performed using the Python software package on Google Colab and R Version 4.0.2 on

RStudio.
12

 I took a random sample of 1,000,000 Tweets for the purposes of this study. About

200,000 Tweets were unusable for a number of reasons, the most common being that the Tweet

had since been deleted after it was collected. The most common language used was English, but

other languages used the hashtag as well. The graph below shows the top seven most common

languages in my data set, which make up about 80 percent of the data, the remaining comprising

other languages or undetermined languages.

 Figure 1: Language Breakdown of Tweets Using #COVID-19 or Similar

I narrowed the data set even more to comprise only Tweets marked as English. For visualizations

and models involving word usage, I limited the data set to original Tweets, Tweets that are not

Retweets of an already existing Tweet. This was done to eliminate duplicate Tweets and simplify

the data. Although retaining Retweets in the data set would provide a natural weight to certain

Tweets that were popular enough to garner attention, a more accurate analysis of the types of

accounts posting certain content requires that all content be original.
13

Relationship Between Tweets and Case Numbers

I wanted to quantify the extent to which the number of coronavirus-related Tweets were related

to the spread of COVID-19 in the United States. To explore this relationship a bit, I created a

time series plot for frequency of Tweets on each day between March 3rd and June 10th, the range

of my data set. Clearly, the graph shows a sharp increase starting immediately from when the

data were first recorded and peaking on March 23, before gradually decreasing over the next two

months as the United States began to increase lockdowns and the initial panic from the virus

began to subside.

 Figure 2: Frequency of Tweets per day with #coronavirus, #COVID-19, or similar

Using data from covidtracking.com, I then plotted the number of coronavirus cases in the United

States over the same time interval (“Totals for the U.S.”). The time series plot shows a similar

trend, with the exception of a larger number of low positive case days in early March and more

of a plateau or gradual decrease in May and June.
14

 Figure 3: Number of New COVID-19 Cases per day in the United States

There were far more Covid-related Tweets than Covid-19 cases in early March, as other

countries around the world started to feel its effects before the United States. After April 1 st,

however, the graphs suggest that as new coronavirus cases decreased in the U.S., Tweets about it

decreased, albeit in a faster manner. The figure below plots the relationship between cases and

Tweets where each data point is a single day between April 1st and June 10th, 2020. We see a

direct relationship between the two variables.

 Figure 4: Scatterplot of New COVID-19 Cases and COVID-19 related Tweets (left) &

 Residual and Normal Q-Q plots (right)
15

The plot of the residuals suggest randomness among the data points, and the normal Q-Q plot

shows normality, especially among the data points in the middle of the time range. The number

of Tweets per day is explained reasonably well by the number of positive cases per day, with an

R2 value of .47; that is, about 47% of the variation in Tweets per day can be explained by the

number of cases per day.

Exploring Time of Day and Location of English Tweets

To explore the frequency of which individuals were Tweeting about the coronavirus at different

times of the day, I created a similar time series plot of all Tweets in my data set, grouped by hour

of the day.

 Figure 5: Frequency of English Tweets during the day (UTC)

The plot appears somewhat cyclical, peaking at 4:00 pm UTC (noon EST) and reaching its

lowest point in the early morning around 4:00 am UTC (midnight EST). The plot is not corrected

for Tweets made across different time zones, so the true distribution of Tweet times is much

more variant throughout the day, with more pronounced peaks and valleys. Only a small
16

proportion of data contained coordinates, so reliably normalizing the times for the remainder of

data points is difficult. According to research done by social media analytics website Buffer on

4.5 million Tweets, noon to 1:00 pm local time is the most common time people Tweet (Lee,

2016). It is therefore reasonable to guess that a large portion of English Tweets in my data set

originate in the United States, particularly the Eastern time zone.

 Tweet objects also contain geolocation data for users that opt-in to sharing it publicly. I

mapped the user’s location using the ggplot2 package in R. Each circle represents a user’s

approximate location, and darker areas made of overlapping circles indicate higher-density areas,

places where there are more users. As briefly mentioned above, only 242 Tweets in English

contained geolocation data that could be plotted, a tiny fraction of all Tweets in the data set. The

plot below is therefore not indicative of the entire data set, but it is an interesting look into where

Tweets originate around the world.

 Figure 6: Geolocation of a Small Number of English Tweets in Data Set (242 Tweets)
17

A large proportion of the data comes from the United Kingdom and the United States, with a

good amount coming from Italy, an early COVID-19 hotspot, and India. The location breakdown

of all the Tweets in my data set is much more varied, but I chose to show only points that were

ultimately included in my analysis.

Preliminary Sentiment Analysis

One of the goals for my project was to see if humor, which I assume to be present on social

media in most contexts, was apparent at all in my data set. To begin to understand whether

humor played a factor in Tweets I analyzed, I did a preliminary scan of the Tweets to see if any

of them struck me as particularly funny or at least a clear attempt at humor. I randomly sampled

500 Tweets from my data set using R and read their text, marking down which ones could be

considered humorous or were at least satire or in jest. Out of the 500 examined, only 10 fit this

criteria, only around two percent, with some margin or error accounting for the subjectivity of

my reading of the data. This suggested to me, however, that the phenomenon of humor was not

all that present in my data set, and there was not necessarily a good way to label Tweets as

humorous in an objective manner. To combat this, I conducted a survey to gauge, in general and

specific terms, the way that humor manifested itself in regards to anxiety reduction, especially on

social media, as well as how people viewed humor in regards to COVID-19.

COVID-19 Humor and Humor Tendencies Survey

The survey’s exact questions can be found in Appendix 1. The survey consisted of two

demographic questions, questions about social media usage, humor usage, everyday stress, and

humor usage and tendencies specifically during the COVID-19 outbreak. The last question of the

survey asked respondents to identify a topic related to the outbreak, life in quarantine, or
18

something similar that they find or found humorous or could be construed as humorous. This was

done in the hopes that allowing people to self-report humorous concepts could help

crowd-source potential sources of comedy in my data set.

 I created my survey using the University of Vermont’s Qualtrics platform, and it was

approved by UVM’s Institutional Review Board. I distributed my survey to people over the age

of 18 through my different classes, organizations, family members, and friend groups in

mid-March, also posting it on my personal social media platforms. In addition, I encouraged

respondents to pass along the survey to people they knew, in order to increase the number of

responses to the survey. Respondents were volunteers who likely shared many of the same

characteristics; for example, being predominantly UVM students, mostly upper-classmen, etc.. In

total, I had 193 responses to my survey after data cleaning. The age and gender distribution of

the 193 survey respondents is summarised in the tables below:

 Table 1: Summary of Respondents’ Age

 Count Mean Age Median Age Standard Dev.

 193 22.17 21 7.27

 Table 2: Summary of Respondents’ Gender

 Male Female Non-binary

 Count 89 99 5

 Proportion .461 .513 .026

Only twenty-one participants were over the age of 23, with the rest between 18-23 years old.

Five participants were over the age of 50, which marginally raised the mean and standard
19

deviation. The following plot shows the distribution of respondent’s self-reported humor levels

grouped by their age group and gender:

 Figure 7: Sense of Humor Levels Grouped by Gender and Age Group

For the 21-22 age group, the distribution of average versus above average sense of humor is

fairly even. For the 18-20 age group, however, there is a noticable difference between males and

females; many more men of this age group classified their humor propensities as above average,

and many more women classified their humor as below average. The same holds true for the 23+

age group, although with a much smaller sample size.

Market Basket Analysis of Twitter Text

Studies have shown that the COVID-19 pandemic has inexorably altered the content on social

media. An n-gram rank analysis of Twitter text data has already shown that Covid-related words

have appeared as frequently on social media as some of the most foundational words in language

(Alshaabi et al.). I wanted to explore this phenomenon of word frequencies and relationships

between words using market basket analysis, a machine learning technique commonly used by
20

retailers to infer association between item purchases. For text data, this technique can be used to

identify what words in a text corpus are commonly used in association with one another.

 For this analysis, 76,534 individual Tweets were used after removing missing values. The

text data was cleaned by removing punctuation, links, non-character data like emojis, and stop

words (the, is, and, etc.). The Tweets were also tokenized, or broken up into individual words.

From there I used R to conduct the Market basket analysis, first creating a word frequency plot to

gauge the most common words throughout the data set. The plot below shows the twenty most

common words.

 Figure 8: Most Frequently-Used Terms in Tweets with #COVID-19 or similar

Clearly, the word coronavirus is dominant among Tweets in my data set, appearing in over 20

percent of Tweets. The other most frequent words are all matter-of-fact or informational, part of

Tweets intended to share news rather than humor.

 The next step of the analysis is to create a Transactions matrix, which organizes the data

into a 2x2 matrix, where the number of rows indicates the number of individual “transactions”

(Tweets, or observations) included in the analysis, while the number of columns indicates the

number of unique “items” (words, or variables) found within the data. Density refers to the
21

percentage of non-zero entries in the sparse matrix of the rows and columns, meaning the

percentage of words used out of all possible words. The total number of words used throughout

the entire data set can be calculated by multiplying the number of rows, the number of columns,

and the density together:

 Table 3: Summary Statistics of the “Transactions” Matrix

 Total Rows Total Columns Density

 76534 160075 7.312313 x 10⁻⁵

 −5
 76534 166075 7. 312313 10 ≈ 929,423 total words in data set

The result of a market basket algorithm is a set of association rules, rules that specify patterns

found in the relationship between items, or words in this case.

Clustering Using K-Means

Since the Twitter data were unsupervised, or unlabeled, in terms of its sentiment, clustering is a

powerful tool to try and group Tweets into different categories, or clusters. This is important

because clustering is able to group data without knowing how the groups should look ahead of

time. Describing the data in each cluster may help identify latent groupings within the data.

Clustering data should form groups of similar data points that are quite different from data

outside the cluster, but labels have to be inferred from the data and later applied. The K-means

clustering algorithm uses the Euclidean distance between n data points (if they were graphed on

a scatter plot with as many dimensions as there are features) to assign them to one of k clusters,

where the number of clusters is determined ahead of time (Lantz, 2013). The initial cluster
22

centers are chosen at random, and then continually updated to optimize the homogeneity between

the clusters (Lantz, 2013).

 The overall word frequency analysis revealed that the word “coronavirus” as well as the

word “people” occurred so frequently throughout the data set that when I initially tried to create

clusters within the data, they were all extremely similar. I elected to reduce my cluster analysis to

Tweets that contained neither of those words to try and identify clusters within the other words

more easily.

 The first step was creating a Document-Term Matrix, where individual Tweets make up

the rows and each individual word, or feature, is a column of the matrix. The entry of any given

cell in the matrix is the number of times the word appears in the Tweet, meaning most of the

entries are 0 and the matrix is sparse, specifically 98 percent for the matrix I created. The next

step is to find the distance between all pairs of points since the data were not numeric to begin

with, creating a distance matrix from the term-document matrix. R can then automate the

K-means clustering algorithm and return the cluster of each data point.

 For computing purposes, I took a much smaller sample of 10,000 Tweets to perform

clustering analysis. The number of clusters, k, can be determined by using the “elbow method”,

which analyzes how the sum of squares, the squared variation in the data, changes at different

values of k. The plot below shows this for the text data.
23

 Figure 9: Total Sum of Squares for K-means Clustering at Different Values of k

We can see that as more clusters are added, the sum of squares decreases until k reaches seven.

Thus, six clusters seems like the optimal number to choose for the data, since adding a seventh

cluster actually increases the variability in the different clusters. This is indicated by the

distinctive “elbow” shape in the plot. For my analysis, I chose to have four clusters, as the

decrease in variability after k = 4 was slight.
24

Results and Discussion

Humor Usage in Survey Respondents

The 2002 study by Abel mentioned in the “Humor as Personal Resiliency” section explored the

relationship between stress levels and self-reported sense of humor. In the study, students with

better senses of humor tended to report lower stress levels. The distribution of stress levels

(rows) by humor (columns) for my survey respondents is shown in the table below:

 Table 3: Stress Levels by Sense of Humor

 Humor Above Humor Average or Below Total
 Average Average

 Very Often 43 47 90
 Stressed

 Pretty Often 31 33 64
 Stressed

 Occasionally 13 12 25
 Stressed

 Rarely Stressed 8 4 12

 Total 95 96 191

Only a few answered that they had a below average sense of humor, so their group was

combined with the “average” humor group. Overall, the distribution of self-reported stress levels

is strikingly even between those with better senses of humor than average and those with average

or below average. The difference in stress levels among the two different humor groups is not

significant, χ²(3, N=191) = 1.608, p = 0.6575, suggesting there is no relationship between those

with good senses of humor and those with average senses of humor in amount of stress

experienced in day-to-day life. I think administering this survey during a pandemic helped to
25

even out the two humor groups; even those skilled in personal resilience have struggled over the

past year and many who identify as having a good sense of humor could be experiencing higher

levels of stress than normal.

 Figure 7 demonstrated that male respondents tended to self-report higher senses of

humor, so I was curious to know if there was a difference in reported stress levels between

genders as well. The graph below is a visual representation of Table 3, the proportion of reported

stress levels between those with different senses of humor, but grouped between genders.

 Figure 10: Stress Levels by Sense of Humor & Gender

The graph shows that there is very little difference in stress levels between those with different

sense of humor; there is, however, a big difference between genders. Over half the females and

all of the non-binary respondents reported that they experienced stress very often, while only a
26

quarter or so of males answered this way. Clearly, stress levels are more correlated with gender

identity than humor levels in respondents.

 The survey also asked how likely respondents would be to joke about a stressful

situation, in general. About 84 percent responded that they would be either “very likely” or

“somewhat likely” to do so, an overwhelming margin. This confirms the idea that using humor to

combat an anxiety-inducing situation is a prevalent tactic. The survey also asked participants to

identify some of the reasons why they might choose to do this. The table below shows the

number of people who selected one of the given reasons. Note that one person could select

multiple answers or not respond.

 Table 4: Reasons One Might Joke About a Stressful Situation

 Reason Count Percent of Study

 Deflect or Distract 136 70.5

 Connect with Others 100 51.8

 Remain Optimistic 89 46.1

 Reduce Anxiety 76 39.4

 Other/Not Sure 18 9.3

Some who answered “other” wrote some reasons of their own, such as expressing their anxiety in

a way that would not draw too much attention to themself or because of their aversion to taking

things too seriously. Several people responded that they would not joke about something

stressful.

 I also wanted to explore how respondents used dark humor in the context of their total

humor usage. The survey asked respondents to approximate what percentage of their humor
27

consisted of dark humor, among the four quartiles. I expected that most people would fall

between in the 25-75 percent range, and this prediction held true for those with “above average”

senses of humor. The distribution for those in the “average/below average” category had far

more respondents in the 0-25 percent range, however. The overall difference between the two

humor groups was significant at the α = .05 level, χ²(3, N=192) = 10.352, p = 0.0158.

 Table 5: Dark Humor Usage by Sense of Humor

 Above Average or Total
 Average Below Average

 0-25% 14 33 47

 25-50% 43 31 74

 50-75% 30 24 54

 75-100% 9 8 17

 Total 96 96 192

From the data, it seems that individuals with a self-reported better sense of humor tend to use

dark humor a bit more than those with an average or below average sense of humor.

Analysis of Self-reported Humorous COVID-19 Topics

The final survey question asked respondents to name a topic that they “found humorous or could

be construed as humorous”. This was done to identify topics of coronavirus-related humor which

could be used to identify humorous Tweets in the data set. The responses were varied and

enlightening, encompassing several different topics, styles of humor, and levels of severity.

 An overarching theme of the responses was that self-deprecating jokes are generally more

effective than jokes that come at the expense of others. Self-deprecating humor manifested itself
28

in different ways in people’s responses; for example, one respondent mentioned that since they

considered themselves introverted, they had somewhat of an affinity for quarantine life because

of the reduced expectation for social interaction, at least at first. Some respondents identified that

their drug or alcohol usage had increased during the past year as a result of increased boredom,

isolation, or decreased responsibility. More broader instances of self-deprecation were of the

American’s government perceived lack of foresight or response to the coronavirus outbreak

when compared to other countries.

 Of course, there were responses suggesting humor usage that could come at the expense

of others; for instance, some mentioned that they might make fun of someone who wore a mask

improperly or refused to wear one. Similarly, some mentioned finding humor in mocking

someone opposed to receiving the COVID-19 vaccine without a necessarily justifiable cause, or

at least pointing out the perceived hypocrisy of an “anti-vaxxer” not wanting to harm their body

while engaging in arguably more dangerous behavior like alcohol or drugs. Multiple responses

ridiculed former President Donald Trump in particular, especially in the aftermath of his

widely-publicized contraction of coronavirus. There were also sparse instances of inflammatory

remarks or racism, but those responses were few and far between in the survey.

 Many of the responses were more light-hearted, however. A few respondents reported

making puns with the word “corona” or picking up undesirable new habits during quarantine.

The topic of online education came up frequently, not necessarily unexpected in a survey

populated by mainly university students. Most of the responses in this category mentioned the

difficulties arising from having to use unfamiliar technology and a new etiquette arising from

attending school or work online.
29

 Cleaning the text data from the responses and analyzing word frequencies generated a

word cloud, which is shown below. Just as in the Tweet data, the word “people” occurred

extremely frequently.

 Figure 11: Word Cloud of Term Frequency in Write-In Responses (Humorous Topics)

Market Basket Analysis

Association rules are denoted by relating one itemset on the left-hand side (LHS) of the rule to

another itemset on the right-hand side (RHS) of the rule (Lantz, 2013). The LHS is the condition

that needs to be met in order to trigger the rule, and the RHS is the expected result of meeting

that condition; and this can be expressed in the form {distancing} → {social}, for example. This
30
implies that if the word “distancing” is used in a Tweet, then the world “social” is likely to be
used, and there are statistics that can quantify this relationship. The support of the rule is the
basic probability of an event to occur, the confidence is the conditional probability of the event to
occur, and the lift is the ratio of confidence to expected confidence, or how much better a rule is
at predicting something than randomly guessing (Kumar, 2018).
The rules were initially influenced heavily by Tweets from Twitter user @openletterbot, a
Twitter bot that posts images of letters written by constituents to their elected officials. These
Tweets take on virtually the same form, “Support [name] by signing [title of petition] and I’ll
deliver a copy to your elected officials, too!”. There were 344 instances of this exact phrasing in
the data, and they accounted for 434 of the top supported rules, each with the exact same support
of .0044. I decided to exclude those from the visualizations and analysis as to include a number
of more varied rules. The top thirty rules, arranged in descending order by their support, are
shown in Appendix 2.
The rule {distancing} → {social} had the highest support of .008, with a confidence of
.88, meaning about 88 percent of Tweets using the word “distancing” were accompanied by the
word “social”. The word “cases” appeared extremely frequently on the right-hand side of the
association rules; the majority of Tweets with the word “cases” contain a few specific words, like
“new”, “slow”, or “total”, for example. The figure below plots the thirty rules shown in
Appendix 2, where the size of the circle corresponds to the rule’s support, and the darker-colored
circles represent rules with higher lifts, words that are excellent predictors of other words.31
Figure 12: Relationship of Common Rules
Clearly, the word “cases” is interconnected with a number of words, as is the word “new”, which
is the predictor for a number of different words but is on the right-hand side for the word “york”.
The rules for {distancing} → {social}, {health} → {mental}, and {hands} → {wash} are
mutually exclusive from other rules, but have high supports and lifts as well.
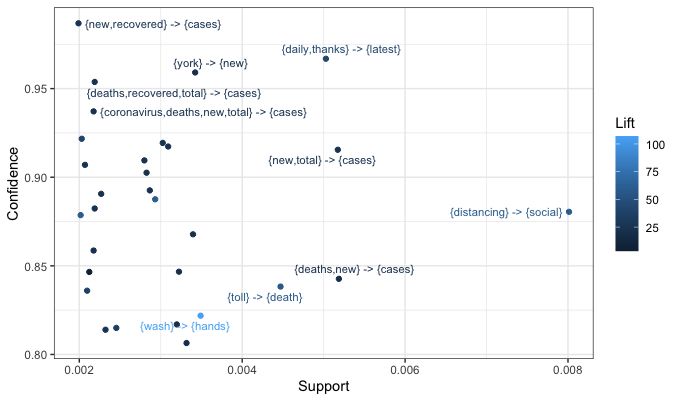
The plot below summarizes the top thirty rules and plots their support, confidence on a
grid, while showing their lift with a color spectrum. Some points with high support, confidence,
or lifts are labeled.32
Figure 13: Scatterplot of Top Thirty Supported Rules
The distribution of confidence among points with high support is quite random, as there is not a
real relationship between the two statistics. The rule {wash} → {hands} has clearly the highest
lift among points in the plot, and {distancing} → {social} clearly has the highest support. It is
also easy to see here that the word “cases” can be predicted by a number of words or phrases
with high confidence.
Cluster Analysis
Performing K-means clustering with four clusters gives us the following information for the
10,000 Tweets:
Table 6: Number of Observations in Each Cluster
Cluster 1 2 3 4
N = 10000 3546 2496 1187 277133 Naturally, this gives us no information about the content of Tweets in each cluster. To try and learn more about the content of Tweets in each cluster, I again ran a similar word frequency analysis to examine the distribution of words among clusters. Figure 14: Term Frequency between k = 4 Clusters Even after removing the two most common words from the analysis, the clusters were still somewhat similar. Clusters 1 and 4 are probably the most similar of the four due to their usage of the words “new” and “us”, but there are certainly recurring words in multiple clusters. Cluster 1 seems to be the most positive cluster with the words “love” and “best”, with superficial tendencies evidenced by the words “best”, “looking”, and “mask”, perhaps in that order. Examining entire Tweets in each cluster proved fruitless as well. Cluster 3 seems at least somewhat related to the experience of being at home, with words like “home” and “work”. I had hoped that by clustering the data I could find groups of data that were characterized by humor or
34

satire, but with such a homogeneous data set these groups were not present. A more robust data

set with different hashtags not limited to coronavirus would likely indicate more distinct groups,

but I found that including Tweets with the same hashtag limited the semantic variety in my data

set.
35

Concluding Remarks

Humor on social media in the aggregate is still an unstudied phenomenon, because of the way

humor is nearly always context-driven. Just about anything can be interpreted as a joke, and

there is not necessarily a way to know right away whether a particular piece of text is intended to

be humorous. Furthermore, humor is an incredibly nuanced form of expression, and there are no

universalities; what could be considered a joke to someone may come off as offensive to

someone else. Trying to infer positive or negative sentiment from text is challenging enough, and

trying to infer humor is even more difficult.

 It became evident that the majority of the Tweets in the data set served to spread

information, rather than to quip or share an emotionally-charged message. Social media is

extremely curated for an individual by its very nature; very rarely does one log onto social media

and see a random selection of everything on the platform. Rather, social media users are

generally able to control what they read by following certain users, pages, or general topics.

Personally, I use social media primarily for entertainment purposes, and the platforms I use have

been intentionally or unintentionally curated to content that will make me laugh, rather than

inform me. The data set I worked with was limited; for one, it was limited to Tweets with

#COVID-19 or #coronavirus, so it is naturally not representative of the entire Twitter corpus. In

addition to this, a large proportion of Tweets were extremely similar to each other because they

all had one of only a few hashtags. The Tweets in my dataset were ultimately a random sample

of Tweets meeting this criteria. For most of my analyses, the sample size was likely large enough

to represent the true proportion quite well, but this may not be the case. It is also likely that
36

Twitter is used disproportionately by certain groups of people, so the type of language seen on

Twitter is not necessarily indicative of the population at large.

 One of the initial goals for my project was to “label” a large proportion of Tweets,

classifying them as either humorous or not humorous. With more time and resources I could

have coordinated and crowdsourced this to have a large amount of supervised data, from which a

model could be built using keywords that appeared more frequently in Tweets labeled as

humorous. The market-basket and clustering algorithms I employed are more exploratory, and do

not necessarily translate to predictive methods or model building. Future research could expand

on this study by either classifying a larger number of Tweets or defining more

coronavirus-inspired topics of humor.

 My survey also had a number of limitations. For one, it was not a random sample of any

population. The respondents were limited to people I knew, shared a class with, or someone who

happened to receive the survey. As a result, the demographic was quite homogenous; most of the

respondents were around my age, my location, and shared many other similarities. The sample

size of the survey is also relatively small; I had planned on distributing my survey over

Amazon’s Mechanical Turk service to a goal of 10,000 respondents, but because of time and

resource constraints, I elected to distribute it myself.

 Although I wasn’t able to conduct a study exactly how I had envisioned at first, I still

found the results quite interesting and I think they constitute a potential building block for future

research. The results of the survey were interesting to read and could certainly lead to future

research down the road, particularly the questions that I did not end up using. It was highly

rewarding to perform data analysis on a survey I conducted myself, and I am excited to put this

experience to good use down the road.
37

Acknowledgements

 I would like to thank my advisor, Sheila Weaver for her support throughout the thesis, as

well as my committee members Chris Danforth and Joan Rosebush (Rosi) for their support

taking the time to be on my committee. I would also like to thank everyone who gave me

feedback on my paper, as well as those who graciously volunteered their time to fill out my

survey.
38

References

 Abel, M. H. (2002). Humor, stress, and coping strategies. Humor – International Journal of

 Humor Research, 15(4). https://doi.org/10.1515/humr.15.4.365

 Alshaabi, T., Arnold, M. V., Minot, J. R., Adams, J. L., Dewhurst, D. R., Reagan, A. J.,

 Muhamad, R., Danforth, C. M., & Dodds, P. S. (2021). How the world’s collective

 attention is being paid to a pandemic: COVID-19 related n-gram time series for 24

 languages on Twitter. PLOS ONE, 16 (1), 1–13.

 https://doi.org/10.1371/journal.pone.0244476

 Barkur, G., Vibha, & Kamath, G. B. (2020). Sentiment analysis of nationwide lockdown due

 to COVID 19 outbreak: Evidence from India. Asian Journal of Psychiatry, 51, 102089.

 https://doi.org/10.1016/j.ajp.2020.102089

 Bischetti, L., Canal, P., & Bambini, V. (2020). Funny but aversive: A large-scale survey of

 the emotional response to Covid-19 humor in the Italian population during the

 lockdown. PsyArXiv. https://doi.org/10.31234/osf.io/efk93

 Cinelli, M., Quattrociocchi, W., Galeazzi, A., Valensise, C. M., Brugnoli, E., Schmidt, A. L.,

 Zola, P., Zollo, F., & Scala, A. (2020). The COVID-19 social media infodemic.

 Scientific Reports, 10(1), 16598. https://doi.org/10.1038/s41598-020-73510-5

 Gallagher, R. J., Doroshenko, L., Shugars, S., Lazer, D., & Welles, B. F. (2020). Sustained

 Online Amplification of COVID-19 Elites in the United States. ArXiv:2009.07255

 [Physics]. http://arxiv.org/abs/2009.07255
39

Henman, L. (2001). Humor as a coping mechanism: Lessons from POWs.

 Humor-International Journal of Humor Research - HUMOR, 14, 83–94.

 https://doi.org/10.1515/humr.14.1.83

Jabeen, H. (2018, August 21). Market Basket Analysis using R. DataCamp Community.

 https://www.datacamp.com/community/tutorials/market-basket-analysis-r

Kerchner, D., & Wrubel, L. (2020). Coronavirus Tweet Ids (V7 ed.). Harvard Dataverse.

 https://doi.org/10.7910/DVN/LW0BTB

Kosenko, K. A., & Rintamaki, L. S. (2010). Forms, Functions, and Foibles of Humor Used

 in AIDS Service Organizations. Journal of the Association of Nurses in AIDS Care,

 21(1), 25–35. https://doi.org/10.1016/j.jana.2009.08.001

Kuiper, N. A. (2012). Humor and Resiliency: Towards a Process Model of Coping and

 Growth. Europe’s Journal of Psychology, 8(3), 475–491.

 https://doi.org/10.5964/ejop.v8i3.464

Kumar, K. (n.d.). Visualize Market Basket analysis in R. DataScience+. Retrieved March

 24, 2021, from https://datascienceplus.com/visualize-market-basket-analysis-in-r/

Lantz, B. (2013). Machine Learning with R. Packt Publishing.

Lee, K. (2016, April 27). The Best Time to Tweet & Why =. Buffer.

 https://buffer.com/resources/best-time-to-Tweet-research/

Li, S. (2017, September 24). A Gentle Introduction on Market Basket Analysis—Association

 Rules. Medium.

 https://towardsdatascience.com/a-gentle-introduction-on-market-basket-analysis-associ

 ation-rules-fa4b986a40ce
40

Merchant, R. M., & Lurie, N. (2020). Social Media and Emergency Preparedness in

 Response to Novel Coronavirus. JAMA, 323(20), 2011–2012.

 https://doi.org/10.1001/jama.2020.4469

Merz, Erin L., Malcarne, Vanessa L., Hansdottir, I., Furst, Daniel E., Clements, Philip J., &

 Weisman, Michael H. (2009). A longitudinal analysis of humor coping and quality of

 life in systemic sclerosis. Psychology, Health & Medicine, 14(5), 553–566.

 https://doi.org/10.1080/13548500903111798

Nicholls, C. (2020). Online Humour, Cartoons, Videos, Memes, Jokes and Laughter in the

 Epoch of the Coronavirus. Text Matters: A Journal of Literature, Theory and Culture,

 10, 274–318.

Rajput, N. K., Grover, B. A., & Rathi, V. K. (2020). Word frequency and sentiment analysis

 of twitter messages during Coronavirus pandemic. ArXiv:2004.03925 [Cs].

 http://arxiv.org/abs/2004.03925

Samson, A., & Gross, J. (2012). Humor as emotion regulation: The differential

 consequences of negative versus positive humor. Cognition and Emotion, 26(2),

 375–384.

Schwartz, C. (2020, October 12). Is Everybody Doing … OK? Let’s Ask Social Media. The

 New York Times. https://www.nytimes.com/2020/10/12/style/self-care/

 social-media-.html

“Totals for the U.S.”. (n.d.). The COVID Tracking Project. Retrieved April 2, 2021, from

 https://covidtracking.com/data/national
41

Yeo, S. K., & McKasy, M. (2021). Emotion and humor as misinformation antidotes.

 Proceedings of the National Academy of Sciences, 118(15), e2002484118.

 https://doi.org/10.1073/pnas.2002484118
42

Appendix 1: Survey Questions

Thank you for participating in my study!

Just a reminder: you must be over 18 to participate. ALL RESPONSES ARE ANONYMOUS!

It is your right to not answer any questions you don't feel comfortable answering. Before taking
the survey, it is recommended that you read the information form (linked below) to learn more
about the study. By continuing on to the survey, you are consenting to participate.

Link:
https://drive.google.com/file/d/1_Edd1CFp5L4ch8rrLnn_6vOU97FOfcOP/view?usp=sharing

 1. What is your age (numeric)?
 a. ______
 2. What is your gender identity?
 a. Female
 b. Male
 c. Non-binary
 d. Gender-fluid
 e. Prefer not to answer
 3. How often do you use social media platforms like Facebook, Twitter, Reddit, Instagram,
 or TikTok?
 a. Very often
 b. Occasionally
 c. Rarely
 4. Do you ever crack jokes or share memes on a social media platform where you have a
 following, such as Twitter, Instagram, Facebook, or TikTok?
 a. Often
 b. Occasionally
 c. Rarely
 d. Never
 e. Not sure
 5. Where would you rank your sense of humor?
 a. Above average
 b. Average
 c. Below average
 6. How often would you say you experience the feelings of stress or anxiety?
 a. Very often
 b. Pretty often
43

 c. On occasion
 d. Rarely
 e. Prefer not to answer
7. If you are undergoing stress, how likely would you be to make a joke about your
 situation?
 a. Very likely
 b. Somewhat likely
 c. Might or might not
 d. Pretty Unlikely
 e. Very unlikely
8. What are some reasons why you would do this (select as many as apply)?
 a. Reduce anxiety
 b. Deflect or distract from the problem
 c. Remain optimistic
 d. Connect with others
 e. Not sure
 f. Other: __________
9. To your best estimate, what percentage of your sense of humor consists of inappropriate
 humor or "dark humor" (where dark humor is defined as humor that pokes fun at
 sensitive, vulgar, or taboo topics)?
 a. 75-100%
 b. 50-75%
 c. 25-50%
 d. 0-25%
10. Even if you don't make dark jokes often, do you think that it is acceptable to make dark
 jokes?
 a. Yes
 b. No
 c. Maybe
11. How likely would you be to joke about the coronavirus or share a funny meme or video
 about the coronavirus when it first became a public issue (circa March 2020)?
 a. Very likely
 b. Somewhat likely
 c. Might or might not
 d. Somewhat unlikely
 e. Very unlikely
12. How likely would you be to do it now (March 2021)?
 a. More likely
 b. About the same / Don’t know
You can also read