Vaccine willingness and concerns in Australia: August 2020 to April 2021 ANU Centre for Social Research and Methods - Centre for ...
←
→
Page content transcription
If your browser does not render page correctly, please read the page content below
Vaccine willingness and concerns in Australia – August 2020 to April 2021

      Vaccine willingness and concerns in
      Australia: August 2020 to April 2021

       ANU Centre for Social Research and
                   Methods
Professor Nicholas Biddle1, Associate Professor Ben Edwards1, Professor Matthew Gray1, and
Kate Sollis1

   1 ANU Centre for Social Research and Methods

Australian National University

5th May 2021

                                                                                             i
The ANU Centre for Social Research and Methods
Vaccine willingness and concerns in Australia – August 2020 to April 2021
Acknowledgements
The authors would like to thank a number of people who were involved in the development of
the ANUpoll questionnaires, including Diane Herz, Dr Benjamin Phillips, Dr Paul Myers, Matilda
Page, Diana Nguyen, Anna Lethborg and Charles Dove from the Social Research Centre, and
Professor Ian McAllister from the ANU. Financial support for the ANU COVID-19 Impact
Monitoring Survey Program has been provided by the Australian Institute of Health and
Welfare. We would also like to thank Dinith Marasinghe for assistance with tables and figures.
Abstract
This paper reports data collected in April 2021 on Australian’s vaccine willingness and
concerns, with a total sample size of 3,286 adult Australians, comparing results from responses
from the same individuals in January 2021 and August 2020. The paper shows that although
vaccine willingness has remained stable since January 2021, there are still key population
groups within Australia who remain hesitant about getting a vaccine. Groups that have higher
rates of vaccine hesitancy include women, those who spoke a language other than English;
those who live in relatively disadvantaged areas; and those who live outside a capital city. We
show for the first time in Australia that experiences of discrimination are associated with higher
rates of vaccine hesitancy. We also show that only 3.7 per cent of Australian adults thought
the process for individuals getting the vaccine was going very well. Furthermore, only one-in-
five were not at all concerned about potential side effects from the COVID-19 vaccination.
ii
The ANU Centre for Social Research and MethodsVaccine willingness and concerns in Australia – August 2020 to April 2021
Executive summary
• This paper reports data collected in April 2021 on Australian’s vaccine willingness and
concerns. The total sample size is 3,286 adult Australians, and the analysis compares
responses from the same individuals in January 2021 and August 2020.
• Around 9.3 per cent of Australian adults reported that they had received at least one
vaccination dose
o Vaccination rates were higher for those with a higher level of education, holding
constant other demographic, socioeconomic, and geographic factors.
o Those Australians who reported higher rates of vaccine willingness in January 2021
were more likely to have been vaccinated by April 2021.
• When asked about a hypothetical safe and effective vaccine, vaccine willingness has
remained stable since January 2021. 54.7 per cent of Australians said they definitely would
get vaccinated; 28.2 per cent said they probably would; 11.1 per cent said they probably
wouldn’t; and 6.0 per cent said they definitely wouldn’t;
o There are still key population groups within Australia who remain hesitant about
getting a vaccine, even when it is framed as being safe and effective. This includes
women, those who spoke a language other than English; those who live in relatively
disadvantaged areas; and those who live outside a capital city.
o Experiences of discrimination are associated with vaccine hesitancy.
• While willingness to take a hypothetical safe and effective vaccine has remained high, there
is a large proportion of Australians who are concerned about possible side effects if they
do take a vaccine. 18.4 per cent of respondents were not at all concerned about side
effects, leaving a little over eight-in-ten Australians who had at least some concerns about
side effects.
o The most commonly cited reason for being hesitant about a vaccine is concern
about possible side effects (63.3 per cent). In addition, more than half of
respondents who were hesitant about the vaccine said that they ‘plan to wait and
see’ if it is safe. Around half of the sample cited the recent news about the Astra
Zeneca vaccine and blood clotting as being key factors contributing to their
concerns.
o The least common responses were not believing that they need a vaccine (15.0 per
cent), and not trusting the government (18.9 per cent).
• Only 3.7 per cent of Australian adults thought the process for individuals getting the
vaccine was going very well. This is far less than in the US when asked a similar question.
Furthermore, only one-in-five were not at all concerned about side effects from the
vaccine.
o Those who had said they would vote for a party grouping other than the Coalition
were less likely to think the process was going well.
o Most Australians thought the vaccine process was fair
• Unlike in the US when asked in February, most Australians in April think that Australia
should help ensure that people in developing countries have access to coronavirus
vaccines, even if it means some people in Australia need to wait longer to get vaccines.
iii
The ANU Centre for Social Research and MethodsVaccine willingness and concerns in Australia – August 2020 to April 2021
1 Introduction and overview
There are concerns in a number of countries throughout the world that a large proportion of
their population will choose to not get vaccinated against COVID-19. This is also the case in
Australia. This paper reports on data collected in April 2021 on Australian’s vaccine willingness
and concerns and compares the responses from the same individuals in January 2021 and
August 2020. The sample size is 3,286 adult Australians.
Compared to a number of other high-income countries1 (which have had much higher rates of
COVID-19 infection and mortality), Australia has been relatively slow to roll out vaccines. As
this paper is being finalised (data current as of 1st of May 2021), Australia had administered
8.76 COVID-19 vaccination doses per 100 population, compared to rates of around 72.80 per
100 population in the US, 71.81 in the UK and 36.17 doses per 100 population in Canada.
When we compare Australia’s vaccination rates with countries that also have lower infection
and mortality rates, Australia ranks at around the middle. For example, Japan (2.76 per 100
population as of April 29th) and New Zealand (4.82 per 100 as of April 27th) both have lower
vaccination rates than Australia, while Singapore has a vaccination rate of 37.84 (as of April
18th)on the other hand has also had low infection rates, but by April 18th had a vaccination rate
of 37.84.
While there is less urgency from a public health perspective to rapidly vaccinate the population
in Australia compared to countries with much higher infection rates, there are still ongoing
costs from having an unvaccinated population. These include the inability to open the
international border and relax other restrictions. There are, of course, some benefits of a
slower roll-out of vaccination, as the prevalence and distribution of potential side effects
become apparent from the experience in other countries.
There have been reports of a rare but potentially serious side effect for the AstraZeneca COVID-
19 vaccine, which is a key vaccine in Australia’s vaccination plan. On 8th April (just prior to the
commencement of the survey used in this paper) the Australian Technical Advisory Group on
Immunisation (ATAGI), in response to safety concerns, recommended that the Pfizer vaccine
was preferred to the AstraZeneca vaccine for adults under 50 years of age due to potentially
increased risk of thrombosis with thrombocytopenia (ATAGI, 2021). However, they did note
that the AstraZeneca could be used in those under 50 where the benefits clearly outweigh the
risks for that individuals’ circumstances. On 18th April 2021, the Victorian government who
previously paused administering AstraZeneca announced that they were making it available to
those under the age of 50 years who choose to receive the vaccine.
In other high-income countries which are far more advanced in their vaccination programs,
such as the United Kingdom and the United States, it appears that vaccine hesitancy has
declined as those. This may be in part due to those who were hesitant seeing increasing
numbers of their family and friends receive a COVID-19 vaccine. A January 2021 survey in the
United Kingdom reported 74% were likely to get vaccinated, with 17% unsure and 9% unlikely
to get vaccinated (Sherman et al., 2021). This represents a 10-percentage point increase in
acceptance from a survey in July 2020 from the same sample (64% were likely to get
vaccinated; Sherman et al., 2020). Perceived risk of COVID-19 to oneself, necessity of
vaccination, safety of the vaccine and social norms (e.g. most people getting vaccinated) most
likely influenced individuals’ intentions to vaccinate in January 2021. Another survey of over
12,000 people in the United Kingdom in November 2020 also reported that safety concerns
4
The ANU Centre for Social Research and MethodsVaccine willingness and concerns in Australia – August 2020 to April 2021
were a key factor in persuading people that the vaccine was demonstrated to be safe
(Robertson et al., 2021).
US survey research also shows how vaccine hesitancy is falling to some degree as the
proportion of the population that is vaccinated increases. For example, as the number of
Americans who had been vaccinated increased, the proportion of the population saying that
they would probably or definitely would not get a vaccine declined from a peak of 49% in
September 2020 to 30% in February 2021 (Pew 2021). On 16 April 2021, the Kaiser Family
Foundation (KFF) Vaccine Monitor (Hamel & Brodie, 2021) in the United States reported results
from over 11,000 interviews, finding that vaccine confidence in the U.S. has increased as more
people are seeing family and friends getting vaccinated. The results showed that 32% already
have at least one dose, 30% intend to get the vaccine as soon as possible and 17% will “wait
and see how it is working for others”. However, there were still around 20% who report that
they will not get the vaccine or will only get it if required to for work or school activities. Both
Pew Research and KFF surveys report that the main concern for hesitant groups were side
effects of the vaccine.
The ANU Centre for Social Research and Methods ANU COVID-19 Impact Monitoring Survey
Program asked the same group of Australians about their vaccine intentions in August 2020,
January 2021 and in April 2021 (Biddle et al., 2021; Edwards et al., 2021). In addition, the April
2021 survey asked a question on confidence and fairness in the vaccine rollout. The survey was
conducted just after safety concerns were raised by ATAGI (13th April 2021) and when there
was widespread criticism of the pace of Australia’s vaccine rollout.
The aim of this paper is to provide data on the characteristics of those who have been
vaccinated and those who say they are willing to be vaccinated (compared to those who are
more hesitant), as well as compare these results to data from the same group of people
collected in August 2020 and January 2021. In addition, the paper provides evidence on
reasons given for vaccine hesitancy, as well as views about the roll-out of COVID-19
vaccinations.
The remainder of the paper is structured as follows. In the next section, we explore Australian
data on vaccination status and willingness to get vaccinated. Section 3 explores in more detail
the concerns given by Australians on vaccines. In Section 4 we summarise views on vaccine
policies in Australia. Section 5 provides some concluding comments. The data used in this
paper is described in detail in Appendix 1 and tables of regression output are given in Appendix
2.
2 Vaccination status and willingness
2.1 Vaccination rates
The vaccination process was in its early phases when data collection for this paper took place,
with only a minority of adult Australians having been fully vaccinated or received their first
dose . According to the data collected in the April 2021 ANUpoll, 9.3 per cent of Australian
adults had received at least one vaccination by mid-April.
As shown in Figure 1, there was no significant difference between men and women in rates of
vaccination. This is despite women having greater rates of vaccine hesitancy earlier in the
pandemic (Edwards et al. 2021). There were, however, large differences in vaccination rates
by age that have started to emerge This reflects the prioritisation of elderly Australians in the
initial phases of the roll-out. There were much higher rates of vaccination for older Australians
5
The ANU Centre for Social Research and MethodsVaccine willingness and concerns in Australia – August 2020 to April 2021
aged 65 to 74 years (18.4 per cent) and 75 years and over (31.9 per cent) compared to younger
age groups. The lowest vaccination rate is for those aged 35 to 44 years (3.8 per cent), with
slightly higher rates for those aged 55 to 64 years (8.9 per cent) and those aged 25 to 34 years
(6.7 per cent). The marginally higher rate for those aged 25 to 34 years compared to those
aged 35 to 44 years potentially reflects the higher concentration of essential workers in the
younger of these two age groups.
Figure 1 Per cent of Australians who have been vaccinated by age and sex, April 2021
April 2021
Male 9.4
Female 9.3
18-24 years 4.4
25-34 years 6.7
35-44 years 3.8
45-54 years 5.0
55-64 years 8.9
65-74 years 18.4
75 or more years 31.9
0.0 5.0 10.0 15.0 20.0 25.0 30.0 35.0 40.0
Note: The “whiskers” on the bars indicate the 95 per cent confidence intervals for the estimate.
Source: ANUpoll: April 2021
2.2 Vaccine willingness
Respondents to the April 2021 ANUpoll who had not been vaccinated at the time of the survey
were asked about their willingness to take a vaccine if it were available to them. Specifically,
they were asked ‘If a safe and effective vaccine to prevent COVID-19 were available to you
now, would you…?’ with the following response percentages:
• 54.7 per cent said they definitely would;
• 28.2 per cent said they probably would;
• 11.1 per cent said they probably wouldn’t; and
6
The ANU Centre for Social Research and MethodsVaccine willingness and concerns in Australia – August 2020 to April 2021
• 6.0 per cent said they definitely wouldn’t.
Willingness to take a hypothetical ‘safe and effective’ vaccine was previously asked of the Life
in AustraliaTM panellists in August 2020 and January 2021. Because of the changing context of
vaccines in Australia throughout this time, it has been difficult to construct a question that is
consistent but meaningful at each point in time. There were slightly more people in August
2020 (Figure 2) who said they would definitely (58.5 per cent) or probably (28.7 per cent) get
a vaccine ‘If a safe and effective vaccine for COVID-19 is developed’ compared to April 2021
when people were asked about a safe and effective vaccine being available to the respondent
now.
There were fewer people in January 2021 who said they would definitely (43.7 per cent) or
probably (34.7 per cent) get a vaccine ‘When health officials notify the public that a safe and
effective COVID-19 vaccine is available in Australia’ compared to the current sample.
On balance, it would appear that willingness to receive a hypothetical safe and effective
vaccine has stayed quite high, despite the concerns regarding the Astra-Zeneca at the time of
the survey. If anything, willingness to receive a safe and effective vaccine is higher in April 2021
than it was in January 2021, although rates are still lower than in August 2020. We will return
to whether respondents feel that the currently available vaccines are indeed safe and effective
in a subsequent section.
Figure 2 Willingness to take a hypothetical safe and effective vaccine – August 2020
to April 2021
0.0 10.0 20.0 30.0 40.0 50.0 60.0 70.0 80.0 90.0 100.0
5.5
August 20 -
7.2 28.7 58.5
If a safe and effective vaccine for COVID-19 is developed, would you…?
8.4
January 21 -
When health officials notify the public that a safe and effective COVID-19 13.3 34.7 43.7
vaccine is available in Australia, will you…?
6.0
April 21 -
If a safe and effective vaccine to prevent COVID-19 were available to you now, 11.1 28.2 54.7
would you…?
Definitely wouldn't Probably wouldn't Probably would Definitely would
Source: ANUpoll: August 2020, January 2021, and April 2021
7
The ANU Centre for Social Research and MethodsVaccine willingness and concerns in Australia – August 2020 to April 2021
2.3 Changes in vaccine willingness for individuals
One of the benefits of asking about vaccine willingness in a reasonably consistent way over
time is that it is possible to see whether individuals have changed their views, and in what
direction. In total, there were 3,078 individuals who answered both the vaccine willingness
question in January 2021 and the questions on current vaccination status/vaccine willingness
in April 2021. The flows of how people responded in these two time periods are illustrated in
Figure 3. Note that because the flows are based on the linked longitudinal sample, some of the
percentages are slightly different from the repeated cross-sectional analysis.
Looking first at those who had been vaccinated in April 2021 (the node in the bottom right of
Figure 3), it is clear that the largest proportion of people who had been vaccinated were those
who had said in January 2021 that they definitely would get vaccinated (62.9 per cent of those
who had been vaccinated) or probably would be vaccinated (29.7 per cent of those who had
been vaccinated). There were very few people who had been vaccinated by April 2021 who in
January 2021 said that they would probably not be vaccinated (1.9 per cent of all those
vaccinated) or would definitely not be vaccinated (5.5 per cent of sample). This provides strong
evidence that hypothetical responses to vaccine willingness questions are a good predictor of
eventual vaccine behaviour.
Leaving aside those who have been vaccinated and focusing on the hypothetical vaccination
responses, the most stable of the vaccine categories is the ‘Definitely will’ category. Of the
‘Definitely will’ group in January 2021 who had not been vaccinated by April 2021, 85.8 per
cent still said that they definitely would be vaccinated in April 2021. At the other extreme, only
42.9 per cent of those who said they would definitely not get vaccinated in January 2021 said
that they definitely would not get vaccinated when asked again in April 2021. Often those who
say they would definitely not want to get vaccinated are considered vaccine ‘resistant’ and
therefore immune to public health messaging (Dubé, Vivion & MacDonald, 2015). This finding
suggests there is some prospect for those who are ‘resistant’ becoming more willing to receive
a COVID-19 vaccine over time. In total, 29.3 per cent of Australians who hadn’t received a
vaccine by April 2021 had become more willing to get a vaccine between January 2021 and
April 2021, compared to only 10.3 per cent of Australians who became less willing to receive a
safe and effective vaccine. While people’s views on the safety and efficacy of the vaccines may
have changed, their willingness to receive a vaccine appears to have increased.
8
The ANU Centre for Social Research and MethodsVaccine willingness and concerns in Australia – August 2020 to April 2021
Figure 3 Individual-level changes in vaccine willingness between January and April 2021
Source: ANUpoll: January 2021 and April 2021
Note: The numbers in brackets are the per cent of the longitudinal sample in each time period at each node
2.4 Explaining vaccination rates and willingness
This section presents estimates of the factors associated with the likelihood of having being
vaccinated and with vaccine willingness. As far as we are aware, the ANU COVID-19 Impact
Monitoring Survey Program is the only survey available in Australia with a large enough sample
of those who have been vaccinated to analyse how vaccination rates compare across key
demographic, geographic, and socioeconomic groups.
2.4.1 Vaccination rates
A regression approach is used to estimate the factors associated with the likelihood of having
been vaccinated using a binary probit model. Four models are estimated, illustrated in Table
1, Appendix 2. The first estimates the associations between being vaccinated and
demographic, geographic, and socioeconomic variables (Model 1). The second model adds
household income and whether the respondent was employed as explanatory variables
(Model 2). The third model adds occupation in February 2020 (i.e., prior to COVID significantly
impacting on Australia) (Model 3). The final model control for demographic, socioeconomic,
and geographic variables (i.e. those in Model 1) and also controls for vaccine willingness as of
January 2021 (Model 4).
Apart from age and educational attainment, the other demographic, geographic and
socioeconomic characteristics are not significantly related to the likelihood of being vaccinated
(Model 1). Those with a degree (and particularly a post-graduate degree) were more likely to
have been vaccinated compared to those without any post-school qualifications.
9
The ANU Centre for Social Research and MethodsVaccine willingness and concerns in Australia – August 2020 to April 2021
Controlling for these demographic, geographic, and socioeconomic variables, there was no
correlation between vaccination rates and household income or pre-COVID employment
status (Model 2). There are some differences in vaccination rates between occupations, with
lower vaccination rates for Managers; Sales Workers; and Machinery Operators (Model 3).
Controlling for demographic, socioeconomic, and geographic variables, those who said they
would probably not get vaccinated when asked in January 2021 were the least likely to have
been vaccinated by April 2021, with the comparison group being those who said they definitely
would get vaccinated. The other two categories (definitely wouldn’t, probably would) also are
estimated to have a lower probability of being vaccinated by April 2021, but the differences
were not as large. This further reinforces the point made earlier that there is useful information
in the vaccine willingness behaviour for future decision making, but highlights that this is not
just because of the demographic, socioeconomic, and geographic variables that may be
correlated with vaccine willingness.
2.4.2 Vaccine willingness
A regression approach is also used to estimate the characteristics that are associated with
vaccine willingness (Appendix 2, Table 2) using an ordered probit model. Two models are
estimated. The first model (Model 1) controls for demographic, geographic, and
socioeconomic variables, and shows that vaccine willingness was higher for younger
Australians and older Australians compared to those aged 25 to 44 years. Vaccine willingness
was also higher for those with a degree, and in particular, a post-graduate degree. Vaccine
willingness was, however, lower for women; those who spoke a language other than English;
those who live in relatively disadvantaged areas; and those who live outside a capital city.
The second model expands the explanatory variables to include COVID-specific variables and
measures of confidence in institutions (Model 2). This model shows that there is a strong
positive correlation between vaccine willingness and whether a person has been tested for
COVID-19, as well as whether they have experienced anxiety and worry due to the virus.
Vaccine willingness was slightly higher for those who thought it was likely that they would be
infected in the next six months.
Confidence in three out of the four institutions measured (public service; State/Territory
governments; and hospitals and the health system) were positively associated with greater
vaccine willingness. It is interesting to note that when controlling for these three variables,
confidence in the Federal Government did not have an association with vaccine willingness.
2.4.3 Vaccine willingness of those who speak a language other than English
One of the population groups that has consistently (in August 2020, January 2021 and April
2021) reported relatively low rates of vaccine willingness is those who speak a language other
than English at home. In April 2021, 44.8 per cent of those who spoke a language other than
English said that they would definitely get a safe and effective vaccine if it was available to
them, compared to 58.2 per cent of those who did not speak a language other than English.
Although the sample of respondents who speak a language other than English in each wave of
data collection is relatively small, when pooled across waves it is possible to build a reasonably
large number of observations. In the current paper we use standard econometric techniques
to estimate the coefficients in the model (whilst controlling for the clustering of standard errors
due to the pooled sample). For future work we will extend this analysis using panel data
techniques.
10
The ANU Centre for Social Research and MethodsVaccine willingness and concerns in Australia – August 2020 to April 2021
Table 3 (in Appendix 2) presents estimates for those who speak a language other than English,
using the pooled sample, of the factors associated with vaccine willingness. This includes some
of the additional explanatory variables included in Table 2, as well as whether a person
reported having been discriminated against in the previous 12 months (as reported in October
2020). The discrimination measure asks whether the respondent has experienced
discrimination in one or more of the following settings – at work, when renting or buying a
house, in dealings with government, when seeking other services, or at a shop or restaurant.
This measure is included as an indicator of negative experiences when interacting with
government or the rest of the Australian population.
An important finding is that those who had experienced some form of discrimination were less
willing (significant at the 10% significance level) to get vaccinated than those who hadn’t
experienced any form of discrimination (Table 3). Not only does self-reported discrimination
appear to be correlated with vaccine willingness for those who speak a language other than
English, it is also very prevalent. Only 33.5 per cent of those who do not speak a language other
than English reported have been discriminated against when asked in October 2020, compared
to 81.0 per cent of those who do speak a language other than English. Reducing discrimination
is arguably an important policy aim in and of itself. However, the results presented in Table 3
suggest that there may be further potential benefits in terms of vaccine willingness, though
that does assume that the relationship between the variables is a causal one.
Many of the other correlates of vaccine willingness for the general population also hold for
those who speak a language other than English, including anxiety and worry, confidence in
institutions (particularly State/Territory governments and hospitals/health system), sex and
living in a disadvantaged area. There are, however, some other subtle differences. For those
who speak a language other than English, education is important, but it is Year 12 completion
rather than post-school qualifications that seem to matter the most (while the difference is
not statistically significant for Year 12 completion, the coefficient is large and the p-value is
0.122, giving weak evidence for a relationship). Furthermore, compared to the general
population where having a Certificate III/IV had no association with willingness (compared to
those without qualifications), for those who speak a language other than English, a Certificate
III/IV had a negative correlation.
Also, for the general population there was no association between Indigenous status and
vaccine willingness. For our pooled sample of those who speak a language other than English,
however, there was a very strong association with Indigenous Australians who speak a
language other than English who identify as Indigenous being far less willing to take a vaccine
than others who speak a language other than English.
A final point of comparison is the age associations. For the general population, there is a very
distinct age pattern with younger and older Australians being more willing to get vaccinated.
For those who speak a language other than English, however, there is no significant association
(and we eventually dropped the first four age dummy variables). This may be because the
sample sizes are smaller. However, it does suggest that older Australians who speak a language
other than English may need a particular policy focus, rather than the general population of
older Australians.
3 Vaccine concerns
While willingness to take a hypothetical safe and effective vaccine has remained high, there is
11
The ANU Centre for Social Research and MethodsVaccine willingness and concerns in Australia – August 2020 to April 2021
a very large proportion of Australians who are concerned about possible side effects if they do
take a vaccine. That is, a divergence between views on specific vaccines and a hypothetical safe
and effective vaccine appears to be emerging.
In April 2021, respondents who had not already been vaccinated were asked ‘How concerned
are you that you would experience a side effect from a COVID-19 vaccination?’. Just under one-
in-five (18.4 per cent) respondents were not at all concerned about side effects, leaving a little
over eight-in-ten Australians who had at least some concerns about side effects. About four-
in-ten (39.5 per cent) of Australians were slightly concerned, one-in-five (20.3 per cent) were
moderately concerned, and one-in-five (21.8 per cent) were very concerned.
While it appears that people are making a distinction between a hypothetical safe and effective
vaccine and the currently available vaccines, there is still a very strong correlation between the
two measures. Of those who were not at all concerned about side effects, 81.9 per cent said
that they would definitely take a safe and effective vaccine if available to them. This declines
substantially to 64.9 per cent of Australians who were slightly concerned, 44.4 per cent of
those who were moderately concerned, and 23.1 per cent of Australians who were very
concerned about side effects saying that they would definitely take a vaccine.
Looking in more detail at vaccine concerns, those who had not been vaccinated and who said
that they would definitely or probably not take a safe and effective vaccine were asked ‘Which
of the following, if any, are reasons that make you not want to get a COVID-19 vaccine?’ with
eight possible response options, including an ‘Other’ category.2
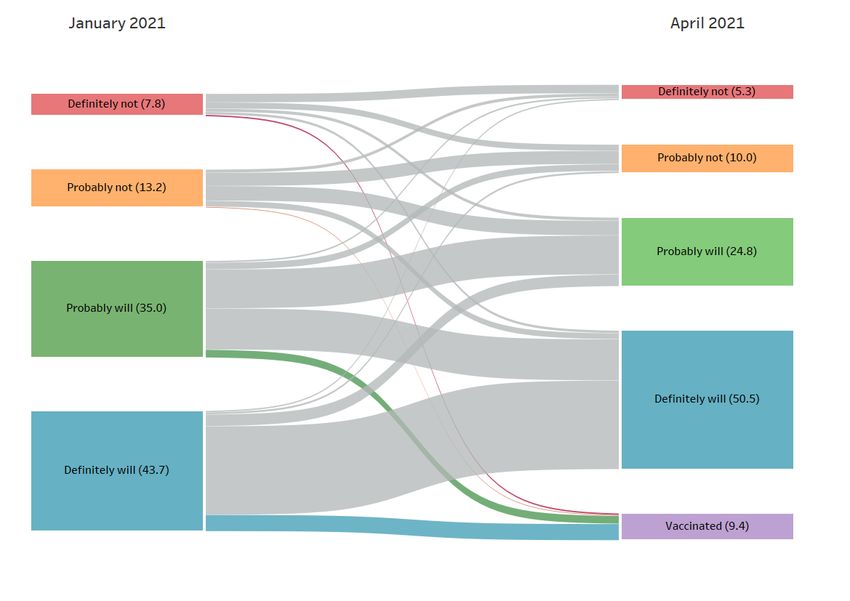
The most commonly cited reason for being hesitant about a vaccine is concern about possible
side effects, given by 63.3 per cent of those who answered the question. In addition, more
than half of respondents who were hesitant about receiving the vaccine said that they ‘plan to
wait and see’ if it is safe (55.0 per cent) with around half of this sample (50.4 per cent) citing
the recent news about the Astra Zeneca vaccine and blood clotting. In total 82.1 per cent of
the sample gave at least one of these three safety concerns as a reason not to get vaccinated.
Leaving aside the ‘other’ category, the least common responses were not believing that they
need a vaccine (15.0 per cent), and not trusting the government (18.9 per cent). The most
common reason given that does not relate to safety was that the respondent thought that
others needed the vaccine more than they did. It is interesting to note that this is the only
reason given which was not positively correlated with the 82.1 per cent of those who gave at
least one of these three safety concerns as a reason not to get vaccinated. Specifically, of those
who reported at least one of the safety measures, 36.4 per cent said they thought others
needed it more, whereas amongst those who did not report at least one of the safety
measures, 50.8 per cent said that others needed it more.
While it is true that the Australian government (in partnership with the States/Territories) are
allocating the vaccine to those who are identified as needing it the most, part of the rationale
for the vaccine distribution is that positive externalities may come from an individual being
vaccinated. That is, there would be a policy concern if people underestimate the benefit of
themselves being vaccinated to others within society. This suggests a potentially quite
different response for this group.
12
The ANU Centre for Social Research and MethodsVaccine willingness and concerns in Australia – August 2020 to April 2021
Figure 4 Per cent of Australians who gave reasons for not wanting to get a COVID-19
vaccine – those who would not definitely get a vaccine in April 2021
I am concerned about possible si de effects of a COVID-19 vaccine 63.3
I plan to wait and see if it is safe and may get it lat er 55.0
Recent news about the Astra Zeneca vaccine and blood clotting 50.4
I think other people need it more than I do right now 39.0
I do not know if a COVID-19 vaccine will work 31.6
I do not trust COVID-19 vaccines 26.7
I do not trust the government 18.9
I do not believe I need a COVID-19 vaccine 15.0
Other 8.3
0.0 10.0 20.0 30.0 40.0 50.0 60.0 70.0 80.0
Note: The “whiskers” on the bars indicate the 95 per cent confidence intervals for the estimate.
Source: ANUpoll: April 2021
The factors associated with the reasons for being concerned about safety of a COVID-19
vaccine varied quite substantially. To analyse this we estimated two separate models for each
of the eight reasons for not wanting to get the vaccine (Appendix 2, Tables 4a & 4b). That is,
sixteen (probit) regression models in total. In the first of these models, we control for
demographic, geographic, and socioeconomic variables only. In the second model we also
include the level of vaccine hesitancy, with the base case being someone who said they would
probably get the vaccine, with a separate binary variable for those who said they definitely
wouldn’t get the vaccine and those who said they probably wouldn’t. Detailed results are given
in Table 4a (Appendix 2), with associations summarised below.
• Women were more likely to say they are concerned about side effects but less likely to
say that they don’t need a vaccine; and don’t trust government.
• Those aged 25 to 34 years were less likely to say someone else needs the vaccine;
• Older Australians were less concerned about the vaccine not working, and less likely to
say they don’t need the vaccine;
• Indigenous Australians were more likely to say that they did not trust the COVID-19
vaccines (albeit with a p-value of 0.113);
• Those born overseas in a non-English speaking country were less concerned about side
effects; the vaccine not working; less likely to say that others need it; and less likely to
not trust the vaccine;
• Those who speak a language other than English are more concerned about side effects,
13
The ANU Centre for Social Research and MethodsVaccine willingness and concerns in Australia – August 2020 to April 2021
the vaccine not working, more likely to say they don’t trust the vaccinations; more likely
to say that they plan to wait and see if it is safe; and more likely to be concerned about
the recent news about the Astra Zeneca vaccine.
• Those who had not completed Year 12 were more likely to say that others need the
vaccine more than they do.
• Those with a post graduate degree were more concerned about the vaccine not
working;
• Those with an undergraduate degree more likely to say others need the vaccine more
than they do; and less likely to say they did not trust the government;
• Those with a Certificate III/IV were more concerned about side effects and the vaccine
not working; more likely to not trust the vaccine; more likely to not trust the
government; and more likely to be concerned about Astra Zeneca in particular.
• Those who lived in the most disadvantaged suburbs were more concerned about the
vaccine not working; but less likely to say that others needed the vaccine more than
they do
• Those who live in the second most disadvantaged quintile were more likely to report
waiting and seeing if it is safe;
• Those who live in a non-capital city were more concerned about the vaccine not
working; more likely to say that they do not need a vaccine; and more likely to report
waiting and seeing if it is safe.
In the second set of model estimates in Table 4b (Appendix 2), we include the person’s level of
vaccine hesitancy as an additional set of explanatory variables. The causal direction of this
association is difficult to establish – does hesitancy lead to the reasons, the reasons lead to
hesitancy, or some combination of both? However, leaving causality aside, the correlations are
interesting themselves.
Only two of the substantive reasons given for not wanting to get a vaccine was not correlated
with the extent of vaccine hesitancy (when controlling for background characteristics) –
concerns about side effects and recent news about the Astra Zeneca vaccine. There is a
correlation for all the other variables. Those who were more hesitant (that is they said would
definitely not or probably not get a vaccine compared to probably getting the vaccine) were
more likely to say that: they didn’t think the vaccines would work; they thought they didn’t
need a vaccine; and they didn’t trust the vaccines. This group were also less likely to say that:
they plan to wait and see; and they think others need it first.
4 Views on vaccine policy
4.1 Satisfaction with vaccines rollout
While Australia is in the fortunate position that vaccines are not currently required to reduce
a very high infection or mortality rate, that does not mean that the Australian population is
content with the current state of the vaccine roll-out. To gauge the views of the Australian
population, the April 2021 questionnaire randomly split respondents into two groups, with one
half of the sample asked whether the process for individuals getting COVID-19 vaccines in
Australia is going well and the other half asked whether it is fair. There were very different
responses to these two questions
14
The ANU Centre for Social Research and MethodsVaccine willingness and concerns in Australia – August 2020 to April 2021
Only 3.6 per cent of Australians thought the process for individuals getting the vaccine was
going very well, with a further 32.7 per cent thinking the process was going somewhat well.
This leaves almost two-thirds of adult Australians who think the process is not going well, with
42.5 per cent saying it is going not too well and 21.2 per cent saying it is not going at all well.
By comparison, 32.4 per cent of Australians thought the process was very fair, with a further
53.3 per cent thinking it was somewhat fair. This leaves only a small fraction of Australians who
thought the roll-out of the vaccine was not fair, with 11.1 per cent saying it was not too fair
and only 3.2 per cent saying that it was not at all fair.
Responses in Australia are very different to responses in the US, when these questions were
asked in mid-February.3 Americans were far more likely than Australians to think the
vaccination process was going very well (13 per cent) or somewhat well (51 per cent) than in
Australia. Americans were less likely to think the process was very fair (20 per cent) compared
to Australians.
Looking at views on how well the vaccine process was going by using an ordered probit model
and controlling for demographic, geographic, and socioeconomic variables (see Appendix 2,
Table 5, Model 1), those aged 18 to 34 years and aged 75 years and over, those who speak a
language other than English; those without having completed Year 12, and those who live in
the two most disadvantaged quintiles of neighbourhoods were more likely to say the
vaccination process was going well. There were large differences by political views (Model 2).
Using voting intentions when interviewed in January 2021 (to minimise reverse causality) and
controlling for demographic, geographic, and socioeconomic variables, those who had said
they would vote for a party grouping other than the Coalition were less likely to think the
process was going well.
If we consider simple descriptive statistics about voting intentions and the vaccine roll out, we
get an understanding of the degree of dissatisfaction with the vaccine roll out even amongst
Coalition voters. Specifically, only 45.3 per cent of those who said they would vote for the
Coalition (when asked in January 2021) said in April 2021 that the vaccine process was going
well (combining very well and somewhat well groups). This declines to 29.9 per cent of those
who said they would have voted Labor, 27.0 per cent of those who said they would have voted
for the Greens, 33.3 per cent of those who would have voted for an ‘other’ party, and 25.0 per
cent of those who did not know who they would vote for. It is only amongst those who
previously said they would have voted for the Coalition that had more than one-third support
for the notion that the vaccine roll-out was going well, and even amongst Coalition voters
support was less than 50 per cent.
Looking at views on the fairness of the vaccine rollout, we used an ordered probit model
controlling for demographic, geographic, and socioeconomic variables (Appendix 2, Table 5,
Model 1). Only those aged 55 to 64 years and those with an undergraduate degree were more
likely to think the process was fair whereas those who lived in the most disadvantaged quintile
of areas were less likely to think the process was fair. There were large differences in views of
the fairness of the vaccine rollout again by political views. Those who had said they would vote
for a party grouping other than the Coalition (when asked in January 2021) were less likely to
think the process was fair.
Using descriptive statistics again, 89.9 per cent of those who said they would vote for the
Coalition (when asked in January 2021) said in April 2021 that the vaccine process was very or
somewhat fair. This declines to 83.6 per cent who said they would have voted Labor, 79.1 per
15
The ANU Centre for Social Research and MethodsVaccine willingness and concerns in Australia – August 2020 to April 2021
cent of those who said they would have voted for the Greens, 79.2 per cent of those who
would have voted for an ‘other’ party, and 84.5 per cent of those who did not know who they
would vote for.
4.2 Vaccine diplomacy
The April 2021 survey also asked participants about their views about providing access to
coronavirus vaccines to developing countries. At the time of writing, India was suffering from
very high rates of COVID-19 mortality and infections. While measured levels of infection and
mortality per million people weren’t as high as some developed countries in Western Europe
(for example France now or the UK in January), data from India is potentially an under-
estimate, and the trajectory is up rather than flat or downwards like in North America or
Western Europe. Despite producing a significant amount of vaccines themselves, India also
lagged behind a number of countries with relatively high infection rates in terms of vaccination
rates. Aside from large developing countries such as India, Australian foreign policy recognises
the responsibility it has to Asia and Pacific nations.
A random sample of 50 per cent of ANUpoll respondents were prompted as follows: ‘Thinking
about developing countries around the world, which statement comes closer to your view,
even if neither is exactly right…?’ The other half of the sample were prompted with the
following: ‘Thinking about developing countries in the Asia-Pacific region, which statement
comes closer to your view, even if neither is exactly right…?’ [bold not in the original].
Across the sample, 67.6 per cent of Australians thought that ‘Australia should help ensure that
people in developing countries have access to coronavirus vaccines, even if it means some
people in Australia need to wait longer to get vaccines’ with the remainder of the sample
thinking that ‘Australia should ensure that there are enough coronavirus vaccines for people
in Australia, even if it means people in developing countries need to wait longer to get
vaccines’. There were no differences between those who were asked about developing
countries around the world and those who were asked about developing countries in the Asia-
Pacific region.
These responses are essentially the reverse of those in the US when respondents there were
asked a similar question in mid-February. Of those who answered the question, 31 per cent
though developing countries should be prioritised compared to 69 per cent who though the
US should ensure there are enough vaccines for people in the US first. It should be noted that
at the time of the US survey (mid-February 2021) there were far higher rates of infection and
mortality in the US compared to Australia.
5 Concluding comments
According to the Bloomberg Resilience Score of the ‘The Best and Worst Places to Be’4 during
the time of COVID-19, there are very few countries in the world ranked higher than Australia.
Only Singapore (with a higher current vaccination rate) and New Zealand (with a lower
cumulative death rate) is ranked higher than Australia. Like New Zealand, Australia’s success
in keeping infections and mortality low has bought us time to vaccinate the population at a
relatively slower rate. Indeed, just prior to writing this paper, but during the data collection
period, a two-way travel bubble was opened up between Australia and New Zealand with
quarantine-free travel possible in both directions.
This fortunate position does not, however, mean that Australia can be complacent about
vaccinations. Indeed, when asked in April 2021 about how well the vaccination process was
16
The ANU Centre for Social Research and MethodsVaccine willingness and concerns in Australia – August 2020 to April 2021
going, only 3.7 per cent of Australians thought the process for individuals getting the vaccine
was going very well. Furthermore, only one-in-five Australians were not at all concerned about
side effects from the vaccine.
Despite these concerns and fears, Australians do not appear to be becoming more hesitant at
taking a hypothetical ‘safe and effective’ vaccine. It is more the case that a very large
proportion of Australians do not think the current vaccines available to them are safe, and to
a lesser extent, do not think they are effective. This paper highlights that there are particular
groups who have concerns about side effects and vaccine efficacy, facilitating more nuanced
public health campaigns.
To achieve herd immunity a very high percentage of the Australian population needs to be
vaccinated. An important finding is that close to 60% of people who would be considered
‘resistant’ (those who said they definitely would not be vaccinated) in January 2021 did not
hold the same view three months later. One could conclude that they are therefore not
immune to public health messaging (Dubé, Vivion & MacDonald, 2015). This finding suggests
that for a majority of the ‘resistant’ group there is some prospect of vaccination. It is also worth
noting that the experience in the United States and the United Kingdom suggests that
hesitancy declines as friends and relatives begin to get vaccinated in large numbers (Hamel &
Brodie, 2021; Pew 2021; Robertson et al., 2021; Sherman et al., 2021); and our findings suggest
that this may well occur in Australia. Over fifty per cent of people who would not get the
COVID-19 vaccine “plan to wait and see if it is safe and may get it later”. This finding suggests
the best plan to address vaccine hesitancy could be to accelerate the vaccination roll out as
quickly as possible.
While overall vaccine willingness has remained stable since January 2021, there are still key
population groups within Australia who remain hesitant about getting a vaccine, even if it is
framed as being safe and effective. One group that we have considered in this paper is those
who speak a language other than English. One of the important findings from this paper is that
those in this group who have experienced discrimination are less willing to take a vaccine than
those who haven’t. It is up to all Australians to reduce the level of discrimination in the country,
but governments clearly have a role. Not only does discrimination have a range of health, social
and economic costs, it would appear that it is negatively correlated with the one behaviour
that is likely to help Australia get back to a more regular way of life and to continue to be one
of ‘the best places to be’ – mass vaccination.
17
The ANU Centre for Social Research and MethodsVaccine willingness and concerns in Australia – August 2020 to April 2021
Appendix 1 About the survey
The primary source of data for this paper is the April 2021 ANUpoll. Data collection
commenced on the 12th of April 2021 with a pilot test of telephone respondents. The main
data collection commenced on the 13th of April and concluded on the 26th of April. The final
sample size for the survey is 3,286 respondents. 54.7 per cent of the sample had completed
the survey by the 15th of April and the average interview duration was 13.9 minutes. Of those
who had completed the April 2021 survey, 94.6 per cent (N=3,109) had completed the January
2021 survey.
The Social Research Centre collected data online and through Computer Assisted Telephone
Interviewing (CATI) in order to ensure representation from the offline Australian population.
Around 5.1 per cent of interviews were collected via CATI. The contact methodology adopted
for the online Life in Australia™ members is an initial survey invitation via email and SMS
(where available), followed by multiple email reminders and a reminder SMS. Telephone non-
response of panel members who have not yet completed the survey commenced in the second
week of fieldwork and consisted of reminder calls encouraging completion of the online survey.
The contact methodology for offline Life in Australia™ members was an initial SMS (where
available), followed by an extended call-cycle over a two-week period. A reminder SMS was
also sent in the second week of fieldwork.
A total of 4,002 respondents were invited to take part in the survey, leading to a wave-specific
completion rate of 82.1 per cent. Taking into account recruitment to the panel, the cumulative
response rate for this survey is around 7.0 per cent.
Unless otherwise stated, data in the paper is weighted to population benchmarks. For Life in
Australia™, the approach for deriving weights generally consists of the following steps:
1. Compute a base weight for each respondent as the product of two weights:
a. Their enrolment weight, accounting for the initial chances of selection and
subsequent post-stratification to key demographic benchmarks
b. Their response propensity weight, estimated from enrolment information
available for both respondents and non-respondents to the present wave.
2. Adjust the base weights so that they satisfy the latest population benchmarks for
several demographic characteristics.
The ethical aspects of this research have been approved by the ANU Human Research Ethics
Committee (2014/241).
18
The ANU Centre for Social Research and MethodsVaccine willingness and concerns in Australia – August 2020 to April 2021
Appendix 2 Regression tables
19
The ANU Centre for Social Research and MethodsVaccine willingness and concerns in Australia – August 2020 to April 2021
Table 1 Factors associated with having been vaccinated, April 2021
Explanatory variables Model 1 Model 2 Model 3 Model 4
Coeff. Signif. Coeff. Signif. Coeff. Signif. Coeff. Signif.
Employed 0.061 0.089
Household income (natural log) 0.071 0.165 **
Managers; Sales Workers; and Machinery Operators -0.278 **
Would definitely not get a vaccine when asked in January -0.194
Would probably not get a vaccine when asked in January -1.009 ***
Would probably get a vaccine when asked in January -0.187 **
Female 0.090 0.109 0.130 0.102
Aged 18 to 24 years 0.164 0.246 -0.032 0.058
Aged 25 to 34 years 0.232 0.244 * 0.287 * 0.234
Aged 45 to 54 years 0.141 0.073 0.088 0.014
Aged 55 to 64 years 0.433 *** 0.443 *** 0.491 *** 0.390 ***
Aged 65 to 74 years 0.925 *** 0.982 *** 1.136 *** 0.786 ***
Aged 75 years plus 1.412 *** 1.479 *** 1.572 *** 1.311 ***
Indigenous -0.244 -0.168 -0.148 -0.397
Born overseas in a main English-speaking country 0.013 0.001 -0.038 0.012
Born overseas in a non-English speaking country -0.035 -0.009 -0.116 -0.052
Speaks a language other than English at home 0.047 -0.002 0.242 0.115
Has not completed Year 12 or post-school qualification 0.126 0.115 0.251 0.124
Has a post graduate degree 0.493 *** 0.453 *** 0.305 * 0.404 ***
Has an undergraduate degree 0.318 ** 0.269 ** 0.282 * 0.219
Has a Certificate III/IV, Diploma or Associate Degree 0.125 0.071 0.135 0.101
Lives in the most disadvantaged areas (1st quintile) 0.106 0.096 0.175 0.156
Lives in next most disadvantaged areas (2nd quintile) -0.037 -0.071 -0.114 -0.051
Lives in next most advantaged areas (4th quintile) -0.053 -0.065 -0.098 -0.028
Lives in the most advantaged areas (5th quintile) -0.080 -0.095 -0.077 -0.065
Lives in a non-capital city -0.077 -0.034 -0.090 -0.041
Constant -1.971 *** -2.488 *** -3.218 *** -1.766 ***
Sample size 3,133 2,939 2,234 2,943
Source: ANUpoll, April 2021 and Life in AustraliaTM, February 2020.
Notes: Probit Regression Model. The base case individual is female; aged 35 to 44 years; non-Indigenous; born in Australia; does not speak a language other than English at home; has
completed Year 12 but does not have a post-graduate degree; lives in neither an advantaged or disadvantaged suburb (third quintile); and lives in a capital city. Coefficients
that are statistically significant at the 1 per cent level of significance are labelled ***; those significant at the 5 per cent level of significance are labelled **, and those significant
at the 10 per cent level of significance are labelled *.
20
The ANU Centre for Social Research and MethodsVaccine willingness and concerns in Australia – August 2020 to April 2021
Table 2 Factors associated with vaccine willingness, April 2021, those who have not
been vaccinated
Explanatory variables Model 1 Model 2
Coeff. Signif. Coeff. Signif.
Thinks it likely to get infected in next 6 months 0.177 **
Has been tested for COVID-19 0.193 ***
Anxious or worried due to COVID-19 0.411 ***
Confident in the Federal Government 0.028
Confident in public service 0.137 **
Confident in State/Territory government 0.242 ***
Confident in hospitals and the health system 0.296 ***
Female -0.217 *** -0.301 ***
Aged 18 to 24 years 0.451 *** 0.421 ***
Aged 25 to 34 years 0.033 0.037
Aged 45 to 54 years 0.093 0.175 **
Aged 55 to 64 years 0.355 *** 0.484 ***
Aged 65 to 74 years 0.584 *** 0.734 ***
Aged 75 years plus 0.624 *** 0.783 ***
Indigenous -0.130 -0.153
Born overseas in a main English-speaking country -0.015 -0.066
Born overseas in a non-English speaking country -0.059 -0.077
Speaks a language other than English at home -0.302 *** -0.303 ***
Has not completed Year 12 or post-school qualification -0.210 ** -0.125
Has a post graduate degree 0.403 *** 0.383 ***
Has an undergraduate degree 0.331 *** 0.292 ***
Has a Certificate III/IV, Diploma or Associate Degree -0.021 -0.002
Lives in the most disadvantaged areas (1st quintile) -0.196 ** -0.180 *
Lives in next most disadvantaged areas (2nd quintile) -0.153 * -0.144
Lives in next most advantaged areas (4th quintile) -0.114 -0.109
Lives in the most advantaged areas (5th quintile) -0.111 -0.152
Lives in a non-capital city -0.190 *** -0.169 **
Cut-point 1 -1.725 *** -1.020 ***
Cut-point 2 -1.091 *** -0.339 ***
Cut-point 3 -0.209 *** 0.582 ***
Sample size 2,756 2,734
Source: ANUpoll, April 2021
Notes: Probit Regression Model. The base case individual is female; aged 35 to 44 years; non-Indigenous; born in
Australia; does not speak a language other than English at home; has completed Year 12 but does not have a
post-graduate degree; lives in neither an advantaged or disadvantaged suburb (third quintile); and lives in a
capital city. Coefficients that are statistically significant at the 1 per cent level of significance are labelled ***;
those significant at the 5 per cent level of significance are labelled **, and those significant at the 10 per cent
level of significance are labelled *.
21
The ANU Centre for Social Research and MethodsVaccine willingness and concerns in Australia – August 2020 to April 2021
Table 3 Factors associated with vaccine willingness, August 2020, January 2021, and
April 2021, those who speak a language other than English
Explanatory variables Model 1
Coeff. Signif.
August 2020 0.122
January 2021 -0.440 ***
Discriminated against (October 2020) -0.247 *
Anxious or worried due to COVID-19 0.604 ***
Confident in the Federal Government 0.042
Confident in public service -0.084
Confident in State/Territory government 0.342 ***
Confident in hospitals and the health system 0.206
Female -0.192 *
Aged 65 to 74 years 0.202
Aged 75 years plus 0.118
Indigenous -0.928 ***
Born overseas in a main English-speaking country 0.269
Born overseas in a non-English speaking country 0.070
Has not completed Year 12 or post-school qualification -0.495
Has a post graduate degree 0.209
Has an undergraduate degree 0.014
Has a Certificate III/IV, Diploma or Associate Degree -0.448 ***
Lives in the most disadvantaged areas (1st quintile) -0.222
Lives in next most disadvantaged areas (2nd quintile) -0.050
Lives in next most advantaged areas (4th quintile) -0.200
Lives in the most advantaged areas (5th quintile) 0.187
Lives in a non-capital city -0.039
Cut-point 1 -1.453 ***
Cut-point 2 -0.768 ***
Cut-point 3 0.514 ***
Sample size 1,152
Source: ANUpoll, April 2021
Notes: Probit Regression Model. The base case individual is female; aged 18 to 64 years; non-Indigenous; born in
Australia; does not speak a language other than English at home; has completed Year 12 but does not have a
post-graduate degree; lives in neither an advantaged or disadvantaged suburb (third quintile); and lives in a
capital city. Coefficients that are statistically significant at the 1 per cent level of significance are labelled ***;
those significant at the 5 per cent level of significance are labelled **, and those significant at the 10 per cent
level of significance are labelled *.
22
The ANU Centre for Social Research and MethodsYou can also read