Validation of the bovine blood calcium checker as a rapid and simple measuring tool for the ionized calcium concentration in cattle
←
→
Page content transcription
If your browser does not render page correctly, please read the page content below
FULL PAPER
                                 Clinical Pathology

                                 Validation of the bovine blood calcium
                                 checker as a rapid and simple measuring tool
                                 for the ionized calcium concentration in cattle
                                 Kazuyuki SUZUKI1)*, Nao KONDO2), Kaede TAKAGI3), Akitoyo NISHIKAWA4),
                                 Yoshiki MURAKAMI1), Marina OTSUKA1), Kenji TSUKANO1), Keiko IKEDA1),
                                 Hisashi FUNAKURA3), Ichiro YASUTOMI5) and Satoshi KAWAMOTO1)
                                 1)The  School of Veterinary Medicine, Rakuno Gakuen University, 582 Midorimachi, Bunnkyoudai, Ebetsu,
                                   Hokkaido 069-8501, Japan
                                 2)Arekinai Livestock Veterinary Clinic, Hokkaido Higashi Agricultural Mutual Aid Association, 177-3 Kita1senn,

                                   Aza Arekinaigenya, Shibecha-cho, Kawakami-gun, Hokkaido 088-2272, Japan
                                 3)Ishigaki Bovine Hospital, Okinawa 907-0024, Japan
                                 4)Hamanaka Livestock Veterinary Clinic, Hokkaido Higashi Agricultural Mutual Aid Association, 33 Chanai-Midori,

                                   Hamanaka-cho, Akkeshi-gun, Hokkaido 088-1361, Japan
                                 5)Yubetsu Herd Management Service, 450-3 Baro, Yubetsu, Monbetsu-gun, Hokkaido 093-0731, Japan

                                    ABSTRACT. Point-of-care (POC) devices that veterinary practitioners can use to easily and rapidly
                                    measure blood ionized calcium (iCa) levels in cows immediately after withdrawing a blood sample
                                    on the dairy farm are needed. Aims of present studies was to compare the commercially available
                                    ion-selective electrode handheld iCa meter (bovine blood iCa checker) with the benchtop blood
                                    gas analyzer GEM premier 3500 and handheld analyzer i-STAT 1. Sixty-two paired-point whole
                                    blood samples were obtained from three cows with hypocalcemia experimentally induced by Na2-
                                    EDTA infusion. Whole blood samples were also obtained from the 36 cows kept on a farm in field
                                    conditions. The results using the bovine blood iCa checker correlated with those using the GEM
J. Vet. Med. Sci.                   premier 3500 and i-STAT 1. Bovine blood iCa checker was “compatible” with the GEM premier 3500
83(5): 767–774, 2021                and i-STAT 1 because the frequency of differences between the measurements within ± 20% of the
                                    mean were 100% (65/65, >75%) and 90.8% (59/65, >75%), respectively. In the field trial, the blood
doi: 10.1292/jvms.21-0001
                                    iCa concentration measured by the bovine blood Ca checker was significantly positively correlated
                                    with that measured by the i-STAT 1 portable analyzer. Bovine blood iCa checker was “compatible”
                                    with the i-STAT 1 because the frequency of differences between the measurements within ± 20%
Received: 4 January 2021
                                    of the mean was 100% (36/36, >75%). Results from these findings, the bovine blood iCa checker
Accepted: 18 March 2021
                                    may be applied as a simplified system to measure the iCa concentration in bovine whole blood.
Advanced Epub:
          26 March 2021
                                    KEY WORDS: cattle, hypocalcemia, ion-selective electrode, ionized calcium, point-of-care

   Hypocalcemia is a metabolic disorder in which homeostatic mechanisms fail to maintain normal blood Ca concentrations at
the onset of lactation [20, 29]. Although the incidence of clinical milk fever in the United States is approximately 5%, as many as
50% of periparturient dairy cows may have subclinical hypocalcemia, with total blood Ca concentrations being between 1.38 and
2.0 mM [7, 18]. As intravenous 22.5% calcium borogluconate infusion immediately induces a state of hypercalcemia, followed by
reduction of the whole blood ionized calcium (iCa) and serum total calcium (tCa) concentrations 24 hr later [28]. Therefore, it is
difficult to maintain an ideal blood calcium level without monitoring the blood calcium level [11].
   Blood calcium exists in 3 fractions as follows: iCa, complexed (cCa), and protein-bound calcium (pCa) [23]. Indeed, Martinez
et al. [21] defined subclinical hypocalcemia as a blood iCa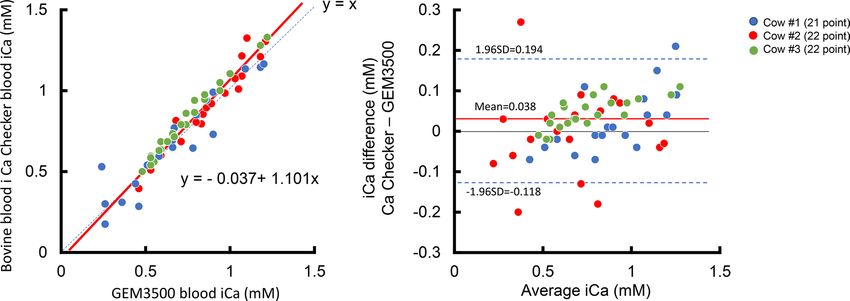
K. SUZUKI ET AL.

the clinical diagnosis and treatment of hypocalcemia.
   The blood iCa concentration is generally measured using conventional blood gas analyzers in diagnostic laboratories and
teaching animal hospitals, which is not suitable for farm animal practice. Point-of-care (POC) devices that veterinary practitioners
can use to easily and rapidly measure blood iCa levels in cows immediately after withdrawing a blood sample on the dairy farm
are needed. The i-STAT 1 (Abbott Point-of-Care, Abbott Laboratories, Chicago, IL, USA) is a popular POC analyzer for bovine
practice [4] that measures blood gases, glucose [24], L-lactate [12, 17] and several electrolytes including K+, Na+, Cl− and iCa
concentrations with gas- and ion‐selective electrode potentiometry. A recent validation study revealed that the i-STAT 1 was
suitable for measuring the iCa concentration in whole blood [31]. On the other hand, an ion-selective electrode handheld meter,
the bovine blood iCa checker (LAQUAtwin-Ca-11C, HORIBA Advanced Techno, Kyoto, Japan), recently became available for
measurement of the iCa concentration in whole blood. These handheld meters have the potential to facilitate cow-side diagnosis
and treatment of clinical and subclinical hypocalcemia [23]. However, accuracy control is required to use POC devices with
the ion-selective electrode method to measure iCa to diagnose hypocalcemia in cows. The objective of this study was to assess
an optimized ion-selective electrode Ca-module prototype, bovine blood iCa checker, as a potential cow-side device for iCa
measurements in bovine blood within the broad iCa range expected for hypocalcemic cows. In this study, the accuracy of the
bovine blood iCa checker and handheld gas analyzer i-STAT 1 were evaluated using the laboratory benchtop blood gas analyzer
GEM premier 3500 (Werfen Group IVD, Barcelona, Spain) as a gold standard method. After completing the laboratory-level
precision and accuracy control tests of bovine blood iCa checker and handheld gas analyzer i-STAT 1, we evaluated whether
bovine blood iCa checker is useful as a POC device in bovine clinical practice using i-STAT 1 as control.

MATERIALS AND METHODS
   All procedures were performed in accordance with the Good for the Care and Use of Laboratory Animals of the School of
Veterinary Medicine at Rakuno Gakuen University (Approved #: VH15C18). This series of studies consisted of two parts: (1)
laboratory-level precision and accuracy control tests, and (2) clinical trials carried out in the northeast and southwest regions in Japan.
   In this study, the GEM premier 3500 and i-STAT 1 were used to evaluate the accuracy and clinical usefulness of the bovine
blood iCa checker for measuring iCa levels in cattle. The measurement range and the recommended environment for the three
iCa concentration measuring instruments used in this study are summarized in Table 1. These values were taken from the
manufacturer’s instruction manual.

Laboratory-level precision and accuracy control tests
   Three non-pregnant, non-lactating, and multiparous cows (731 ± 27 kg, 7.0 ± 0.9-year-old; mean ± SD) were enrolled in this
study. During the experiment, the cows were housed in a stanchion barn at the university. Three mature cows received aqueous
solution containing 5% disodium ethylenediaminetetraacetate (Na2-EDTA, Wako Pure Chemical Industries, Osaka, Japan)
intravenously (IV) at a flow rate of 1.2 ml/kg/hr. Blood samples were taken before and at 10 min intervals up to 3 hr after the
initiation of Na2-EDTA infusion. Na2-EDTA has been used in infusion studies in cows and other species for more than 35 years,
primarily for the induction of hypocalcemia as a model for milk fever [14, 19, 22, 26]. Na2-EDTA infusion may therefore be a valid
model of spontaneous hypocalcemia [26]. In the hypocalcemic cow model, an infusion rate of 1.2 ml/kg/hr of a 5% (w/v) solution
has been suggested as the standard [14, 15, 19, 22].
   A total 65 point-paired were collected from cows that underwent Na2-EDTA infusion at any time (21, 22 and 22 point-paired
blood samples from 3 cows, respectively). The iCa determinations was performed in anaerobically handled whole blood samples
with paying attention to dead space. Whole Blood samples were collected via jugular vein venipuncture using 18-gauge regular
bevel needle and 5 ml syringe (Terumo Co., Ltd., Tokyo, Japan). The syringe was added heparin sodium solution (AY Pharma, Co.,
Ltd., Tokyo, Japan) that the final concentration of 10 IU/ml when 5 ml of blood was filled (50 µl of 1,000 IU/ml heparin sodium
solution / syringe). Immediately after blood collection and rolling syringes between the hand to mixing blood and anticoagulant (≤5
min), sample were measured iCa concentration using each test device at same time. The concentration range of iCa measured using
the desktop blood gas analyzer was 0.24 to 1.22 mM. This range is appropriate because it includes low iCa concentrations from
cows with severe hypocalcemia cattle to normal concentrations in healthy cows.
   The appearance and operation of the bovine blood iCa checker are shown in Fig. 1. Immediately before measuring iCa by these
analyzers, a drop of blood (more than 0.3 ml) was applied directly to the end of a test strip for the bovine blood iCa checker from

                 Table 1. Performance comparison of the ionized calcium concentration measuring device used in this study
                                                              GEM premier 3500           i-STAT 1       Bovine blood iCa checker
                                   Type
                                                                  The desktop                         The handheld
                 Ionized calcium          Range (mM)               0.10–5.00             0.25–2.50              0.1–5.0
                 Usage environment        Temparature (°C)           15–35                 17–30                  5–40
                                          Humidity (%)                5–90
VALIDATION OF THE BOVINE CALCIUM CHECKER

      Fig. 1. The bovine blood iCa checker (HORIBA LAQUAtwin-Ca-11C). The appearance of the bovine blood iCa checker (left). Drop
         0.3 or more milliliters of blood onto the sensor (right upper), close the light cover, and press the MEAS button to measure the iCa
         concentration and display the results (right bottom). It takes less than 3 min from initiation of calibration to display the results.

a syringe. The MEAS button was pressed immediately after closing the light cover of the bovine blood iCa checker, and the results
appeared on the display immediately. This POC instrument has a measurement range of 0.1 to 5.0 mM and is calibrated by 2-point
calibration (1.25 and 2.50 mM) before measurement. It takes less than 3 min from initiation of the calibration to display the results.
Blood iCa measurement by the bovine blood iCa checker was performed in duplicate, and the mean value was used for statistics.
The median value of the coefficient of variation for iCa measurement was 0.04 mM and the range were 0.00 to 0.12 mM.

The clinical trials carried out used cattle with or without hypocalcemia in the bovine farm
   Clinical trials were conducted in two locations, the northern (Kushiro City, Hokkaido, latitude of 42°59’ 5.47”N and a longitude
of 144°22’52.88”E) and the southern regions of Japan (Ishigaki City, Okinawa Prefecture, latitude of 24°28’0.12”N and a longitude
of 124°13’58.80”E). The duration (average temperature [range]) of clinical trials in the northern and southern regions were March-
May (7.1°C, [−2°C to17°C]) and July-August 2019 (30.1°C, [27°C to 34°C]), respectively. In the clinical trials, a total of 36 blood
samples drawn from 6 and 3 commercial farms in the northern and southern regions, respectively, were used to measure the iCa
concentration by the bovine blood iCa checker and i-STAT 1 portable analyzer. In a clinical trial conducted in the northern region
of Japan, total 16 Holstein dairy cows were enrolled and consisted 6 cows immediately after calving, 6 cows being treated for
hypocalcemia within 1 week after calving, and 4 healthy cows. In a clinical trial conducted in the southern region of Japan, total 20
Japanese black beef cows were enrolled and consisted 4 cows before expected calving within 1 week, 5 cows after calving within 5
days, and 12 cows that were patients but not hypocalcemia.
   The ranges of the outside air temperature at the time of blood collection and blood iCa concentration using the bovine blood
iCa checker were −2 to 34°C and 0.370 to 1.260 mM, respectively. The i-STAT 1 was used under the temperature environment
of 17 to 30°C, whereas the bovine blood iCa checker was used beside cows regardless of the outside temperature. Therefore,
the measurement of blood iCa concentration by the i-STAT 1 portable analyzer was performed beside the cow if the outside air
temperature was within 17 to 30°C. However, blood iCa measurement by i-STAT 1 was conducted in an office room of farm with a
controlled temperature environment of 17 to 30°C if outside temperature is otherwise.

Statistical analysis
   Data were analyzed statistically by Deming regression and Bland-Altman plot using a commercial statistical software program
(XLSTAT ver.2020.3 software program, New York, NY, USA). The Bland-Altman plot as the limits of agreement method for
assessing the agreement between two methods of medical measurement is widely used. In the clinical trial, pairs of observations
using the two methods are independent, Bland-Altman plot analysis were used to assessing the residuals. However, laboratory-
level precision trials obtained repeated pairs of measurements on the same subject. Therefore, repeated Bland-Altman plot were
performed using an above commercial statistical software to analyzing such clustered observations, both when the underlying
quantity is assumed to be changing and when it is not [3, 13, 32]. A repeated Bland-Altman approach is to average the repeated
measurements for each subject and use only number of subject’s pairs of means to calculate the 95% limits [3]. These limits are
narrower than the correct ones. There is little difference because there is much more variation between the subjects than for the
repeated observations on a single subject [3].
   As a result of comparing the methods, it can be concluded that the results are “compatible” when the degree of agreement
between the new method and the standard method is good. In this study, the ratio of the difference between the paired
measurements to the mean was defined as the “relative error (RE)”. If the number of measurements with a relative error of ± 20%
or less is within 75% of the total number of measurements, it was considered “compatible” [10]. The significance level was set at
P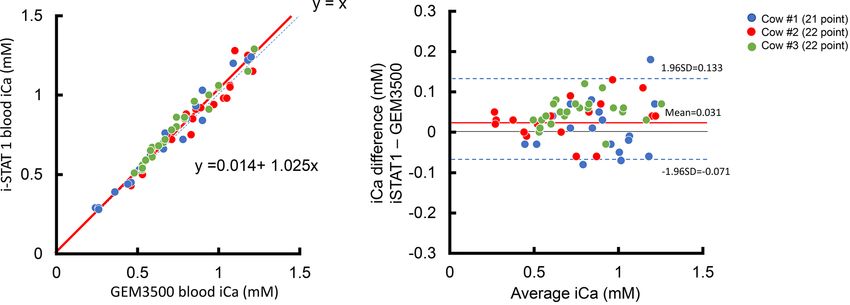
K. SUZUKI ET AL.

RESULTS
Laboratory-level precision and accuracy control tests
   The data are plotted with the i-STAT 1 on the y-axis and the GEM premier 3500 as reference method on the x-axis under the
laboratory condition in Fig. 2. Deming regression analysis reveals intercept=0.014 (95% confidence interval [CI]= −0.023 to 0.050)
and slope=1.025 (95%CI=0.970 to 1.080). The concordance correlation coefficient is 0.979, which is considered as indicating
almost perfect performance. Plotting of the residuals between the i-STAT 1 and GEM premier 3500 results against their means
revealed that the i-STAT 1 readings were, on average, 0.031 mM higher. Overall, 93.5% of the observations were between the
95%CI in the Bland-Altman plot, demonstrating good agreement (Fig. 2). In addition, i-STAT 1 was “compatible” with the GEM
premier 3500 because the frequency of differences between the measurements within ± 20% of the mean was 100% (65/65, >75%).
   In Fig. 3, the data are plotted with the bovine blood iCa checker on the y-axis and the GEM premier 3500 as reference method
on the x-axis under the laboratory condition. Deming regression analysis reveals intercept= −0.037 (95%CI= −0.124 to 0.050) and
slope=1.101 (95%CI=0.998 to 1.204). The concordance correlation coefficient is 0.959, which is considered as indicating almost
perfect performance. Plotting of the residuals between bovine blood iCa checker and GEM premier 3500 results against their
means revealed that bovine blood iCa checker readings were, on average, 0.038 mM higher. Overall, 91.9% of the observations
were between the 95%CI in the Bland-Altman plot, demonstrating good agreement (Fig. 3). In addition, bovine blood iCa checker
was “compatible” with the GEM premier 3500 because the frequency of differences between the measurements within ± 20% of
the mean was 90.8% (59/65, >75%).
   In Fig. 4, the data are plotted with the bovine blood iCa checker on the y-axis and the i-STAT 1 as reference method on the
x-axis under the laboratory condition. Deming regression analysis reveals intercept= −0.050 (95%CI= −0.128 to 0.028) and
slope=1.073 (95%CI=0.980 to 1.166). The concordance correlation coefficient is 0.971, which is considered as indicating almost
perfect performance. Plotting of the residuals between the bovine blood iCa checker and i-STAT 1 results against their means
revealed that the bovine blood iCa checker results were, 0.007 mM higher on average, respectively. Overall, 91.9% of the
observations were between the 95% CI in the Bland-Altman plot, demonstrating good agreement (Fig. 4). In addition, bovine blood
iCa checker was “compatible” with the i-STAT 1 because the frequency of differences between the measurements within ± 20% of
the mean was 92.3% (60/60, >75%).

The clinical trials carried out used cattle with or without hypocalcemia in the bovine farm
   In Fig. 5, the data are plotted with the bovine blood iCa checker on the y-axis and the i-STAT 1 as reference method on the
x-axis in the field condition. Deming regression analysis reveals intercept= −0.100 (95%CI= −0.325 to 0.125) and slope=1.044
(95%CI=0.827 to 1.262). Therefore, it was suggested that there was no proportional bias between i-STAT 1 and bovine blood iCa
checker in field environment condition, as the 95% CI for the intercept and slope contained 0 and 1, respectively. The concordance
correlation coefficient is 0.884, which is considered as indicating almost perfect performance. Plotting of the residuals between the
bovine blood iCa checker and i-STAT 1 results against their means revealed that the bovine blood iCa checker readings were, on
average, −0.053 mM lower. Overall, 94.4% of the observations were between the 95%CI in the Bland-Altman plot, demonstrating
good agreement (Fig. 5). In addition, bovine blood iCa checker was “compatible” with the i-STAT 1 because the frequency of
differences between the measurements within ± 20% of the mean was 100% (36/36, >75%).

Fig. 2. Deming regression (A) and Bland-Altman plot (B) of whole blood ionized calcium (iCa) concentrations among the i-STAT 1 and labora-
   tory benchtop blood gas analyzer GEM premier 3500 under the laboratory condition. Sixty-two paired-point whole blood samples were
   obtained from three cows with hypocalcemia experimentally induced by Na2-EDTA infusion. A: The dashed and solid line represents the line of
   identity (y=x) and the regression line with intercept=0.014 (95% confidence limits [95%CI]: −0.023 to 0.050) and slope=1.025 (95%CI: 0.970
   to 1.080), respectively. B: The solid line represents the mean difference between the 2 methods and the 95%CI are indicated by the dashed lines.

J. Vet. Med. Sci. 83(5): 767–774, 2021                                                                                                        770
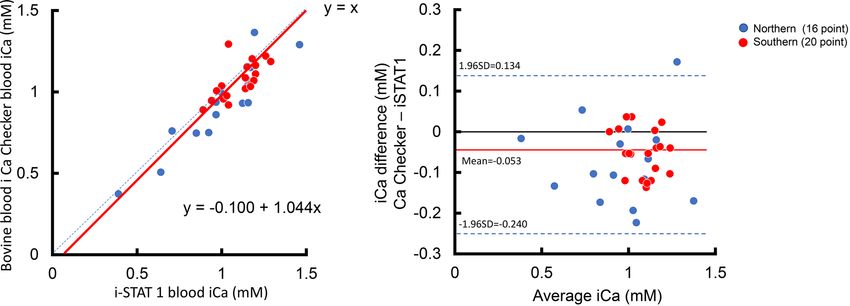
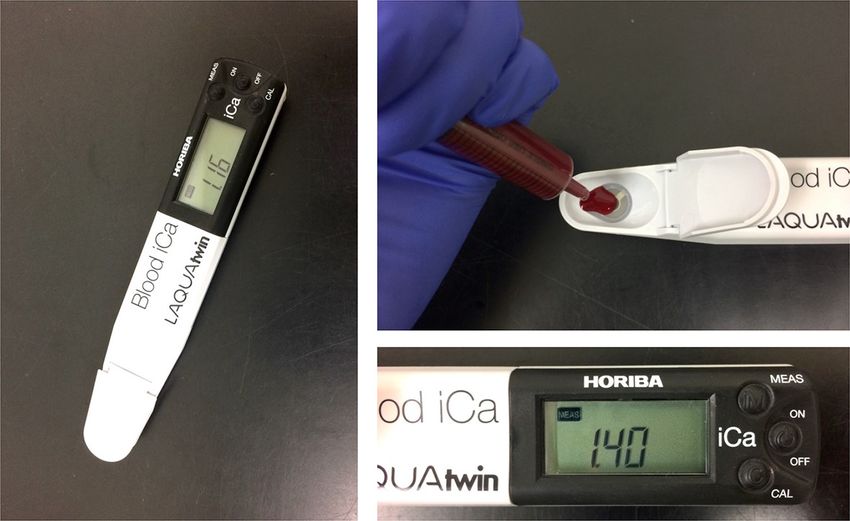
VALIDATION OF THE BOVINE CALCIUM CHECKER

Fig. 3. Deming regression (A) and Bland-Altman plot (B) of whole blood ionized calcium (iCa) concentrations among the bovine blood iCa
   checker and laboratory benchtop blood gas analyzer GEM premier 3500 under the laboratory condition. Sixty-two paired-point whole blood
   samples were obtained from three cows with hypocalcemia experimentally induced by Na2-EDTA infusion. A: The dashed and solid line
   represents the line of identity (y=x) and the regression line with intercept= −0.037 (95% confidence interval [95%CI]: −0.124 to 0.050) and
   slope=1.101 (95%CI: 0.998 to 1.204), respectively under the laboratory condition. B: The solid line represents the mean difference between the
   2 methods and the 95%CI are indicated by the dashed lines.

Fig. 4. Deming regression (A) and Bland-Altman plot (B) of whole blood ionized calcium (iCa) concentrations among the bovine blood iCa
   checker and the i-STAT 1 under the laboratory condition. Sixty-two paired-point whole blood samples were obtained from three cows with
   hypocalcemia experimentally induced by Na2-EDTA infusion. A: The dashed and solid line represents the line of identity (y=x) and the regres-
   sion line with intercept= −0.050 (95% confidence interval [95%CI]: −0.128 to 0.028) and slope=1.073 (95%CI: 0.980 to 1.166), respectively.
   B: The solid line represents the mean difference between the 2 methods and the 95%CI are indicated by the dashed lines.

Fig. 5. Deming regression (A) and Bland-Altman plot (B) of whole blood ionized calcium (iCa) concentrations among the bovine blood iCa
   checker and the i-STAT 1 under the on-farm condition. Thirty-six paired-point whole blood samples were obtained from each cow in com-
   mercial farm. A: The dashed and solid line represents the line of identity (y=x) and the regression line with intercept= −0.100 (95% confidence
   interval [95%CI]: −0.325 to 0.125) and slope=1.044 (95%CI: 0.827 to 1.262), respectively. B: The solid line represents the mean difference
   between the 2 methods and the 95%CI are indicated by the dashed lines.

J. Vet. Med. Sci. 83(5): 767–774, 2021                                                                                                        771
K. SUZUKI ET AL.

DISCUSSION
   This series of studies that consisted of laboratory-level precision and accuracy control tests, and clinical trials were to compare
the commercially available ion-selective electrode handheld iCa meter (bovine blood iCa checker) with the benchtop blood gas
analyzer GEM premier 3500 and handheld analyzer i-STAT 1. In addition, the iCa measurements by the bovine blood iCa checker
in the field were markedly highly correlated and homologous with those by the i-STAT 1 regardless of ambient temperature. Based
on these findings, the bovine blood iCa checker may be applied as a simplified system to measure the iCa concentration in bovine
whole blood.
   The concentration of iCa in blood preanalytical may be affected by pH changes of the sample, calcium binding by heparin, and
dilution by the anticoagulant solution [6]. The iCa binding by heparin can be minimized by a final concentration of heparin sodium
solution of 15 IU/ ml blood or less [6]. The main causes of pH changes in vitro are loss of bicarbonate by non-anaerobic handling
and formation of lactic acid. Therefore, pH changes of the sample were avoided by anaerobic handling, rolling to mixing sample
by hand and minimizing the delay before measurement (≤15 min) [5]. Therefore, whole blood was anaerobically carefully collected
using a syringe containing 50 IU sodium heparin solution (final concentration of 10 IU/ml -blood) and subjected to measurement
for iCa concentration within 5 min in the present study [5, 6].
   Whole blood iCa concentrations measured by the GEM premier 3500 blood gas analyzer were considered the reference values
in laboratory-level precision and accuracy control tests. Deming regression model analysis was also performed in this study [16].
Whereas the ordinary linear regression method assumes that only the Y measurements are associated with random measurement
errors, the Deming method takes measurement errors for both methods into account [8]. The standard deviation (SD) of the
residual error of regression calculated as a measure of the random error in the regression line due to all correlation coefficients
was markedly influenced by the range of the data [9]. In 1983 Altman and Bland [2] proposed an alternative analysis, based on the
quantification of the agreement between two quantitative measurements by studying the mean difference and constructing limits of
agreement. In this study, the Bland-Altman plot were used to assess the residuals between results from the two devices and those of
the laboratory tests.
   Even if the measurement accuracy and sensitivity of the benchtop type blood gas analyzer such as GEM premier 3500 are
excellent, it is not suitable using field condition since not possible to measure the blood gases immediately after sampling from
cow. Therefore, before conducting this series of studies, it was verified with GME3500 as reference device whether handheld
analyzer i-STAT 1 was suitable as a reference device for clinical trials. As a result, it is suggested that the iCa measurement
ability of i-STAT 1 is markedly highly correlated and homologous when the GEM premier 3500 is used as the reference method.
This study confirmed previous reports that iCa concentrations in bovine blood measured by the i-STAT 1 agree with those by the
radiometer as the reference method, and that the i-STAT 1 can predict hypocalcemia with a high sensitivity [30]. Therefore, the
i-STAT 1 is a useful POC instrument to measure the iCa concentration in cows, consistent with previous studies that it is suitable
for measuring the iCa concentration in whole blood [31].
   Results from laboratory-level precision study, the iCa measurement ability of the bovine blood iCa checker is markedly
highly correlated and homologous when the GEM premier 3500 and i-STAT 1 are used as the reference methods. Therefore, the
bovine blood iCa checker is a useful POC instrument to measure the iCa concentration, similar to i-STAT 1. Although the bovine
blood iCa checker was satisfactory in the quality control test using an experimental hypocalcemic cow model in the laboratory
environment, it is necessary to investigate whether it can be clinically applied in the field environment.
   The i-STAT 1 is an excellent POC for use in small animal [28], equine [27], and cattle practice [4, 17, 24, 30]. However, due to
its structure, a temperature environment between 17°C and 30°C (62.6–86.0°F) is required. Unlike the i-STAT 1, no temperature
conditions must be met to use the bovine blood iCa checker because it is not equipped with a measurement heater. This is highly
advantageous for bovine practice since measurement is possible unless the sample freezes.
   It is well known that the i-STAT 1 is superior for blood gas and biochemistry analysis when performing screening tests [4, 17,
24, 30]. The bovine blood iCa checker simplifies blood iCa concentration measurement as a cow-side test regardless of the ambient
temperature. Therefore, depending on the clinical situation, bovine practitioners can determine the treatment method for milk fever
and hypocalcemia at the farm by using the either in i-STAT 1 that can simultaneously measure other parameters or bovine blood Ca
checker that can easily measure only iCa concentration.
   In the clinical trial, pairs of observations using the two methods are independent, Bland-Altman plot analysis were very simple
and straightforward due to different subjects. However, laboratory-level precision trials obtained repeated pairs of measurements on
the same subject. Therefore, Bland-Altman analysis were performed using an above commercial statistical software to analyzing
such clustered observations, both when the underlying quantity is assumed to be changing and when it is not [3, 13, 32]. A repeated
Bland-Adams approach is to average the repeated measurements for each subject and use only number of subject’s pairs of means
to calculate the 95% limits. That analysis would be expected to give limits that are too narrow.
   The clinical trials conducted in the farm environment cow-side also revealed that the high accuracy in blood iCa measurement
of the bovine blood iCa checker was similar to that of the iSTAT1 as a reference device, as in the laboratory experiment using the
experimental hypocalcemic cow model.
   In conclusion, the bovine blood iCa checker and i‐STAT 1 are useful POC analyzers that can be used safely, rapidly, and
simply in animal hospitals, ambulatory clinics, and dairy farms to evaluate the blood iCa concentration in cows. Moreover, bovine
practitioners can rapidly decide the treatment method for milk fever and hypocalcemia beside the cow because the bovine blood Ca
checker can measure the iCa concentration regardless of ambient temperature.

J. Vet. Med. Sci. 83(5): 767–774, 2021                                                                                           772
VALIDATION OF THE BOVINE CALCIUM CHECKER

CONFLICT OF INTEREST DECLARATION. None of the authors have any financial or personal relationships that may have
inappropriately influenced or biased the content of the paper. In addition, authors declare no off-label use of antimicrobials and
human ethics approval was not needed for this study.

ACKNOWLEDGMENTS. The authors thank Dr. Tanaka R, Dr. Ishihara S and Mr. Matsune K for their assistance.

REFERENCES

 1. Agnes, F., Sartorelli, P., Bisso, M. C. and Dominoni, S. 1993. Ionized calcium in calf serum: relation to total serum calcium, albumin, total protein
    and pH. Zentralbl. Veterinärmed. A 40: 605–608. [Medline] [CrossRef]
 2. Altman, D. G. and Bland, J. M. 1983. Measurement in medicine: the analysis of method comparison studies. Statistician 32: 307–317. [CrossRef]
 3. Bland, J. M. and Altman, D. G. 2007. Agreement between methods of measurement with multiple observations per individual. J. Biopharm. Stat.
    17: 571–582. [Medline] [CrossRef]
 4. Bleul, U. and Götz, E. 2014. Evaluation of the i-STAT portable point-of-care analyzer for determination of blood gases and acid-base status in
    newborn calves. J. Vet. Emerg. Crit. Care (San Antonio) 24: 519–528. [Medline] [CrossRef]
 5. Boink, A. B., Buckley, B. M., Christiansen, T. F., Covington, A. K., Maas, A. H., Müller-Plathe, O., Sachs, C. and Siggaard-Andersen, O. 1991.
    IFCC recommendation on sampling, transport and storage for the determination of the concentration of ionized calcium in whole blood, plasma and
    serum. J. Automat. Chem. 13: 235–239. [Medline] [CrossRef]
 6. Boink, A. B., Buckley, B. M., Christiansen, T. F., Covington, A. K., Maas, A. H., Müller-Plathe, O., Sachs, C. and Siggaard-Andersen, O. 1992.
    Recommendation on sampling, transport, and storage for the determination of the concentration of ionized calcium in whole blood, plasma, and
    serum. IFC Scientific Division, Working Group on Ion-Selective Electrodes (WGSE). J. Int. Fed. Clin. Chem. 4: 147–152. [Medline]
 7. Chamberlin, W. G., Middleton, J. R., Spain, J. N., Johnson, G. C., Ellersieck, M. R. and Pithua, P. 2013. Subclinical hypocalcemia, plasma
    biochemical parameters, lipid metabolism, postpartum disease, and fertility in postparturient dairy cows. J. Dairy Sci. 96: 7001–7013. [Medline]
    [CrossRef]
 8. Cornbleet, P. J. and Gochman, N. 1979. Incorrect least-squares regression coefficients in method-comparison analysis. Clin. Chem. 25: 432–438.
    [Medline] [CrossRef]
 9. Cornbleet, P. J. and Shea, M. C. 1978. Comparison of product moment and rank correlation coefficients in the assessment of laboratory method-
    comparison data. Clin. Chem. 24: 857–861. [Medline] [CrossRef]
10. Critchley, L. A. and Critchley, J. A. 1999. A meta-analysis of studies using bias and precision statistics to compare cardiac output measurement
    techniques. J. Clin. Monit. Comput. 15: 85–91. [Medline] [CrossRef]
11. da Silva, D. C., Fernandes, B. D., Dos Santos Lima, J. M., Rodrigues, G. P., Dias, D. L. B., de Oliveira Souza, E. J. and Filho, M. A. M. 2019.
    Prevalence of subclinical hypocalcemia in dairy cows in the Sousa city micro-region, Paraíba state. Trop. Anim. Health Prod. 51: 221–227.
    [Medline] [CrossRef]
12. Figueiredo, M. D., Nydam, D. V., Perkins, G. A., Mitchell, H. M. and Divers, T. J. 2006. Prognostic value of plasma L-lactate concentration
    measured cow-side with a portable clinical analyzer in Holstein dairy cattle with abomasal disorders. J. Vet. Intern. Med. 20: 1463–1470. [Medline]
    [CrossRef]
13. Giavarina, D. 2015. Understanding Bland Altman analysis. Biochem. Med. (Zagreb) 25: 141–151. [Medline] [CrossRef]
14. Hansen, S. S., Nørgaard, P., Pedersen, C., Jørgensen, R. J., Mellau, L. S. and Enemark, J. D. 2003. The effect of subclinical hypocalcaemia induced
    by Na2EDTA on the feed intake and chewing activity of dairy cows. Vet. Res. Commun. 27: 193–205. [Medline] [CrossRef]
15. Jørgensen, R. J., Nyengaard, N. R., Daniel, R. C., Mellau, L. S. and Enemark, J. M. 1999. Induced hypocalcaemia by Na2EDTA infusion. A review.
    Zentralbl. Veterinärmed. A 46: 389–407. [Medline] [CrossRef]
16. Jensen, A. L. and Kjelgaard-Hansen, M. 2006. Method comparison in the clinical laboratory. Vet. Clin. Pathol. 35: 276–286. [Medline] [CrossRef]
17. Karapinar, T., Kaynar, O., Hayirli, A. and Kom, M. 2013. Evaluation of 4 point-of-care units for the determination of blood l-lactate concentration
    in cattle. J. Vet. Intern. Med. 27: 1596–1603. [Medline] [CrossRef]
18. Leno, B. M., Martens, E. M., Felippe, M. J. B., Zanzalari, K. P., Lawrence, J. C. and Overton, T. R. 2017. Short communication: Relationship
    between methods for measurement of serum electrolytes and the relationship between ionized and total calcium and neutrophil oxidative burst
    activity in early postpartum dairy cows. J. Dairy Sci. 100: 9285–9293. [Medline] [CrossRef]
19. Liesegang, A., Eicher, R., Sassi, M. L., Risteli, J., Riond, J. L. and Wanner, M. 2000. The course of selected bone resorption marker concentrations
    in response to short-term hypocalcemia experimentally induced with disodium EDTA infusions in dairy cows. J. Vet. Med. A Physiol. Pathol. Clin.
    Med. 47: 477–487. [Medline] [CrossRef]
20. Martinez, N., Sinedino, L. D. P., Bisinotto, R. S., Daetz, R., Lopera, C., Risco, C. A., Galvão, K. N., Thatcher, W. W. and Santos, J. E. P. 2016.
    Effects of oral calcium supplementation on mineral and acid-base status, energy metabolites, and health of postpartum dairy cows. J. Dairy Sci. 99:
    8397–8416. [Medline] [CrossRef]
21. Martinez, N., Sinedino, L. D., Bisinotto, R. S., Ribeiro, E. S., Gomes, G. C., Lima, F. S., Greco, L. F., Risco, C. A., Galvão, K. N., Taylor-
    Rodriguez, D., Driver, J. P., Thatcher, W. W. and Santos, J. E. 2014. Effect of induced subclinical hypocalcemia on physiological responses and
    neutrophil function in dairy cows. J. Dairy Sci. 97: 874–887. [Medline] [CrossRef]
22. Mellau, L. S., Jørgensen, R. J. and Enemark, J. M. 2001. Plasma calcium, inorganic phosphate and magnesium during hypocalcaemia induced by a
    standardized EDTA infusion in cows. Acta Vet. Scand. 42: 251–260. [Medline] [CrossRef]
23. Neves, R. C., Stokol, T., Bach, K. D. and McArt, J. A. A. 2018. Method comparison and validation of a prototype device for measurement of
    ionized calcium concentrations cow-side against a point-of-care instrument and a benchtop blood-gas analyzer reference method. J. Dairy Sci. 101:
    1334–1343. [Medline] [CrossRef]
24. Nishi, Y., Murakami, Y., Otsuka, M., Tsukano, K., Ajito, T. and Suzuki, K. 2019. Accuracy of the point-of-care glucose meter for use in calves. J.
    Vet. Med. Sci. 81: 1301–1304. [Medline] [CrossRef]
25. Schenck, P. A. and Chew, D. J. 2010. Prediction of serum ionized calcium concentration by serum total calcium measurement in cats. Can. J. Vet.
    Res. 74: 209–213. [Medline]
26. Schonewille, J. T., Van’t Klooster, A. T., Wouterse, H. and Beynen, A. C. 1999. Hypocalcemia induced by intravenous administration of disodium
    ethylenediaminotetraacetate and its effects on excretion of calcium in urine of cows fed a high chloride diet. J. Dairy Sci. 82: 1317–1324. [Medline]

J. Vet. Med. Sci. 83(5): 767–774, 2021                                                                                                              773
K. SUZUKI ET AL.
[CrossRef]
27. Silverman, S. C. and Birks, E. K. 2002. Evaluation of the i-STAT hand-held chemical analyser during treadmill and endurance exercise. Equine Vet.
J. Suppl. 34: 551–554. [Medline] [CrossRef]
28. West, E., Bardell, D. and Senior, J. M. 2014. Comparison of the EPOC and i-STAT analysers for canine blood gas and electrolyte analysis. J. Small
Anim. Pract. 55: 139–144. [Medline] [CrossRef]
29. Wilms, J., Wang, G., Doelman, J., Jacobs, M. and Martín-Tereso, J. 2019. Intravenous calcium infusion in a calving protocol disrupts calcium
homeostasis compared with an oral calcium supplement. J. Dairy Sci. 102: 6056–6064. [Medline] [CrossRef]
30. Yildirim, E., Karapinar, T. and Hayirli, A. 2015. Reliability of the i-STAT for the determination of blood electrolyte (K+, Na+, and CI-)
concentrations in cattle. J. Vet. Intern. Med. 29: 388–394. [Medline] [CrossRef]
31. Yilmaz, O. and Karapinar, T. 2019. Evaluation of the i-STAT analyzer for determination of ionized calcium concentrations in bovine blood. Vet.
Clin. Pathol. 48: 31–35. [Medline] [CrossRef]
32. Zou, G. Y. 2013. Confidence interval estimation for the Bland-Altman limits of agreement with multiple observations per individual. Stat. Methods
Med. Res. 22: 630–642. [Medline] [CrossRef]
J. Vet. Med. Sci. 83(5): 767–774, 2021 774You can also read