Variation in outcomes in sexual and reproductive health in England - A toolkit to explore inequalities at a local level
←
→
Page content transcription
If your browser does not render page correctly, please read the page content below
Variation in outcomes in sexual and
reproductive health in England
A toolkit to explore inequalities at a local
level

1
A toolkit to explore inequalities in sexual and reproductive health at a local level

Contents
1. Introduction .............................................................................................................................. 3
   Why explore variation? ............................................................................................................. 3
2. Variation and inequalities within sexual and reproductive health ............................................. 4
   Description of variation ............................................................................................................. 4
   Health inequalities .................................................................................................................... 4
   Variation and inequalities in sexual and reproductive health outcomes ................................... 6
3. Questions to ask about sexual and reproductive health to identify inequalities...................... 17
4. Evaluating actions .................................................................................................................. 31
5. How to use available data to explore the questions ............................................................... 32

Note: This document was developed pre–coronavirus (COVID–19). As in other areas of health
provision, the pandemic may have exacerbated pre–existing inequalities in terms of sexual
health outcomes, including through the shift from face to face to remote service provision.
Sexual Health services are continuing to adapt their service delivery models including
increasing online provision. It is likely that COVID–19 will have an impact on trends in sexual
health data. A number of resources have been developed to support local areas to explore the
impact of changes to sexual and reproductive health service delivery – these can be found here.
A surveillance report showing the impact of the COVID–19 pandemic and response on
prevention, testing, diagnosis and care for sexually transmitted infections (STIs), human
immunodeficiency virus (HIV) and hepatitis in England has also been published.

                                                                       2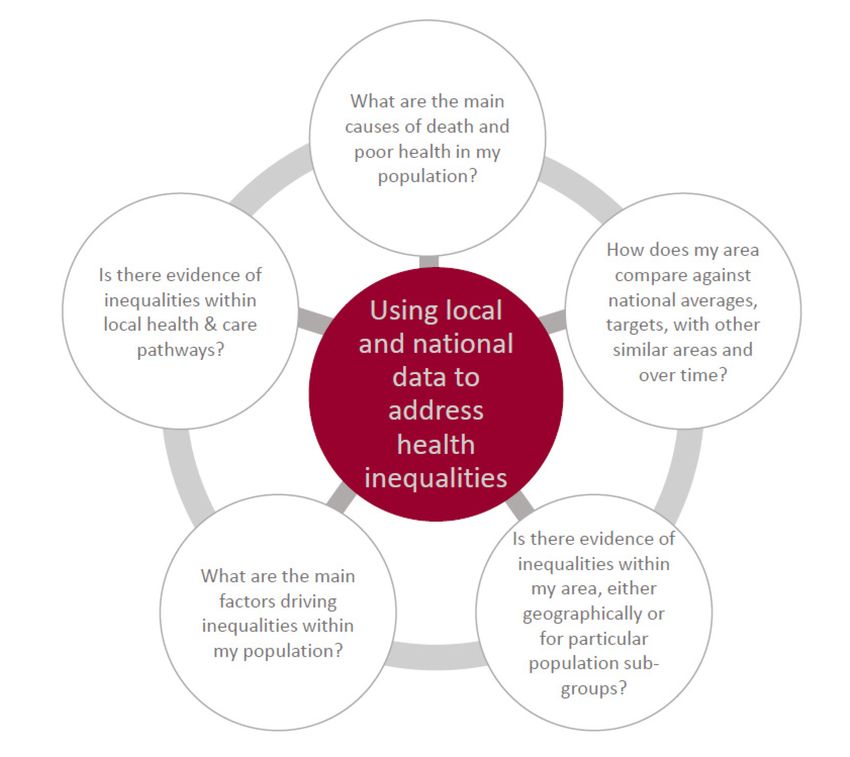
A toolkit to explore inequalities in sexual and reproductive health at a local level

1. Introduction
In most aspects of sexual and reproductive health variations in outcomes are evident between
and within local areas and populations or communities. Some of these differences have a clear
relationship with social and health inequalities; and may be impacted by differences in
behaviour, social networks and risk exposures. Others may indicate geographic variation in
local populations’ demographics or in access to, and use of sexual and reproductive health
services, or in the availability and provision of interventions.

The purpose of this toolkit is to use existing data about sexual and reproductive health
indicators between and within local authority areas to understand where variation occurs,
identify the principal causes and underlying factors and inform ways to target and reduce sexual
and reproductive health inequality and improve outcomes.

Why explore variation?
There are a number of reasons why this is important:

• many sexual and reproductive health indicators are deteriorating nationally – a review
  and action at a local level is needed to halt or reverse the trend
• a good overall picture can mask inequalities within an area which need to be
  addressed
• to make more impact and guide best use of resources to improve outcomes
• to ensure that interventions do not widen existing inequalities in sexual and
  reproductive health
• it is good public health practice

This document is intended to be used by sexual health commissioners, public health teams and
sexual health service providers. It is suggested that this would be most beneficial to complete
collectively.

                                                            3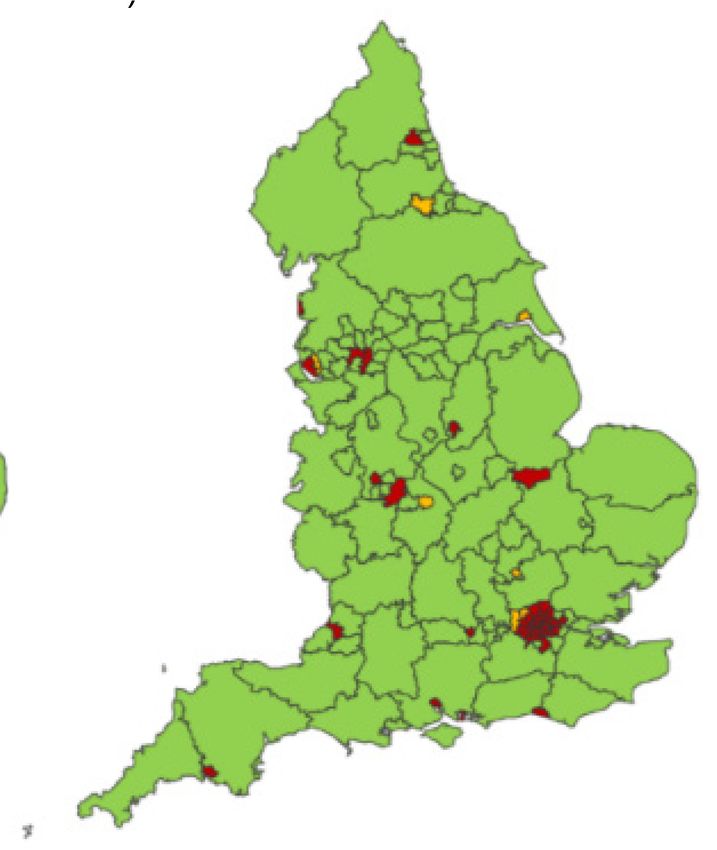
A toolkit to explore inequalities in sexual and reproductive health at a local level

2. Variation and inequalities within sexual
and reproductive health
Description of variation
Healthcare can vary in different ways: in its quality, safety, equity of access and delivery,
outcomes, the money spent, healthcare experiences and the types of service available. Not all
variation is bad. Some variation is expected, often linked to variation in need, local burden of
infection or user–preference. Variation can be an outcome of innovation, as new solutions and
models are being introduced. That type of variation, which is expected and normal, is
considered warranted. It can be described as differences in care provision that reflect factors
such as user preferences, innovations in person–centred care and clinical responsiveness.

However, some variation cannot be explained by these factors – and is 'unwarranted'. Examples
of causes of this type of variation are service under– or over– provision, failure to implement
evidence based guidelines or poor access for service users because of travelling times,
socioeconomic factors, unrecognised as well as unmet need, or poor health literacy leading to a
decrease in access or quality of provision for service users. This can have negative impacts on
the population as a whole and contribute to widening of existing inequalities.

This document considers variation at different levels:

• with–in area variation
• variation from the national average for England, and compared in context to
  Chartered Institute of Public Finance and Accountancy (CIPFA) neighbours
• variation between different population demographics, for example, by gender, age,
  ethnicity, sexual orientation, socioeconomic status

Health inequalities
Health inequalities are unfair and avoidable differences in health across the population, and
between different groups within society. Health inequalities arise because of the conditions in
which we are born, grow, live, work and age. These conditions influence our opportunities for
good health, and how we think, feel and act, and this shapes our mental health, physical health
and wellbeing.

Health inequalities have been documented between population groups across at least 4
dimensions, as illustrated below. It is important to note that these are overlapping dimensions
with people often falling into various combinations of these categories.

                                                            4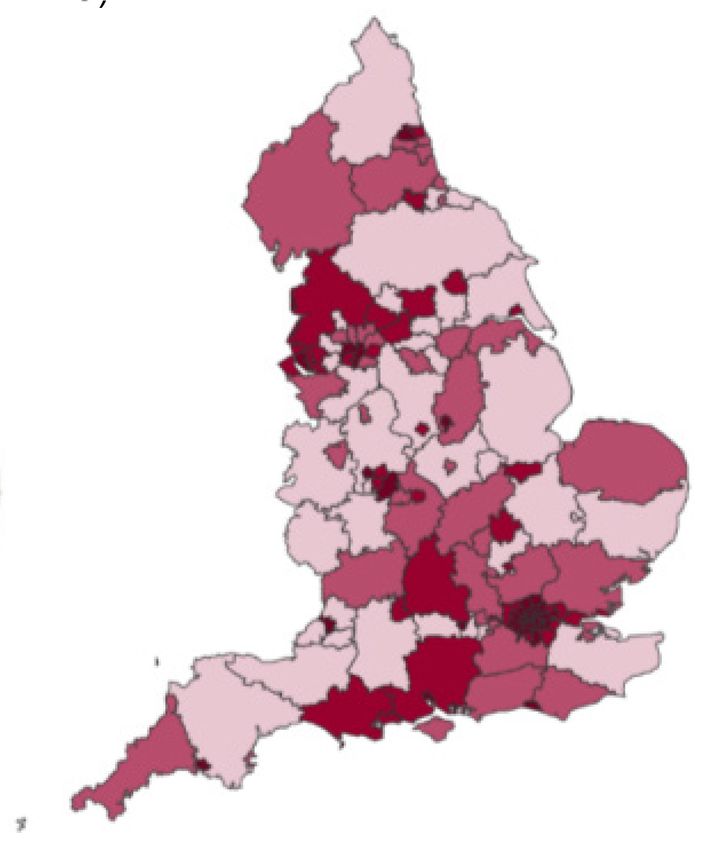
A toolkit to explore inequalities in sexual and reproductive health at a local level

The diagram below shows overlapping dimensions of health inequalities: socio–economic
deprivation, equality and diversity, inclusion health and geography.

Figure 1. Dimensions of health inequalities

       Socio-economic or                                   Equality and
       deprivation                                         diversity
       For example, low                                    For example, age,
       income, unemployed,                                 sex, race
       deprived areas

       Inclusion health
                                                           Geography
       For example, homeless
       people; Gypsy, Roma and                             For example, rural,
       Travellers; sex workers;                            urban
       vulnerable migrants

Accessible source available at Health Inequalities: Place–based approaches for reducing
inequalities. Public Health England, 2019

                                                            5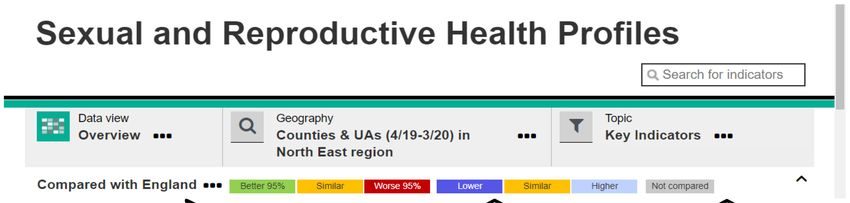
A toolkit to explore inequalities in sexual and reproductive health at a local level
Variation and inequalities in sexual and reproductive
health outcomes
At a national level, it is known that there is variation in sexual and reproductive health outcomes
across each of the dimensions of health inequalities. Inequalities in uptake of or access to
interventions can make inequalities in ill health worse. Some parts of the population will be
affected by more than one area of sexual and reproductive ill–health. Exploring the inequalities
across the topic as a whole will identify these patterns in your local area, and can highlight the
potential for interventions that can address multiple concerns. This section explains some of the
variation and inequalities that exist for STIs, HIV, teenage pregnancy and abortion.
STIs
Sexually transmitted infections (STIs) are more likely to be diagnosed in young people, gay,
bisexual and other men who have sex with men (MSM) and black and ethnic minorities.
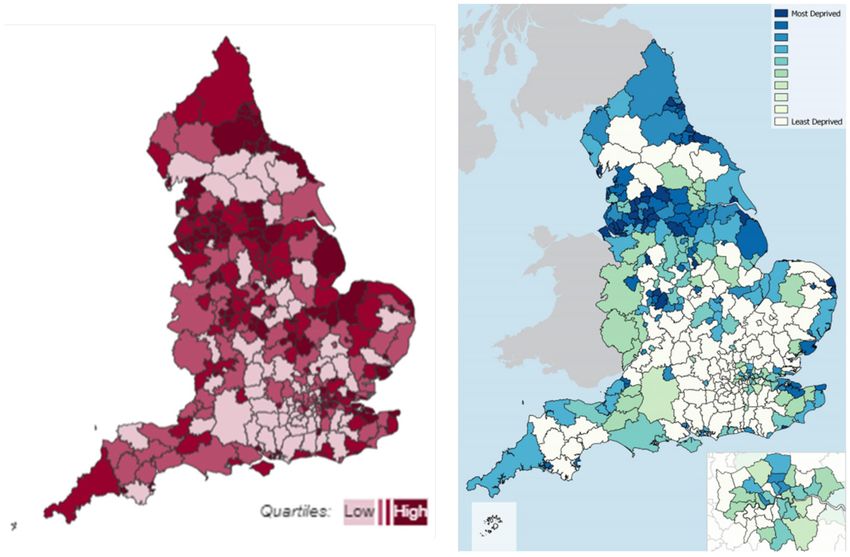
Summary statistics from the national STI surveillance 2019
The national STI surveillance 2019 showed that:
• gay, bisexual and other men who have sex with men (MSM) are more likely to be
diagnosed with bacterial STIs than other men
• the majority of syphilis and gonorrhoea diagnoses in men were in MSM, 81% of
syphilis, 66% of gonorrhoea
• HIV–diagnosed MSM are three times more likely to be diagnosed with an acute
bacterial STI than those that are HIV–negative or of unknown HIV status
• young people are more likely to be diagnosed with an STI:
o among heterosexuals attending sexual health services, most chlamydia and
gonorrhoea diagnoses were in people aged 15 to 24 years
o among heterosexuals aged 15 to 24 years, men are three and a half and
women seven times more likely to be diagnosed with an STI, than their
counterparts aged 25 to 64 years
• Black Minority Ethnic (BME) populations are disproportionately affected by STIs:
o the rate of gonorrhoea is three and a half times that of the general population
o for trichomoniasis, the rate in BME people is nine times that of the general
population
6
A toolkit to explore inequalities in sexual and reproductive health at a local level

Figure 2. Infographic of summary statistics from the national STI surveillance 2019

When considering socio–economic status, rates of new STI diagnosis are shown to be
consistently higher in more deprived populations (as measured by the Index of Multiple
Deprivation [IMD]). The bar chart below shows that rates of chlamydia, anogenital warts,
anogenital herpes, gonorrhoea and syphilis and all STIs are highest in most deprived areas and
lowest in least deprived areas as measured using Index of Multiple Deprivation quintiles.

                                                            7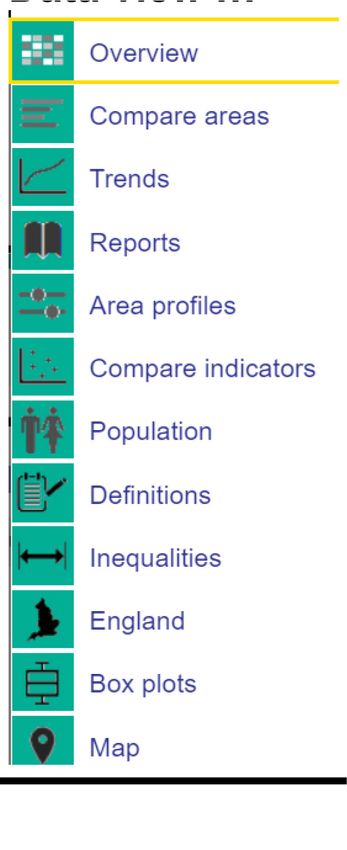
A toolkit to explore inequalities in sexual and reproductive health at a local level

Figure 3. Rates of STI diagnoses by Index of Multiple Deprivation quintile: England 2019

                                  450                                      Chlamydia                  1,200
                                                                           Anogenital Warts
                                  400                                      Anogenital Herpes
                                                                           Gonorrhoea                 1,000

                                                                                                             New STI rate per 100,000 population
                                  350                                      Syphilis
    Rate per 100,000 population

                                                                           New STIs
                                  300                                                                 800

                                  250
                                                                                                      600
                                  200

                                  150                                                                 400

                                  100
                                                                                                      200
                                  50

                                   0                                                               0
                                    1 (Most deprived)   2        3            4   5 (Least deprived)
                                                            IMD quintile

Accessible source available at PHE Sexually transmitted infections in England, 2019 slideset

HIV
HIV new diagnosis numbers are declining in the UK, largely driven by a reduction in new HIV
diagnoses among gay, bisexual and other men who have sex with men. In 2019, 41% of new
diagnoses were among gay and bisexual men; 20% among heterosexual women; 18% among
heterosexual men, and 3% among people who inject drugs. (HIV: annual data tables)

Late HIV diagnosis is defined as a CD4 count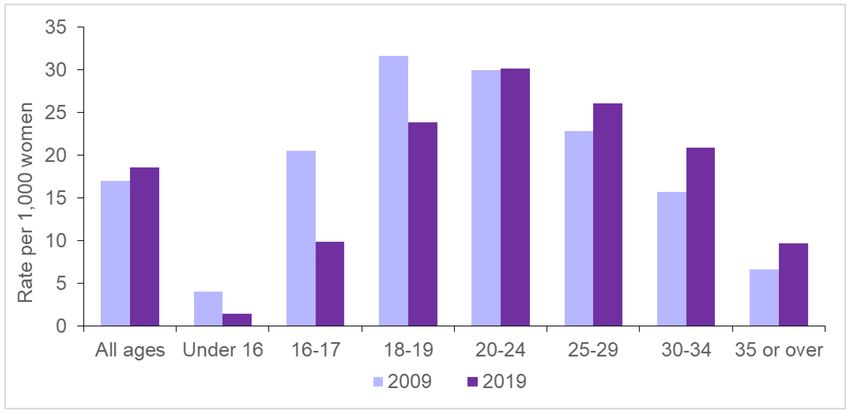
A toolkit to explore inequalities in sexual and reproductive health at a local level

Figure 4. People who present with a CD4 count ≤350: adults1 diagnosed in the UK, 2019

1 Includes people aged 15 and older
2 Other ethnic groups include: mixed and other ethnicity.

Accessible source available at HIV in the United Kingdom: 2020 slide set.

Under–18 conceptions
Teenage pregnancy is both a cause and consequence of health and education inequalities.
Teenagers have the highest rate of unplanned pregnancy with disproportionately poor
outcomes3. Recent data shows that babies born to mothers in England and Wales under 20
years had a 30% higher rate of stillbirth than average, and a 60% higher rate of infant mortality
than average 4. Rates of low birthweight in younger mothers were 30% higher than average, and
this inequality is increasing 5. Children born to teenage mothers have a 63% higher risk of living
in poverty 6. Mothers under 20 have a 30% higher risk of poor mental health 2 years after giving
birth 7. There is an eight–fold difference in the rate between local authorities and 60% of councils
have at least one ward with a rate significantly higher than England, 45% have 2 or more.
(Teenage Pregnancy Prevention Framework, PHE and LGA, 2018 (updated 2020)) 8.

3 ‘The prevalence of unplanned pregnancy and associated factors in Britain: findings from the third National Survey
of Sexual Attitudes and Lifestyles (Natsal-3)’. Lancet. Wellings K and others. Vol 382. November 2013
4 ‘Childhood mortality in England and Wales, 2016.’
5 ‘Live births, stillbirths and linked infant deaths: birthweight by age of mother, numbers and rates, 2016.’ ONS 2018.
6 ‘Child Poverty Strategy: 2014 to 2017.’ HM Government. 2014.
7 ‘Long-term consequences of teenage births for parents and their children. Teenage Pregnancy Unit research

briefing.’ Department of Health, 2014.
8 ‘Teenage Pregnancy Prevention Framework, PHE and LGA, updated 2020’.

                                                            9
A toolkit to explore inequalities in sexual and reproductive health at a local level

The graph below shows rates of teenage conception by Index of Multiple Deprivation, with highest rates of teenage conception in
the most deprived decile areas.

Figure 5. Under 18s conception rate per 1,000 by deprivation decile

Accessible source available at Sexual and reproductive health profiles

                                                                                  10
A toolkit to explore inequalities in sexual and reproductive health at a local level
Figure 6. Maps of under 18s conception rate (per 1,000) and Index of Multiple Deprivation
Child poverty and unemployment are the 2 area deprivation indicators with the strongest
influence on under–18 conception rates. At an individual level, the strongest associated risk
factors for pregnancy before 18 are free school meals eligibility, persistent school absence by
age 14, poorer than expected academic progress between ages 11 to 14, and being looked
after or a care leaver. Other associated risk factors include first sex before 16, experience of
sexual abuse or exploitation, alcohol, and experience of a previous pregnancy. Young women
with lesbian or bisexual experience are also at increased risk of unplanned pregnancy. As with
Adverse Childhood Experiences, young people who have experienced a number of these
factors will be at significantly higher risk. The maps above show a comparison of under–18
conception rates and Index of Multiple Deprivation.
Abortions
Abortion rates vary by age. Abortion rates for those aged under 18 have declined over the last
ten years in line with the successes in decreasing the rate of conceptions in this age group. The
decline is particularly marked in the under-16 age group where the rates are less than a third of
what they were in 2008. However, there is significant variation between local areas in the
proportion of under-18 conceptions that end in abortion, ranging from 32% to over 70%. There
is similar variation in the under-16s abortion proportion. This may reflect individual choice of
young women, perhaps influenced by socio-economic factors, and/or differences in the ease of
access to abortion services. Abortion rates have increased in the older age groups with the
relative rate of increase being greatest in women over 35.
11A toolkit to explore inequalities in sexual and reproductive health at a local level
Figure 7. Graph of abortion rate per 1,000 women by age in England and Wales, 2009 and
2019
Accessible source available at Abortion Statistics, England and Wales: 2019 DHSC, 2020
Abortion rates increase as levels of deprivation increase. The graph below shows that in 2019,
the rate in the most deprived decile (decile 1) was 26.1 per 1000. This is over twice the rate in
the least deprived decile (decile 10) of 12.0 per 1000. The trend of abortion rates increasing as
levels of deprivation increase remains consistent when abortion data is studied at both regional
and national level.
Figure 8. Crude abortion rate, England, by IMD decile, 2019
30
25
Rate per 1,000 women
20
15
10
5
0
1 2 3 4 5 6 7 8 9 10
Most Index of multiple deprivation decile Least
deprived deprived
12A toolkit to explore inequalities in sexual and reproductive health at a local level
Variation and scale
There is geographic variation for many aspects of sexual health. This is particularly evident for
sexually transmitted infections. The 3 maps and plots below present the same data on new STI
diagnoses rates in England. At the regional level (map A), the overall rates of STI diagnoses in
London are more than twice those of any other region in the country, which appear relatively
similar in contrast with rates below the average for England. At County and Unitary authority
level (maps B and C) there is a 12–fold difference in STI diagnoses rate between the highest
and lowest areas in the country, with areas with higher rates outside of London being visible.
The shading of map C shows the between–area variation across the country in more detail.
13A toolkit to explore inequalities in sexual and reproductive health at a local level
Figure 9. Maps of new STI diagnoses rates (exclude chlamydia in under 25s)
A) B) C)
Accessible source available at Sexual and reproductive health profiles
A good overall average can hide areas of inequality and poor sexual health. Similar differences can be seen within local authority
areas.
14A toolkit to explore inequalities in sexual and reproductive health at a local level
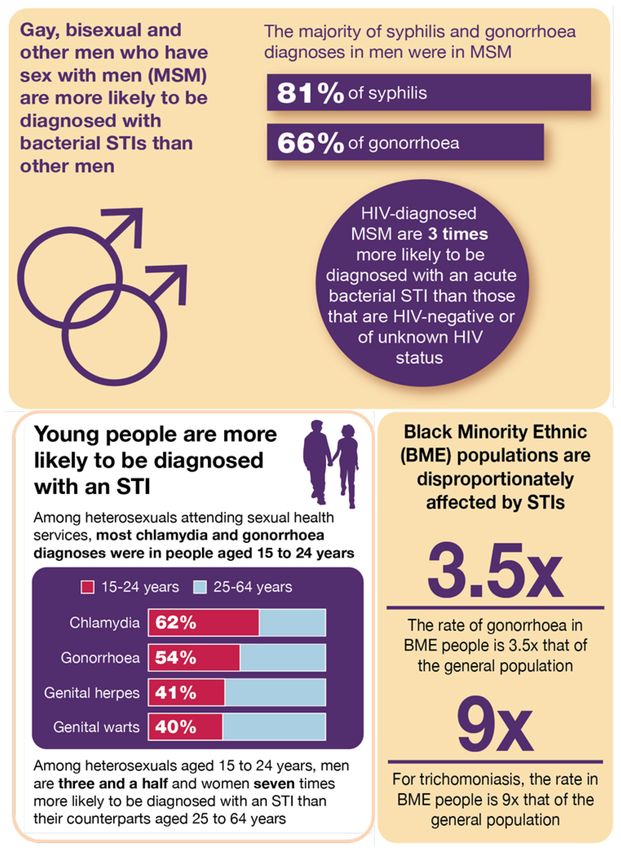
Figure 10. Within area inequality and between area variability in STI diagnosis rates
The diagram above is illustrating within area inequality and between area variability in STI
diagnosis rates.
Quartile 1 = lower within area inequality in STI rate – lower overall rate of STIs
Quartile 2 = lower within area inequality in STI rate – higher overall rate of STIs
Quartile 3 = higher within area inequality in STI rate – lower overall rate of STIs
Quartile 4 = higher within area inequality in STI rate – higher overall rate of STIs
Therefore, this suggests that for areas in quartiles 2, 3 and 4 there is further work to do either in
terms of within area inequality or overall high levels of STIs.
Health inequalities are not caused by one single issue, but a complex mix of environmental and
social factors which play out in a local area, or place – this means that local areas have a critical
role to play in reducing health inequalities. The publication ‘Place–based approaches for
reducing health inequalities’ 9 sets out main questions for local areas to consider. These
questions have been used to inform a range of questions that can be asked in relation to sexual
health.
9 ‘Health Inequalities: Place-based approaches for reducing inequalities.’ Public Health England, 2019.
15A toolkit to explore inequalities in sexual and reproductive health at a local level
Figure 11. Place–based approaches for reducing health inequalities. PHE, 2019
Accessible source available at Health Inequalities: Place-based approaches for reducing
inequalities. Public Health England, 2019.
16A toolkit to explore inequalities in sexual and reproductive health at a local level
3. Questions to ask about sexual and
reproductive health to identify inequalities
Outcomes Questions
All sexually active adults and 1.1 Is your population using services at the level you would
young people are free from expect? Are you testing the right people? (a) STI testing and
STIs (b) STI diagnosis
1.2 Chlamydia is the most common STI – what are your local
patterns?
1.3 High rates of gonorrhoea and syphilis in a population
reflect high levels of risky sexual behaviour – what does your
data tell you?
1.4 How effectively is HIV being detected and managed in
your local population?
All sexually active adults and 2.1 England has higher teenage pregnancy rates than most
young people have planned similar countries, what are your local patterns?
pregnancies if and when they
want; and have good 2.2 Is there good access to contraception?
reproductive health
2.3 Are abortions easily accessible for those that choose
them?
All young people and most 3.1 Do all young people have access to high quality
at–risk or vulnerable relationships and sex education (RSE) through education
populations are supported to settings?
have choice and control over
3.2 Is there a strategic approach to reducing the risk of
their sexual health
exploitation in young people (encompassing Child Sexual
Exploitation (CSE))?
3.3 Are sexual health services being targeted to or used by
most at risk or vulnerable groups?
3.4 Are sexual health services contributing to local work to
address sexual violence?
3.5 Is there a local approach to campaigns and
communication based on the main local issues?
Work through the flowcharts for each question using the highlighted data sources. The final
section of this document explains how to access the data.
17A toolkit to explore inequalities in sexual and reproductive health at a local level
Accessible text description of the following flowcharts are available here.
1.1a Is your population using services at the level you would expect?
18A toolkit to explore inequalities in sexual and reproductive health at a local level
1.1b Is your population using services at the level you would expect? Are you testing the
right people?
19A toolkit to explore inequalities in sexual and reproductive health at a local level
1.2 Chlamydia is the most common STI – what are your local patterns?
20A toolkit to explore inequalities in sexual and reproductive health at a local level
1.3 High rates of gonorrhoea and syphilis in a population reflect high levels of risky
sexual behaviour – what does your data tell you?
1 Syphilis: Public Health England action plan
21A toolkit to explore inequalities in sexual and reproductive health at a local level
1.4 How effectively is HIV being addressed in your local population?
Is your HIV diagnosed
prevalence rate above 2 per No to all
Use
1,000 15-59 year olds?
or SRH
profiles
Is your late diagnosis figure Continue
higher than with current
• the England average delivery
• your CIPFA neighbours average Review
• 50% annually
Yes to any
Explore
Use
Review HIV prevalence by MSOA to
identify within area variation SPLASH
Review data on those receiving
HIV-related care by Use
• ethnicity SPLASH
• probable route of infection
Review late diagnosis data for
Use
• MSM
• women SRH profiles
• men
Review HIV testing coverage data for
Use
• MSM
• women SPLASH
• men
Use
Review repeat testing in MSM data Local data from sexual
health service
Note: Point of care testing may be commissioned in your area –
this is not included in the above data. If this is the case, review
local data.
Further action: Based on the review of prevalence and HIV
testing identify if there are actions that can be taken in relation
to HIV testing within commissioned services.
Use the information from the data review to inform your
prevention strategy
Work with local partners to ensure all aspects of the NICE HIV
testing guidelines1 are being implemented in your area.
Consider late diagnosis reviews to identify missed opportunities
and inform work to improve future practice.
1 NICE HIV testing guidelines
22A toolkit to explore inequalities in sexual and reproductive health at a local level
2.1 England has higher teenage pregnancy rates than similar western European
countries, what are your local patterns?
1 Teenage pregnancy prevention framework
2 Teenage Pregnancy Prevention Self–Assessment Checklist
23A toolkit to explore inequalities in sexual and reproductive health at a local level
2.2 Is there good access to contraception?
LARC = Long Acting Reversible Contraception.
24A toolkit to explore inequalities in sexual and reproductive health at a local level
2.3 Are abortions easily accessible for those that choose them?
25A toolkit to explore inequalities in sexual and reproductive health at a local level
Outcome 3: All young people and most at-risk or vulnerable populations
are supported to have choice and control over their sexual health
Note: This section is not presented in the same way as the previous 2 because nationally
accessible data is not available. Instead, main questions to consider and potential data sources
have been suggested.
3.1 Do all young people have access to high quality Relationship and Sex Education
(RSE) through education settings?
Rationale
All young people need comprehensive RSE and easy access to services to develop healthy,
consensual relationships, prevent unplanned pregnancy and protect their sexual health.
Education settings are main in providing RSE. From September 2020 relationships education in
primary schools, RSE in secondary schools, and health education in both primary and
secondary will be statutory in all schools. This including academies, free schools, faith schools
and the independent sector. Statutory guidance was published in 2019.
Main questions
1. Is there a lead for RSE within the local authority area?
2. What support is being offered to local schools to prepare and implement statutory RSE?
3. What support is being offered to Alternative Provision settings to prepare and implement
statutory RSE?
4. The statutory guidance requires all schools to ensure pupils know about local sources of
confidential sexual and reproductive health advice. How is information about local services
being provided to schools?
Potential data sources
The Local Education Authority will hold details of all schools.
Some LEAs conduct health behaviour surveys with children and young people.
Ofsted are incorporating the new statutory requirements into their assessment
framework.
26A toolkit to explore inequalities in sexual and reproductive health at a local level
3.2 Is there a strategic approach to reducing the risk of exploitation in young people
(encompassing Child Sexual Exploitation (CSE))?
Rationale
Local authorities have a statutory safeguarding duty; and Public Health has a critical role to play
in reducing children and young people’s risk to exploitation and intervening when it does
happen. See Child sexual exploitation: prevention and intervention for further guidance.
Main questions
1. Is there a system-wide approach to exploitation, CSE and safeguarding; is the local
authority (LA) Public Health team linked in with the local structures?
2. Is local data and intelligence used to understand the local picture and inform further work?
3. Is there a holistic approach to prevention, including universal approaches such as
addressing CSE as part of RSE, as well as targeted preventative measures where there is
increased risk?
4. Is exploitation, CSE and safeguarding built into contracts for all public health commissioned
services (not just sexual and reproductive health) and LA commissioned services for
children and young people?
5. Is Spotting the Signs used within the Sexual Health service?
A CSE self-assessment tool for local authority use can be found on the national Sexual Health,
Reproductive Health and HIV Knowledge Hub (→Library →Inequalities and Inclusion →
Children and Young People).
Potential data sources
Local Safeguarding Boards may hold some data.
Some Joint Strategic Needs Assessments may include exploitation and CSE.
27A toolkit to explore inequalities in sexual and reproductive health at a local level
3.3 Are sexual health services being targeted to or used by most at risk or vulnerable
groups?
Rationale
There is a need to consider main groups from an inclusion health perspective; failure to do so
could lead to a widening of inequalities. The main groups should be identified based on local
knowledge but may include: looked after children, care leavers, substance misuse service
users, people with serious mental illness, people with learning disabilities, sex workers, victims
of sexual violence, victims of domestic abuse, migrants and refugees, people who are homeless
or in insecure housing, people in the criminal justice system or prisons.
Main questions
1. Are front-line staff from service providers that work with most at risk or vulnerable groups
aware of local sexual and reproductive health services?
2. Are front–line staff from service providers that work with most at risk or vulnerable groups
supported to take a Making Every Contact Count (MECC) approach, and are they accessing
local sexual health training?
3. Are people from most at risk or vulnerable groups accessing local sexual health services? Is
there a proactive system in place to reach the most vulnerable populations, for example,
outreach services?
4. Is access or delivery supported through partner services, for example, provision of postnatal
contraception at time of delivery through maternity services for vulnerable women?
Potential data sources
Some Joint Strategic Needs Assessments may include information most at risk or
vulnerable groups.
Local sexual health providers may collect data on service use by most at risk or
vulnerable groups.
Information about attendees of local sexual health training.
28A toolkit to explore inequalities in sexual and reproductive health at a local level
3.4 Are sexual health services contributing to local work to address sexual violence?
Rationale
Sexual violence is used to describe any kind of unwanted sexual act or activity including rape,
sexual assault, sexual abuse, sexual harassment and female genital mutilation (FGM). Sexual
violence is a serious public health and human rights problem with both short– and long–term
consequences on the physical, mental, sexual and reproductive health of victims.
Main questions
1. Does the service have a system in place for the identification of service users affected by
violence? And is there access to Domestic Violence Advisors (DVAs)?
2. Are there pathways in place for referral to and from local Sexual Assault Referral Centres
(SARCs)?
3. Have sexual health (SH) staff received adequate training around FGM and understand the
mandatory reporting requirements for those under 18?
4. Are pathways for onward referral for women that have experienced FGM in place and known
by SH staff?
5. Is sufficient FGM information available within sexual health clinics and on their websites to
support affected women?
FGM guidance from DHSC and from RCN.
Potential data sources
Violent crime: sexual offences per 1,000 population – see SRH Profile.
Sexual health services report attendances related to sexual assault to GUMCAD – see
HIV/STI portal.
FGM enhanced dataset reports (sexual health services are excluded from mandatory
reporting).
Local data may be available from Regional SARC Commissioning Boards.
29A toolkit to explore inequalities in sexual and reproductive health at a local level
3.5 Is there a local approach to campaigns and communication based on the main local
issues?
Rationale
Public health information and campaigns aim to improve knowledge and awareness; and
influence behaviour change.
Main questions
1. Is information promoting good sexual health and providing details of local sexual health
services widely available to the local population?
2. Is there a local communications or campaign strategy or plan tailored to local needs?
Potential data sources
Data on use of local sexual health service websites or social media channels.
Local survey data may be available.
30A toolkit to explore inequalities in sexual and reproductive health at a local level
4. Evaluating actions
The process set out in this document aims to help local areas review local data and identify
where further work and action is required to address inequalities. Following this process, actions
should be implemented and then evaluated to determine whether inequalities have been
reduced. A useful guide to evaluating sexual health, reproductive health and HIV services can
be found here.
To assist in evaluating whether local services or interventions have helped reduce health
inequalities, it is recommended that output and outcome measures include indicators that
specifically relate to health inequalities. A helpful framework for this is PROGRESS 10, which
provides a framework to guide data extraction, and a tool to guide equity analyses to ensure
explicit consideration of equity. The acronym that stands for:
• P Place of residence
• R Race or ethnicity, culture and language
• O Occupation
• G Gender and sex
• R Religion
• E Education
• S Socioeconomic status
• S Social capital
Another useful tool is the Health Equity Assessment Tool (HEAT). This is a framework
consisting of a series of questions and prompts, designed to support professionals across the
public health system and wider health economy systematically address health inequalities and
equity in their work programmes, services or business planning cycles.
10 ‘Applying an equity lens to interventions: using PROGRESS ensures consideration of socially stratifying factors
to illuminate inequities in health.’ Jennifer O’Neill and others, Journal of Clinical Epidemiology 67 (2014) 56-64.
31A toolkit to explore inequalities in sexual and reproductive health at a local level
5. How to use available data to explore the
questions
Information on how to use the data sources highlighted in this document is described below.
Additional information about data can be found in Sexual health, reproductive health and HIV in
England: A guide to local and national data (Revised December 2018). A wide range of
additional information can be found on the national Sexual Health, Reproductive Health and HIV
Knowledge Hub including examples of good practice from around the country.
Sexual and Reproductive Health Profiles (on PHE’s Fingertips Tool)
• Watch a video explaining how to use the Fingertips tool
• Visit the sexual and reproductive health profiles
Tip: Start by setting the Area type, Areas grouped by and Benchmark settings
Data view … Compared with … Geography … Topic …
Data can be Area type can be Groups of Indicators can be
benchmarked against displayed as selected by Topic
• England • County & UA (upper
• for the group tier) • Main Indicators
specified in ‘Areas • District & UA (lower • STI
grouped by’ tier) • HIV
• A benchmark • PHE centre • Reproductive Health
specific to the • Teenage Pregnancy
indicator (select Areas can be grouped by • Wider Determinants of
using ) • Geography Health
(regions/centres)
• ONS classification* • All indicators
• CIPFA nearest Includes all indicators in the
neighbour profiles
• Deprivation decile
*only if District & UA is
selected as the ‘Area type’
32A toolkit to explore inequalities in sexual and reproductive health at a local level
What are the main causes of sexual and reproductive ill–health in my
population?
For an overview use the sexual and reproductive health profiles and examine
the area profile for your area, starting with the main indicators. This will
identify outcomes and measures where your area is worse than or better than
the average for England using the most recent data available and will also
show the overall amount of variation for each measure.
How does my area compare against national averages, targets or with
similar areas over time?
Comparison between areas
The SRH profiles allows comparison of areas grouped in various ways or for the whole of
England:
• geographically – compare with areas nearby
• CIPFA Nearest neighbours – compare with statistically similar areas using CIPFA
method
• Office of National Statistics (ONS) classifications – compare with statistically similar
areas using ONS classification
• deprivation deciles – compare with areas within the same IMD decile (local authority
level)
Differences can be explored using the different views of the data.
In each view the Red Amber Green 11 (RAG) shading compares areas to:
• the average for England
• the average for the specified area grouping or
• to a particular benchmark or target if there is one
The RAG shading is re–calculated when the view is toggled to compare against different
averages or benchmarks.
11 Blue-orange-blue shading is sometimes used to show difference between areas when there isn’t a better or
worse direction to the data.
33A toolkit to explore inequalities in sexual and reproductive health at a local level
Views to compare localities with each other and against an average or
benchmark
The compare areas view presents the latest data for each indicator and
presents these for all the localities within the group specified in ‘areas
grouped by’. The view can be switched to show all areas within England
Tip: Sorting the display by value arranges the data in order and gives a clear
comparison between different areas and against the average value for England and
the average value for the group specified in ‘areas grouped by’.
Consider
Explore the indicators identified as of interest in the area profiles:
1. Is the indicator in your area significantly different (better or worse) to the average for
England, or against the indicator benchmark if there is one?
2. How does it compare to other localities in the same deprivation decile? In the same CIPFA
nearest neighbours grouping?
The map view can be switched to display values for the whole of England or
selectively show those areas within the group specified in ‘areas grouped by’.
Changing the benchmark between England and the group average will zoom
the map out and in respectively.
Consider
1. Is the indicator in your area significantly different (better or worse) to the average for
England, or the average for all areas within the specified group?
2. Is the local trend following the same pattern as the average trend?
3. Is the trend improving or worsening – if so, can this be explained by other measures on the
profiles. For example:
o Does an increase in STI diagnosis rate align with an increased testing rate, an
increased test positivity or both? (and vice versa)?
o Does an increase in chlamydia detection align with an increase in the proportion
of 15 to 24 year olds screened?
o Is a change in the trend for all STIs largely explained by the change in a
particular STI?
34A toolkit to explore inequalities in sexual and reproductive health at a local level
Is there evidence of inequalities within my area, geographically or for
any particular subgroups?
Use the Summary profile of local authority sexual health (SPLASH) reports on the sexual and
reproductive health profiles to look at your local area compared with other areas (Upper Tier:
County and UA level) and within area variation. And breakdowns published on the HIV/STI data
exchange 12 to examine in more detail within–area data.
Report SPLASH
Full name Summary profiles of local authority sexual health
Data source is the SRH profiles
Format Selected main indicators presented as Graphs, tables and
maps showing:
• trends over time
• comparisons with other areas and benchmark
• Within area breakdowns – maps
narrative text featuring statistics specific to the local authority
Geography Upper Tier Local Authority
(County and UA) ~150
Location Published on the SRH profiles
Using and interpreting maps to explore within area variation
The SPLASH report shows within area variation of: new STI diagnoses (excluding chlamydia in
under 25s) chlamydia detection rate in under 25s and HIV diagnosed prevalence by MSOA 13
and teenage conception rate by electoral ward 14 within each Local Authority area.
Tips: Look carefully at the map title – the rates shown in the maps use different
denominators, by age and sex depending on what is being shown in the map. For example,
STI maps show the rate for the population aged 16 to 54, while teenage conception maps
show the rate for females aged 15 to 17 in the area.
Think about the areas with higher rates – do they have higher incidence of infections or
teenage pregnancy, or do they have a small population. For example, the central business
district of a town or city, an industrial estate or a very rural area.
12 Previously known as the HIV and STI web portal
13 Middle Super Output Areas – defined by the ONS. There are approximately 7,000 of these, with a population
range of 5,000 to 15,000 (2,000 to 6,000 households)
14 Electoral wards – may use ward boundaries at a fixed date (statistical wards). Approximately 8,800 of these, with
a population range of 100 to 30,000. Average 5,500
35A toolkit to explore inequalities in sexual and reproductive health at a local level
Examining data by deprivation status – national level
The inequalities view shows the general picture of inequalities for any
measure or indicator.
Tip: selecting a view of the data by ‘District and UA’ rather than ‘County and UA’ gives a more
precise measure.
Latest Values: shows the most recent data for any measure by deprivation decile.
Consider
1. Is there a linear relationship between the indicator and deprivation?
2. How strong is that relationship?
3. Is there a big range between the most and lease deprived decile?
Trends: shows the trend for a measure over time, split by deprivation deciles.
Consider
1. Does the pattern of inequality persist over time?
2. Are things getting better or worse in general?
3. Is the inequality widening or narrowing?
Indices of Deprivation 2019 local authority maps and data
These local authority maps have been produced by the Ministry of Housing, Communities and
Local Government in collaboration with the University of Sheffield. There is one map for each of
England’s 317 local authority areas. Each map uses the index of multiple deprivation 2019 to
illustrate deprivation at lower-layer super output area level within each area. Each map also
displays the number of lower-layer super output areas each area has in each decile of
deprivation.
• English indices of deprivation 2019: mapping resources
• English indices of deprivation 2019
36Website: www.gov.uk/phe
Twitter: @PHE_uk
Facebook: www.facebook.com/PublicHealthEngland
© Crown copyright 2021
Prepared by: Katy Sinka and Georgina Wilkinson
Published: May 2021
PHE gateway number: GOV-7925
37You can also read