VIETNAM CLIMATE RISK COUNTRY PROFILE - Asian Development ...
←
→
Page content transcription
If your browser does not render page correctly, please read the page content below
CLIMATE RISK COUNTRY PROFILE

         VIETNAM
COPYRIGHT
© 2020 by the World Bank Group
1818 H Street NW, Washington, DC 20433
Telephone: 202-473-1000; Internet: www.worldbank.org

© Asian Development Bank
6 ADB Avenue, Mandaluyong City, 1550 Metro Manila, Philippines
Tel +63 2 8632 4444; Fax +63 2 8636 2444
www.adb.org

This work is a product of the staff of the World Bank Group (WBG) and the Asian Development Bank (ADB) and with external
contributions. The opinions, findings, interpretations, and conclusions expressed in this work are those of the authors’ and do not
necessarily reflect the views or the official policy or position of the WBG, its Board of Executive Directors, or the governments
it represents or of ADB, its Board of Governors, or the governments they represent.

The WBG and ADB do not guarantee the accuracy of the data included in this work and do not make any warranty, express or
implied, nor assume any liability or responsibility for any consequence of their use. This publication follows the WBG’s practice
in references to member designations, borders, and maps. ADB, however, recognizes “China” as the People’s Republic of China,
“Vietnam” as Viet Nam, and “Hanoi” as Ha Noi. The boundaries, colors, denominations, and other information shown on any
map in this work, or the use of the term “country” do not imply any judgment on the part of the WBG or ADB, their respective
Boards, or the governments they represent, concerning the legal status of any territory or geographic area or the endorsement
or acceptance of such boundaries.

The mention of any specific companies or products of manufacturers does not imply that they are endorsed or recommended
by either the WBG or ADB in preference to others of a similar nature that are not mentioned.

RIGHTS AND PERMISSIONS
The material in this work is subject to copyright. Because the WB and ADB encourage dissemination of their knowledge,
this work may be reproduced, in whole or in part, for noncommercial purposes as long as full attribution to this work is given. This
work is licensed under the Creative Commons Attribution-NonCommercial 3.0 IGO License. To view a copy of this license,
visit http://creativecommons.org/licenses/by-nc/3.0/igo/ or send a letter to Creative Commons, PO Box 1866, Mountain
View, CA 94042, USA.

This CC license does not apply to WBG or non-ADB copyright materials in this publication. If the material is attributed to another
source, please contact the copyright owner or publisher of that source for permission to reproduce it. WBG or ADB cannot be
held liable for any claims that arise as a result of your use of the material.

Please cite the work as follows: Climate Risk Country Profile: Vietnam (2020): The World Bank Group and the Asian
Development Bank.

Any queries on rights and licenses, including subsidiary rights, should be addressed to World Bank Publications, The World Bank
Group, 1818 H Street NW, Washington, DC 20433, USA; fax: 202-522-2625; e-mail: pubrights@worldbank.org.

Cover Photos: © Shawn Harquail/World Bank, “Cát Bà Pier” September 12, 20175 via Flickr, Creative Commons CC BY-NC-ND 2.0.
© Y Nakanishi/World Bank, “Terraced Rice Fields in Sapa, Vietnam” May 11, 2014 via Flickr, Creative Commons CC BY-NC-ND 2.0.

Graphic Design: Circle Graphics, Reisterstown, MD.

CLIMATE RISK COUNTRY PROFILE: VIETNAM                                                                                             ii
ACKNOWLEDGEMENTS
This profile is part of a series of Climate Risk Country Profiles that are jointly developed by the World Bank Group (WBG) and the
Asian Development Bank (ADB). These profiles synthesize the most relevant data and information on climate change, disaster
risk reduction, and adaptation actions and policies at the country level. The profile is designed as a quick reference source for
development practitioners to better integrate climate resilience in development planning and policy making. This effort is co-led
by Ana E. Bucher (Senior Climate Change Specialist, WBG) and Arghya Sinha Roy (Senior Climate Change Specialist, ADB).

This profile was written by Alex Chapman (Consultant, ADB) and Yunziyi Lang (Climate Change Analyst, WBG). Technical review
of the profiles was undertaken by Robert L. Wilby (Loughborough University). Additional support was provided by MacKenzie
Dove (Senior Climate Change Consultant, WBG), Adele Casorla-Castillo (Consultant, ADB), and Charles Rodgers (Consultant,
ADB). This profile also benefitted from inputs of WBG and ADB regional staffs.

Climate and climate-related information is largely drawn from the Climate Change Knowledge Portal (CCKP), a WBG online
platform with available global climate data and analysis based on the latest Intergovernmental Panel on Climate Change (IPCC)
reports and datasets. The team is grateful for all comments and suggestions received from the sector, regional, and country
development specialists, as well as climate research scientists and institutions for their advice and guidance on use of climate-
related datasets.

CLIMATE RISK COUNTRY PROFILE: VIETNAM                                                                                          iii
CONTENTS

FOREWORD  .  .  .  .  .  .  .  .  .  .  .  .  .  .  .  .  .  .  .  .  .  .  .  .  .  .  .  .  .  .  .  .  .  .  .  . 1

KEY MESSAGES .   .   .   .   .   .   .   .   .   .   .   .   .   .   .   .   .   .   .   .   .   .   .   .   .   .   .   .   .   .   .   .   .   .  2

COUNTRY OVERVIEW .   .   .   .   .   .   .   .   .   .   .   .   .   .   .   .   .   .   .   .   .   .   .   .   .   .   .   .   .   .   .  2

CLIMATOLOGY  .   .   .   .   .   .   .   .   .   .   .   .   .   .   .   .   .   .   .   .   .   .   .   .   .   .   .   .   .   .   .   .   .   .   4
   Climate Baseline .  .  .  .  .  .  .  .  .  .  .  .  .  .  .  .  .  .  .  .  .  .  .  .  .  .  .  .  .  .  .  .  .  .  .  .  .  .  .  .           4
      Overview  .  .  .  .  .  .  .  .  .  .  .  .  .  .  .  .  .  .  .  .  .  .  .  .  .  .  .  .  .  .  .  .  .  .  .  .  .  .  .  .  .  .         4
      Key Trends .  .  .  .  .  .  .  .  .  .  .  .  .  .  .  .  .  .  .  .  .  .  .  .  .  .  .  .  .  .  .  .  .  .  .  .  .  .  .  .  .           5
   Climate Future .  .  .  .  .  .  .  .  .  .  .  .  .  .  .  .  .  .  .  .  .  .  .  .  .  .  .  .  .  .  .  .  .  .  .  .  .  .  .  .  .          6
      Overview  .  .  .  .  .  .  .  .  .  .  .  .  .  .  .  .  .  .  .  .  .  .  .  .  .  .  .  .  .  .  .  .  .  .  .  .  .  .  .  .  .  .         6
      Key Trends .  .  .  .  .  .  .  .  .  .  .  .  .  .  .  .  .  .  .  .  .  .  .  .  .  .  .  .  .  .  .  .  .  .  .  .  .  .  .  .  .           7

CLIMATE-RELATED NATURAL HAZARDS .   .   .   .   .   .   .   .   .   .   .   .   .   .   .   .   .   .   .   .   .   . 10
       Heat Waves .  .  .  .  .  .  .  .  .  .  .  .  .  .  .  .  .  .  .  .  .  .  .  .  .  .  .  .  .  .  .  .  .  .  .  .  .  .  .  .  . 11
       Drought  .  .  .  .  .  .  .  .  .  .  .  .  .  .  .  .  .  .  .  .  .  .  .  .  .  .  .  .  .  .  .  .  .  .  .  .  .  .  .  .  .  . 11
       Flood .  .  .  .  .  .  .  .  .  .  .  .  .  .  .  .  .  .  .  .  .  .  .  .  .  .  .  .  .  .  .  .  .  .  .  .  .  .  .  .  .  .  .  . 12

CLIMATE CHANGE IMPACTS .   .   .   .   .   .   .   .   .   .   .   .   .   .   .   .   .   .   .   .   .   .   .   .   .   .   .   . 15
   Climate Change Impacts on Natural Resources  .  .  .  .  .  .  .  .  .  .  .  .  .  .  .  .  .  .  .  .  .  .  .  .  .  . 15
      Water .  .  .  .  .  .  .  .  .  .  .  .  .  .  .  .  .  .  .  .  .  .  .  .  .  .  .  .  .  .  .  .  .  .  .  .  .  .  .  .  .  .  . 15
      The Coastal Zone  .  .  .  .  .  .  .  .  .  .  .  .  .  .  .  .  .  .  .  .  .  .  .  .  .  .  .  .  .  .  .  .  .  .  .  .  .  . 16
   Climate Change Impacts on Economic Sectors  .  .  .  .  .  .  .  .  .  .  .  .  .  .  .  .  .  .  .  .  .  .  .  .  .  . 18
      Agriculture .  .  .  .  .  .  .  .  .  .  .  .  .  .  .  .  .  .  .  .  .  .  .  .  .  .  .  .  .  .  .  .  .  .  .  .  .  .  .  .  . 18
      Urban and Energy  .  .  .  .  .  .  .  .  .  .  .  .  .  .  .  .  .  .  .  .  .  .  .  .  .  .  .  .  .  .  .  .  .  .  .  .  . 20
   Climate Change Impacts on Communities .  .  .  .  .  .  .  .  .  .  .  .  .  .  .  .  .  .  .  .  .  .  .  .  .  .  .  . 21
      Vulnerability to Climate-Related Disaster  .  .  .  .  .  .  .  .  .  .  .  .  .  .  .  .  .  .  .  .  .  .  .  .  .  .  . 21
      Human Health .  .  .  .  .  .  .  .  .  .  .  .  .  .  .  .  .  .  .  .  .  .  .  .  .  .  .  .  .  .  .  .  .  .  .  .  .  .  . 22
      Poverty and Inequality .  .  .  .  .  .  .  .  .  .  .  .  .  .  .  .  .  .  .  .  .  .  .  .  .  .  .  .  .  .  .  .  .  .  . 24

POLICIES AND PROGRAMMES .   .   .   .   .   .   .   .   .   .   .   .   .   .   .   .   .   .   .   .   .   .   .   .   .   .   . 25
   National Adaptation Policies and Plans .  .  .  .  .  .  .  .  .  .  .  .  .  .  .  .  .  .  .  .  .  .  .  .  .  .  .  .  .                      25
   Climate Change Priorities of ADB and the WBG  .  .  .  .  .  .  .  .  .  .  .  .  .  .  .  .  .  .  .  .  .  .  .  .  .                           25

CLIMATE RISK COUNTRY PROFILE: VIETNAM                                                                                                                iv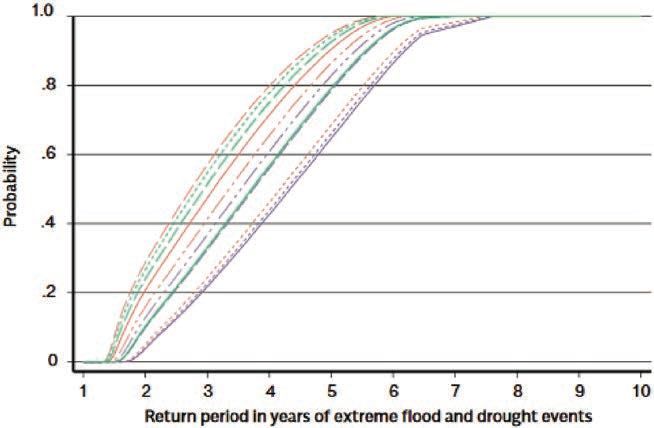
FOREWORD

Climate change is a major risk to good development outcomes, and the World Bank Group is committed to playing an important
role in helping countries integrate climate action into their core development agendas. The World Bank Group (WBG) and the
Asian Development Bank (ADB) are committed to supporting client countries to invest in and build a low-carbon, climate-
resilient future, helping them to be better prepared to adapt to current and future climate impacts.

Both institutions are investing in incorporating and systematically managing climate risks in development operations through
their individual corporate commitments.

For the World Bank Group: a key aspect of the World Bank Group’s Action Plan on Adaptation and Resilience (2019) is to help
countries shift from addressing adaptation as an incremental cost and isolated investment to systematically incorporating climate
risks and opportunities at every phase of policy planning, investment design, implementation, and evaluation of development
outcomes. For all International Development Association and International Bank for Reconstruction and Development operations,
climate and disaster risk screening is one of the mandatory corporate climate commitments. This is supported by the World
Bank Group’s Climate and Disaster Risk Screening Tool which enables all Bank staff to assess short- and long-term climate
and disaster risks in operations and national or sectoral planning processes. This screening tool draws up-to-date and relevant
information from the World Bank’s Climate Change Knowledge Portal, a comprehensive online ‘one stop shop’ for global,
regional, and country data related to climate change and development.

For the Asian Development Bank: its Strategy 2030 identified “tackling climate change, building climate and disaster resilience,
and enhancing environmental sustainability” as one of its seven operational priorities. Its Climate Change Operational
Framework 2017–2030 identified mainstreaming climate considerations into corporate strategies and policies, sector and
thematic operational plans, country programming, and project design, implementation, monitoring, and evaluation of climate
change considerations as the foremost institutional measure to deliver its commitments under Strategy 2030. ADB’s climate
risk management framework requires all projects to undergo climate risk screening at the concept stage and full climate risk
and adaptation assessments for projects with medium to high risk.

Recognizing the value of consistent, easy-to-use technical resources for our common client countries as well as to support
respective internal climate risk assessment and adaptation planning processes, the World Bank Group’s Climate Change
Group and ADB’s Sustainable Development and Climate Change Department have worked together to develop this content.
Standardizing and pooling expertise facilitates each institution in conducting initial assessments of climate risks and opportunities
across sectors within a country, within institutional portfolios across regions, and acts as a global resource for development
practitioners.

For common client countries, these profiles are intended to serve as public goods to facilitate upstream country diagnostics,
policy dialogue, and strategic planning by providing comprehensive overviews of trends and projected changes in key climate
parameters, sector-specific implications, relevant policies and programs, adaptation priorities and opportunities for further actions.

We hope that this combined effort from our institutions will spur deepening of long-term risk management in our client countries
and support further cooperation at the operational level.

Bernice Van Bronkhorst                                              Preety Bhandari
Global Director                                                     Chief of Climate Change and Disaster Risk Management
Climate Change Group                                                Thematic Group concurrently Director Climate Change and
The World Bank Group                                                Sustainable Development and Climate Change Department
                                                                    Asian Development Bank
CLIMATE RISK COUNTRY PROFILE: VIETNAM                                                                                               1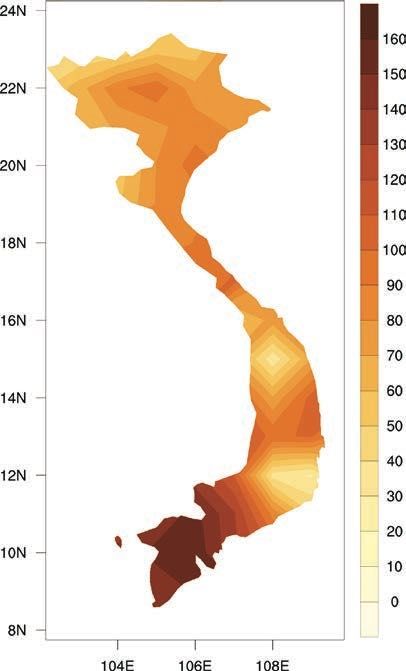
KEY MESSAGES

•     Projected temperature increases in Vietnam are similar to the global average, ranging between 1.0°C and
      3.4°C by 2080–2099 when compared with the 1986–2005 baseline. The range in possible temperature rises
      highlights the significant differences between 21st century emissions pathways.
•     Rises in annual maximum and minimum temperatures are expected to be stronger than the rise in average
      temperature, likely amplifying the impacts on human health, livelihoods, and ecosystems.
•     There is considerable uncertainty around future precipitation trends and the intensity of extreme events, in particular
      due to the current generation of climate models’ poor performance simulating the El Niño Southern Oscillation
      (ENSO).
•     Vietnam’s low-lying coastal and river delta regions have very high vulnerability to rising sea-levels. Depending
      on the emissions pathway 6–12 million people will potentially be affected by coastal flooding by 2070–2100
      without effective adaptation action.
•     Climate change is likely to increase the population affected by fluvial flooding, projected to be in the range of
      3–9 million people by 2035–2044 depending on the emissions pathway.
•     Losses of agricultural productivity are projected for key food and cash crops, multiple drivers have been
      proposed, including saline intrusion and shifts in the viable geographical range of plant species.
•     As temperatures rise the increase in heat stress on the Vietnamese population will lead to negative health
      outcomes, particularly for poorer communities and outdoor laborers.
•     Vietnam faces potentially significant social and economic impacts across multiple regions and sectors. Without
      effective adaptation and disaster risk reduction efforts multidimensional poverty and inequality are likely to increase.

COUNTRY OVERVIEW

V
         ietnam is a Southeast Asian nation with an extensive coastline and diverse but generally warm climate
         including temperate and tropical regions. In 2019 Vietnam’s population was estimated at 96.4 million,
         approximately one third of whom live in the metropolitan areas of its two mega-cities, Hanoi and Ho Chi
Minh City. The relative contribution of agriculture, forestry, and fishing to the country’s economy has declined
in recent years due to the rapid growth of the industry and service sectors; as of 2017 the agricultural sector
contributed 15.3% of gross domestic product, this is somewhat mismatched against an employment contribution of
around 40.3% of the country’s labor force (see key country indicators in Table 1). Rice production has a particularly
vital role for the country in terms of food security, rural employment and foreign exchange, employing two-thirds
of the rural labor force and positioning Vietnam as consistently one of the world’s largest rice exporters. Vietnam’s
long coastline, geographic location, and diverse topography and climates contribute to its being one of the most
hazard-prone countries of Asia and the Pacific Region. Given that a high proportion of the country’s population and
economic assets (including irrigated agriculture) are located in coastal lowlands and deltas and rural areas face
issues of poverty and deprivation, Vietnam has been ranked among the five countries likely to be most affected by
climate change. It has been estimated that climate change will reduce national income by up to 3.5% by 2050.1

1
    Arndt, C., Tarp, F., & Thurlow, J. (2015). The economic costs of climate change: A multi-sector impact assessment for Vietnam.
    Sustainability: 7: 4131–4145.

CLIMATE RISK COUNTRY PROFILE: VIETNAM                                                                                                2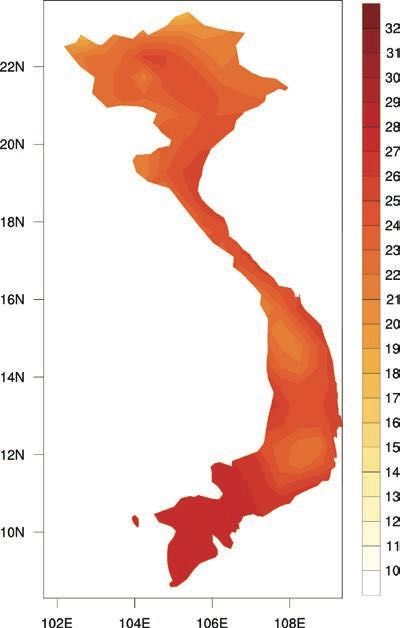
Vietnam demonstrates dedication to combating climate change through a range of national policies and concrete
adaptation measures. In 2011, the National Climate Change Strategy was issued, outlining the objectives for
2016–2050. In 2012, the National Green Growth Strategy was approved, which includes mitigation targets
and measures. In 2013, the Law on Natural Disaster Prevention and Control was enacted, aiming to address
diverse natural hazards that affect the country, which are primarily climate related. Additionally, the 2014 Law on
Environment includes a full chapter on climate change. Vietnam ratified the Paris Agreement on November 3, 2016
and the associated Nationally Determined Contribution.

This document aims to succinctly summarize the climate risks faced by Vietnam. This includes rapid onset and
long-term changes in key climate parameters, as well as impacts of these changes on communities, livelihoods and
economies, many of which are already underway. This is a high-level synthesis of existing research and analyses,
focusing on the geographic domain of Vietnam, therefore potentially excluding some international influences
and localized impacts. The core data presented is sourced from the database sitting behind the World Bank
Group’s Climate Change Knowledge Portal (CCKP), incorporating climate projections from the Coupled Model
Inter-comparison Project Phase 5 (CMIP5). This document is primarily meant for WBG and ADB staff to inform
their climate actions and to direct them to many useful sources of secondary data and research.

TABLE 1.  Key indicators

Indicator                                                          Value                                      Source
Population Undernourished                                          10.7% (2014–2016)                          FAO, 2017
National Poverty Rate                                              7.0% (2015)                                ADB, 2018
Share of Wealth Held by Bottom 20%                                 7.1% (2014)                                WB, 2018
Net Migration Rate                                                 –0.04% (2010–2015)                         UNDESA, 2017
Infant Mortality Rate (Between Age 0 and 1)                        1.9% (2010–2015)                           UNDESA, 2017
Average Annual Change in Urban Population                          2.1% (2010–2015)                           UNDESA, 2018
Dependents per 100 Independent Adults                              59.5 (2015)                                UNDESA, 2017
Urban Population as % of Total Population                          35.9% (2018)                               CIA, 2018
External Debt Ratio to GNI                                         42.5% (2015)                               ADB, 2017a
Government Expenditure Ratio to GDP                                28.7% (2016)                               ADB, 2017a

Notre-Dame GAIN Index Ranking (2018)
         The ND-GAIN Index ranks 181 countries using a score which calculates a country’s vulnerability to climate
         change and other global challenges as well as their readiness to improve resilience. The more vulnerable a
 98th
         country is the lower their score, while the readier a country is to improve its resilience the higher it will be. Norway
         has the highest score and is ranked 1st (University of Notre-Dame, 2019).

CLIMATE RISK COUNTRY PROFILE: VIETNAM                                                                                               3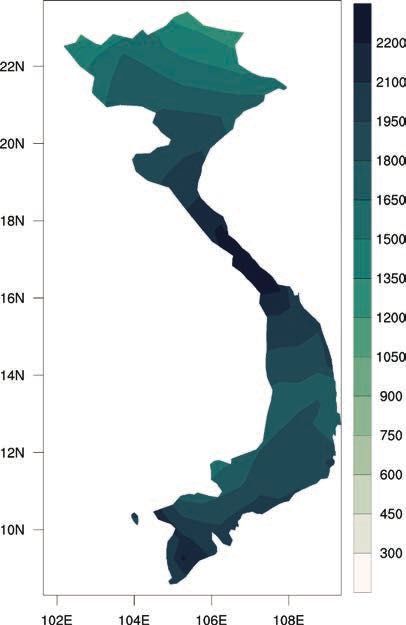
CLIMATOLOGY

Climate Baseline
Overview
Vietnam has both a tropical climate zone and a temperate climate zone, with all of the country experiencing the
effects of the annual monsoon (see the country’s annual climate cycle in Figure 1). Rainy seasons correspond
to monsoon circulations, which bring heavy rainfall in the north and south from May to October, and in the central
regions from September to January. In the northern regions, average temperatures range from 22°C–27.5°C
in summer to 15°C–20°C in winter, while the southern areas have a narrower range of 28°C–29°C in summer
to 26°C–27°C in winter (see regional changes in Figures 2 and 3). Vietnam’s climate is also impacted by the
El Niño Southern Oscillation (ENSO), which influences monsoonal circulation, and drives complex shifts in rainfall
and temperature patterns which vary spatially at a sub-national level. El Niño has also been shown to influence
sea-level,2 drought incidence3 and even disease incidence.4

Annual Cycle

FIGURE 1.  Average monthly temperature and rainfall in Vietnam (1901–2016)5
               30ºC                                                                                                    320 mm

               25ºC                                                                                                    240 mm
Temperature

                                                                                                                                  Rainfall
               20ºC                                                                                                    160 mm

               15ºC                                                                                                    80 mm

               10ºC                                                                                                    0 mm
                        Jan     Feb     Mar     Apr     May    Jun      Jul     Aug    Sep     Oct     Nov     Dec

                                                        Rainfall              Temperature

2
              Muis, S., Haigh, I. D., Guimarães Nobre, G., Aerts, J. C. J. H., & Ward, P. J. (n.d.). Influence of El Niño-Southern Oscillation on Global
              Coastal Flooding. Earth’s Future, 6(9), 1311–1322.
3
              Sano, M., Buckley, B.M. and Sweda, T. (2009). Tree-ring based hydroclimate reconstruction over northern Vietnam from Fokienia
              hodginsii: eighteenth century mega-drought and tropical Pacific influence. Climate Dynamics, 33, 331–340.
4
              Thai, K.T., Cazelles, B., Van Nguyen, N., Vo, L.T., Boni, M.F., Farrar, J., Simmons, C.P., van Doorn, H.R. and de Vries, P.J. (2010). Dengue dynamics
              in Binh Thuan province, southern Vietnam: periodicity, synchronicity and climate variability. PLoS Neglected Tropical Diseases, 4, pp. 747.
5
              WBG Climate Change Knowledge Portal (CCKP, 2019). Climate Data: Historical. URL: https://climateknowledgeportal.worldbank.org/
              country/vietnam/climate-data-historical

CLIMATE RISK COUNTRY PROFILE: VIETNAM                                                                                                                             4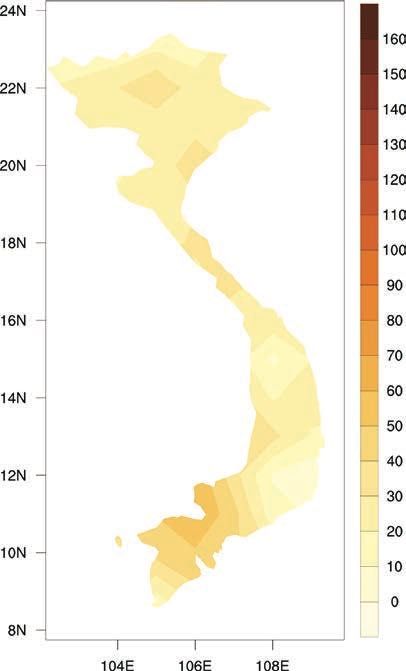
Spatial Variations

FIGURE 2.  Annual mean temperature (°C)                                FIGURE 3.  Annual mean rainfall (mm) in
in Vietnam over the period 1901–20196                                  Vietnam over the period 1901–2019

Key Trends
Temperature
Mean annual temperature has increased by 0.5°C–0.7°C since 1960, with the rate of increase most rapid in
southern Vietnam and the Central Highlands. In the period 1971–2010 the rate of warming is estimated at 0.26°C
per decade, this is reported as being almost twice the rate of global warming over the same period.7 Greater
warming has been identified in winter months than in summer months. The frequency of ‘hot’ days and nights
has increased significantly since 1960 in every season, and the annual frequency of ‘cold’ days and nights has
decreased significantly.

6
    WBG Climate Change Knowledge Portal (CCKP, 2019). Climate Data: Historical. URL: https://climateknowledgeportal.worldbank.
    org/country/vietnam/climate-data-historical
7
    Nguyen, D. Q., Renwick, J., & Mcgregor, J. (2014). Variations of surface temperature and rainfall in Vietnam from 1971 to 2010.
    International Journal of Climatology: 34: 249–264.

CLIMATE RISK COUNTRY PROFILE: VIETNAM                                                                                                 5
Precipitation
Mean rainfall over Vietnam does not show any significant increase or decrease on a national level since 1960.
The proportion of rainfall falling in heavy events has not changed significantly since 1960, nor has the maximum
amount falling in 1-day or 5-day events. However, on a sub-national level some changes are significant, the general
trend has been towards increased rainfall in central regions, and reduced rainfall in northern and southern regions.8
El Niño remains a major influencer of trends in precipitation.9
Climate Future
Overview
The Representative Concentration Pathways (RCPs) represent four plausible futures, based on the rate of
emissions reduction achieved at the global level. For more background please refer to the World Bank’s Climate
Change Knowledge Portal (CCKP) metadata. For reference, Tables 2 and 3 provide information on all four RCPs
over two time periods. In subsequent analysis RCP 2.6
and 8.5, the extremes of low and high emissions pathways,
A Precautionary Approach
are the primary focus. RCP2.6 would require rapid and
systemic global action, achieving emissions reduction
Studies published since the last iteration of
throughout the 21st century sufficient to reach net zero
the IPCC’s report (AR5), such as Gasser et
global emissions by around 2080. RCP8.5 assumes
al. (2018), have presented evidence which
annual global emissions will continue to increase
suggests a greater probability that earth will
throughout the 21st century. Climate changes under each
experience medium and high-end warming
emissions pathway are presented against a reference
scenarios than previously estimated. Climate
period of 1986–2005 for all indicators.
change projections associated with the
highest emissions pathway (RCP8.5) are
Climate projections presented in this document are
presented here to facilitate decision making
derived from datasets made available on the World
which is robust to these risks.
Bank’s Climate Change Knowledge Portal (CCKP),
unless otherwise stated. These datasets are processed
outputs of simulations performed by multiple General
Circulation Models (GCM) developed by climate research centers around the world and evaluated by the IPCC
for quality assurance in the CMIP5 iteration of models (for further information see Flato et al., 2013).10 Collectively,
these different GCM simulations are referred to as the ‘model ensemble’. Due to the differences in the way GCMs
represent the key physical processes and interactions within the climate system, projections of future climate
8
Katzfey, J., McGregor, J., Suppiah, R. (2014). High-resolution climate projections for Vietnam: Technical Report. CSIRO, Australia.
9
Nguyen, D. Q., Renwick, J., & Mcgregor, J. (2014). Variations of surface temperature and rainfall in Vietnam from 1971 to 2010.
International Journal of Climatology: 34: 249–264.
10
Flato, G., Marotzke, J., Abiodun, B., Braconnot, P., Chou, S. C., Collins, W., . . . Rummukainen, M. (2013). Evaluation of Climate
Models. Climate Change 2013: The Physical Science Basis. Contribution of Working Group I to the Fifth Assessment Report of the
Intergovernmental Panel on Climate Change, 741–866.
CLIMATE RISK COUNTRY PROFILE: VIETNAM 6TABLE 2. Projected anomaly (changes °C) for maximum, minimum, and average daily temperatures
in Vietnam for 2040–2059 and 2080–2099, from the reference period of 1986–2005 for all
RCPs. The table shows the median of the CCKP model ensemble and the 10th–90th percentiles
in brackets.11
Average Daily Maximum Average Daily Minimum
Temperature Average Daily Temperature Temperature
Scenario 2040–2059 2080–2099 2040–2059 2080–2099 2040–2059 2080–2099
RCP2.6 1.1 1.2 1.1 1.1 1.1 1.1
(–0.4, 2.7) (–0.1, 2.8) (–0.1, 2.3) (–0.1, 2.4) (–0.1, 2.1) (–0.1, 2.2)
RCP4.5 1.3 1.9 1.4 1.9 1.4 1.9
(–0.1, 3.1) (0.3, 3.8) (0.1, 2.7) (0.7, 3.4) (0.1, 2.5) (0.5, 3.2)
RCP6.0 1.1 2.2 1.2 2.3 1.1 2.2
(–0.3, 2.6) (0.6, 4.2) (–0.1, 2.3) (0.7, 3.8) (0.0, 2.2) (0.7, 3.6)
RCP8.5 1.8 3.7 1.8 3.7 1.8 3.7
(0.2, 3.5) (1.8, 6.1) (0.4, 3.1) (2.1, 5.6) (0.4, 3.0) (2.1, 5.4)
TABLE 3. Projections of average temperature anomaly (°C) in Vietnam for different seasons
(3-monthly time slices) over different time horizons and emissions pathways, showing the median
estimates of the full CCKP model ensemble and the 10th and 90th percentiles in brackets
2040–2059 2080–2099
Scenario Jun–Aug Dec–Feb Jun–Aug Dec–Feb
RCP2.6 1.0 1.1 1.0 1.2
(0.1, 2.1) (–0.1, 2.4) (0.1, 2.1) (0.0, 2.5)
RCP4.5 1.4 1.4 1.9 1.9
(0.4, 2.4) (0.1, 2.6) (0.8, 3.0) (0.6, 3.3)
RCP6.0 1.2 0.9 2.4 2.1
(0.2, 2.3) (–0.1, 2.1) (1.1, 3.7) (0.6, 3.6)
RCP8.5 1.7 1.9 3.5 3.7
(0.5, 2.8) (0.5, 3.2) (2.4, 5.4) (1.8, 5.6)
conditions can vary widely between different GCMs. This is particularly the case for rainfall related variables and at
national and local scales. Exploring the spread of climate model outputs can assist in understanding uncertainties
associated with climate models. The range of projections from 16 GCMs on the indicators of average temperature
anomaly and annual precipitation anomaly for Vietnam under RCP8.5 is shown in Figure 4.
Key Trends
Temperature
Projections of future temperature change are presented in three primary formats. Shown in Table 2 are the changes
in daily maximum and daily minimum temperatures over the given time period, as well as changes in the average
temperature. Figures 5 and 6 display the annual and monthly average temperature projections. While similar, these three
indicators can provide slightly different information. Monthly/annual average temperatures are most commonly used for
11
WBG Climate Change Knowledge Portal (CCKP, 2019). Climate Data: Projections. URL: https://climateknowledgeportal.worldbank.
org/country/vietnam/climate-data-projections
CLIMATE RISK COUNTRY PROFILE: VIETNAM 7FIGURE 4. ‘Projected average temperature Global Temperature Projections
anomaly’ and ‘projected annual rainfall
anomaly’ in Vietnam. Outputs of 16 models Unless otherwise stated projections
within the ensemble simulating RCP8.5 over the shown here represent changes against
period 2080–2099. Models shown represent the 1986–2005 baseline. An additional
the subset of models within the ensemble 0.61°C of global warming is estimated to
which provide projections across all RCPs and have taken place between the periods
therefore are most robust for comparison. 1850–1900 and 1986–2005. 12 The
6 global average temperature changes
Average temperature anomaly (°C)
5 miroc_esm_chem projected between 1986–2005 and
2081–2100 in the IPCC’s Fifth
4
noresm1_m
Assessment Report are:
3
giss_e2_r
2 • RCP2.6: 1.0°C
Median,
1 10th and 90th • RCP4.5: 1.8°C
Percentiles
0
• RCP6.0: 2.2°C
–15% –10% –5% 0% 5% 10% 15% 20% 25%
Average annual precipitation anomaly (%)
• RCP8.5: 3.7°C
general estimation of climate change, but the daily maximum and minimum can explain more about how daily life might
change in a region, affecting key variables such as the viability of ecosystems, health impacts, productivity of labour, and
the yield of crops, which are often disproportionately influenced by temperature extremes.
Vietnam is projected to experience an average temperature increase of 3.4°C by 2080–2100 under the highest
emission pathway (RCP8.5). This warming is slightly less than the global average projected by the IPCC AR5
report of 3.7°C. By the end of the century Vietnam is projected to experience three times greater warming under
RCP8.5 when compared to RCP2.6, the lowest emissions pathway. Notably, across all emissions scenarios and
future time periods, changes in annual maximum temperatures are greater than changes in average temperature.
Study suggests that temperature increases will be strongest in southern Vietnam, but uncertainty is high in sub-
national comparisons.13
Precipitation
Considerable uncertainty clouds projections of future precipitation change, as shown in Figure 7, none
of the end-of-century changes across the four emissions pathways are statistically significant. However,
as shown in Figure 4, out of 16 models analyzed, 12 show an increase in average annual precipitation in
the WBG’s model ensemble. Comprehensive analysis of climate projections on a regional level by Katzfey
et al. (2014) suggests that there is no strong consensus around either significant increases or decreases in
12
Kirtman, B., Power, S. B., Adedoyin, A. J., Boer, G. J., Bojariu, R., Camilloni, I., . . . Wang, H.-J. (2013). Near-term Climate Change:
Projections and Predictability. In Climate Change 2013: The Physical Science Basis. Contribution of Working Group I to the Fifth
Assessment Report of the Intergovernmental Panel on Climate Change (pp. 953–1028). Cambridge, United Kingdom and New York,
NY, USA: Cambridge University Press.
13
Katzfey, J., McGregor, J., Suppiah, R. (2014). High-resolution climate projections for Vietnam: Technical Report. CSIRO, Australia.
CLIMATE RISK COUNTRY PROFILE: VIETNAM 8FIGURE 5. Historic and projected average FIGURE 6. Projected change in monthly
annual temperature in Vietnam under RCP2.6 temperature for Vietnam for the period
(blue) and RCP8.5 (red). The values shown 2080–2099 under RCP8.5. The values shown
represents the median of 30+ GCM model represents the median of 30+ GCM model
ensemble with the shaded areas showing the ensemble with the shaded areas showing the
10th–90th percentiles.14 10th–90th percentiles.
30 8
29 7
28 6
27
degreesC
5
degC
26
4
25
3
24
2
23
1980 2000 2020 2040 2060 2080 2100 1
Year Jan Feb Mar Apr May Jun Jul Aug Sep Oct Nov Dec
Historical RCP 2.6 RCP 4.5 RCP 6.0 RCP 8.5
annual rainfall.15 By contrast, modeling conducted
by the Vietnam Ministry of Natural Resources and FIGURE 7. Boxplots showing the projected
Environment shows more confidence in projections average annual precipitation for Vietnam
of annual precipitation increases across all mainland in the period 2080–209920
regions of Vietnam. Changes projected are typically 2800
in the range of 10% to 20% by 2045–2065 under 2600
2400
both the RCP4.5 and RCP8.5 emissions scenarios. 16
2200
Some variation in extreme rainfall amounts is reported, 2000
mm
with some increases in extreme rainfall projected in 1800
1600
southern and central Vietnam, and slight reductions
1400
projected elsewhere. These projections are broadly 1200
in line with global trends. The intensity of sub-daily 1000
Historical RCP 2.6 RCP 4.5 RCP 6.0 RCP 8.5
extreme rainfall events appears to be increasing
with temperature, a finding supported by evidence
from different regions of Asia.17 The poor performance of global climate models in consistently projecting
precipitation trends has been linked to their poor simulation of the El Niño phenomenon,18,19 an important area
for future development.
14
WBG Climate Change Knowledge Portal (CCKP, 2019). Climate by Sector. URL: https://climateknowledgeportal.worldbank.org/
country/vietnam
15
Katzfey, J., McGregor, J., Suppiah, R. (2014). High-resolution climate projections for Vietnam: Technical Report. CSIRO, Australia.
16
MONRE (2016). Climate change and sea level rise scenarios for Vietnam. Vietnam Ministry of Natural Resources and Environment (MONRE).
17
Westra, S., Fowler, H. J., Evans, J. P., Alexander, L. V., Berg, P., Johnson, F., Kendon, E. J., Lenderink, G., Roberts, N. (2014). Future
changes to the intensity and frequency of short-duration extreme rainfall. Reviews of Geophysics, 52, 522–555.
18
Yun, K.S., Yeh, S.W. and Ha, K.J. (2016). Inter-El Niño variability in CMIP5 models: Model deficiencies and future changes. Journal of
Geophysical Research: Atmospheres, 121, 3894–3906.
19
Chen, C., Cane, M.A., Wittenberg, A.T. and Chen, D. (2017). ENSO in the CMIP5 simulations: life cycles, diversity, and responses to
climate change. Journal of Climate, 30, 775–801.
20
WBG Climate Change Knowledge Portal (CCKP, 2019). Climate by Sector. URL: https://climateknowledgeportal.worldbank.org/
country/vietnam
CLIMATE RISK COUNTRY PROFILE: VIETNAM 9CLIMATE-RELATED NATURAL HAZARDS
V
ietnam faces high disaster risk levels, ranked 91 out of 191 countries by the 2019 INFORM Risk Index
(Table 4), driven particularly by its exposure to hazards. Vietnam has extremely high exposure to flooding
(ranked joint 1st with Bangladesh), including, riverine, flash, and coastal flooding. Vietnam also has high
exposure to tropical cyclones and their associated hazards (ranked 8th). Drought exposure is slightly lower (ranked
82nd) but is still significant as highlighted by the severe drought of 2015–2017. Vietnam’s overall ranking on the
INFORM Risk Index is somewhat mitigated by its better scores in terms of vulnerability and coping capacity. Table 5
provides an overview of the social and economic losses associated with natural disasters in Vietnam from 1900 to
2018. The sections below highlight potential impacts of climate change on the key natural hazards in the country.
TABLE 4. Selected indicators from the INFORM 2019 Index for Risk Management for Vietnam.
For the sub-categories of risk (e.g., “Flood”) higher scores represent greater risks. Conversely the
most at-risk country is ranked 1st.
Lack of Overall
Tropical Coping Inform
Cyclone Drought Vulnerability Capacity Risk Level
Flood (0–10) (0–10) (0–10) (0–10) (0–10) (0–10) Rank (1–191)
10.0 7.9 3.5 2.4 4.2 3.8 91
TABLE 5. Summary of natural hazards in Vietnam from 1900 to 201821
Events Total Total Total damage
Disaster Type Disaster Subtype Count Deaths Affected (‘000 US$)
Drought Drought 6 0 7,860,000 7,399,120
Epidemic Others 1 16 83 0
Bacterial disease 1 598 10,848 0
Parasitic disease 1 200 0 0
Viral disease 8 395 97,027 0
Flood Others 16 1,012 2,011,287 160,055
Coastal flood 6 804 4,353,316 749,000
Flash flood 13 481 912,607 516,700
Riverine flood 52 3,644 25,637,158 2,896,407
Landslide Avalanche 1 200 38,000 0
Landslide 4 109 40 0
Mudslide 1 21 1,034 2,300
Storm Others 10 323 219,280 145,035
Convective storm 8 160 4,513 10,100
Tropical cyclone 92 18,869 53,272,568 9,967,657
21
Emergency Events Database (EM-DAT) of the Centre for Research on the Epidemiology of Disasters (CRED). Assessed on Nov 26,
2018. URL: https://www.emdat.be/
CLIMATE RISK COUNTRY PROFILE: VIETNAM 10Heat Waves
Vietnam regularly experiences high maximum temperatures, with an average monthly maximum of around 28°C
and an average May maximum of 31°C. The current daily probability of a heat wave is around 3%.22 Temperature
rises in Vietnam, a country already experiencing high average temperatures, are expected to lead to what might be
considered chronic heat stress in some areas, even under lower emissions pathways. Study highlights both Hanoi
and Ho Chi Minh City among the urban areas most threatened by deadly heat globally.23
Multi-model ensemble suggests an increase in the
daily probability of heatwave under all emissions FIGURE 8. Projected changes in daily
pathways. Changes are significantly greater probability of observing a heat wave in
under higher emissions pathways, with probability Vietnam under all RCPs. A ‘Heat Wave’ is
increasing to 40% by 2080–2099 under RCP8.5, defined as a period of 3 or more days where
versus around 8% under RCP2.6 (Figure 8). the daily temperature is above the long-term
These values reflect a transition to a less stable 95th percentile of daily mean temperature.25
temperature regime. Heatwaves and temperature 0.7
extremes are likely to remain correlated with ENSO 0.6
events, and ENSO can be treated as an early daily probability 0.5
warning of potential disaster-level events when 0.4
the two drivers combine. Analysis suggests climate 0.3
change made a 29% contribution to the extreme 0.2
temperatures experienced across Southeast Asia 0.1
in April 2016, while ENSO contributed 49%. The 0
Historical RCP 2.6 RCP 4.5 RCP 6.0 RCP 8.5
contribution of general global warming is likely to
grow, the contribution of climate change through
its likely impact on the ENSO process is poorly
understood.24
Drought
Two primary types of drought may affect Vietnam, meteorological (usually associated with a precipitation deficit)
and hydrological (usually associated with a deficit in surface and subsurface water flow, potentially originating in
the region’s larger river basins). At present Vietnam faces an annual median probability of severe meteorological
drought of around 4%, as defined by a standardized precipitation evaporation index (SPEI) of less than –2.26
Recent analysis provides a global overview of changes in drought conditions under different warming scenarios.
Projections for Southeast Asia suggest that the return periods of droughts will reduce. This trend is less significant
22
WBG Climate Change Knowledge Portal (CCKP, 2019). Climate Data-Projections. URL: https://climateknowledgeportal.worldbank.
org/country/vietnam/climate-data-projections
23
Matthews, T., Wilby, R.L. and Murphy, C. (2017). Communicating the deadly consequences of global warming for human heat
stress. Proceedings of the National Academy of Sciences, 114, 3861–3866.
24
Thirumalai, K., DiNezio, P. N., Okumura, Y., & Deser, C. (2017). Extreme temperatures in Southeast Asia caused by El Niño and
worsened by global warming. Nature Communications: 8: 15531.
25
WBG Climate Change Knowledge Portal (CCKP, 2019). Climate Data-Projections. URL: https://climateknowledgeportal.worldbank.
org/country/vietnam/climate-data-projections
26
WBG Climate Change Knowledge Portal (CCKP, 2019). Climate Data-Projections. URL: https://climateknowledgeportal.worldbank.
org/country/vietnam/climate-data-projections
CLIMATE RISK COUNTRY PROFILE: VIETNAM 11under lower levels of global warming, but once warming reaches 2°C–3°C events that presently occur only once in
every hundred years may return at frequencies greater than once in every fifty years in Southeast Asia.27
Broadly in line with this estimate, the multi-model
ensemble projects an increase in the annual FIGURE 9. Annual probability of Vietnam
probability of drought in Vietnam of around 10% experiencing a year with severe drought
under all emissions pathways (Figure 9), and this conditions in the period 2080–209929
increase remains relatively constant over the period 0.6
from 2020–2100. Analysis suggests these changes 0.5
apply across all of Vietnam’s regions, with droughts 0.4
projected to take place more often and for longer
unitless
0.3
periods. However, there is some variation between
0.2
climate models and downscaling approaches and
caution should be applied to the application of these 0.1
projections.28 0
Historical RCP 2.6 RCP 4.5 RCP 6.0 RCP 8.5
Flood
Flood represents the largest risk by economic impact in Vietnam, accounting for an estimated 97% of average
annual losses from hazards. The World Resources Institute’s AQUEDUCT Global Flood Analyzer can be used to
establish a baseline level of river flood exposure. As of 2010, assuming protection for up to a 1-in-25 year event,
the population annually affected by flooding in Vietnam is estimated at 930,000 people and expected annual
impact on GDP at $2.6 billion.30 This is slightly higher than the UNISDR estimate of annual losses from all flood
types of approximately $2.3 billion.31
Development and climate change are both likely to increase these figures. A study by the World Bank suggests
that around 33% of the national population are vulnerable to flooding at a return level of 1-in-25 years, but this
will increase to 38% under RCP2.6 and 46% under RC8.5 by 2100.32 AQUEDUCT makes a similar projection,
but reported in annualized terms. The climate change component, when isolated, is projected to increase the
annually affected population by 433,000 people, and the impact on GDP by $3.6 billion by 2030 under the RCP8.5
emissions pathway.
27
Naumann, G., Alfieri, L., Wyser, K., Mentaschi, L., Betts, R. A., Carrao, H., . . . Feyen, L. (2018). Global Changes in Drought Conditions
Under Different Levels of Warming. Geophysical Research Letters, 45(7), 3285–3296.
28
Katzfey, J., McGregor, J., Suppiah, R. (2014). High-resolution climate projections for Vietnam: Technical Report. CSIRO, Australia.
29
WBG Climate Change Knowledge Portal (CCKP, 2019). Climate by Sector. URL: https://climateknowledgeportal.worldbank.org/
country/vietnam
30
WRI (2018). AQUEDUCT Global Flood Analyzer. Available at: https://floods.wri.org/# [accessed: 22/11/2018]
31
UNISDR (2014). PreventionWeb: Basic country statistics and indicators. Available at: https://www.preventionweb.net/countries
[accessed 14/08/2018].
32
Bangalore, M., Smith, A., & Veldkamp, T. (2016). Exposure to Floods, Climate Change, and Poverty in Vietnam. Policy Research
Working Paper 7765, The World Bank. URL: http://documents.worldbank.org/curated/en/928051469466398905/pdf/WPS7765.pdf
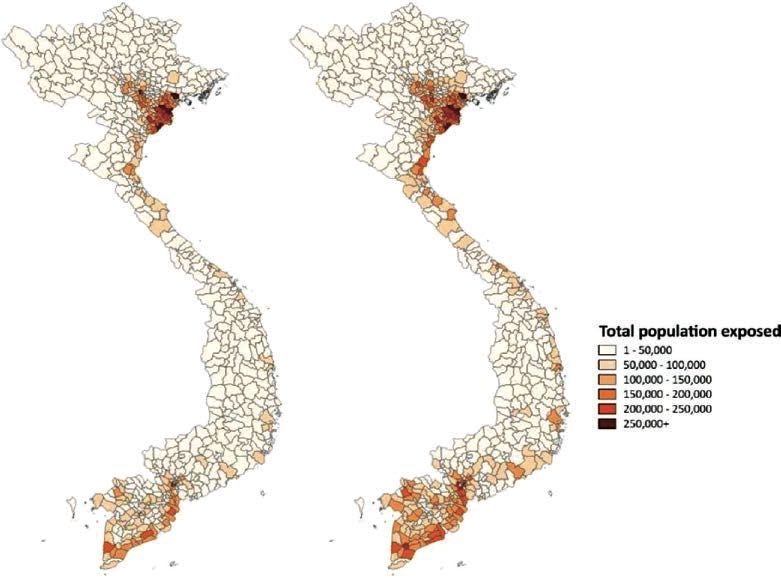
CLIMATE RISK COUNTRY PROFILE: VIETNAM 12Impacts are heavily concentrated in Vietnam’s two mega-river deltas, of the Red River and Mekong River, and urban
areas in their vicinity including the nation’s two largest conurbations, Hanoi and Ho Chi Minh City (Figure 10). The
deltas receive floods annually with the monsoon season, and over decades many households have learned to live
with, and exploit the benefits provided by the flood. Intensification of extreme events, as projected by most global
models, as well as rising sea-levels, will exacerbate the risks posed by river floods. Research projects an increase in
the population affected by an extreme river flood in the order of 3–10 million by 2035–2044 as a result of climate
change (Table 6).33
FIGURE 10. Absolute exposure at the district level (total number of people in a district exposed),
for a 25-year historical flood (left) and a 25-year historical flood under RCP8.5 (right)34
33
Willner, S., Levermann, A., Zhao, F., Frieler, K. (2018). Adaptation required to preserve future high-end river flood risk at present
levels. Science Advances: 4:1.
34
Bangalore, M., Smith, A., & Veldkamp, T. (2016). Exposure to Floods, Climate Change, and Poverty in Vietnam. Policy Research
Working Paper 7765, The World Bank.
CLIMATE RISK COUNTRY PROFILE: VIETNAM 13TABLE 6. Estimated number of people affected by an extreme river flood (extreme river flood
is defined as being in the 90th percentile in terms of numbers of people affected) in the historic
period 1971–2004 and the future period 2035–2044. Figures represent an average of all four
RCPs and assume present day population distributions.35
Population Exposed Population Exposed Increase
to Extreme Flood to Extreme Flood in Affected
Estimate (1971–2004) (2035–2044) Population
16.7 Percentile 4,714,238 14,500,863 9,786,625
Median 10,009,842 17,870,746 7,860,904
83.3 Percentile 18,246,015 21,576,580 3,330,565
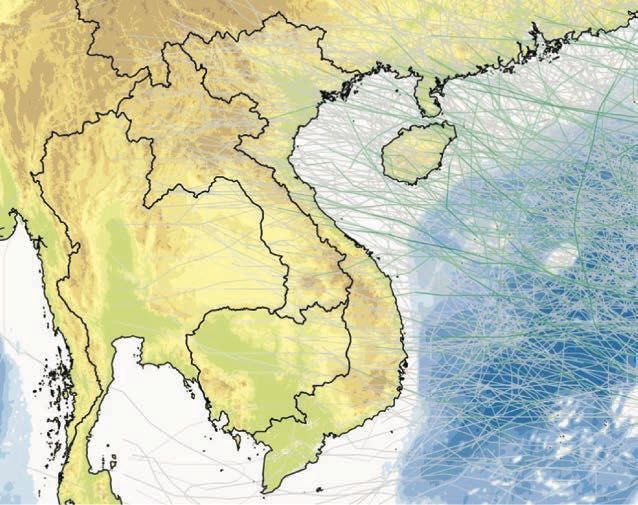
Tropical Cyclones and Storm Surge
Vietnam has very high exposure to tropical cyclones, with a particularly high rate of landfall along its northern coast
(Figure 11). Climate change is expected to interact with cyclone hazard in complex ways which are currently poorly
understood. Known risks include the action of sea-level rise to enhance the damage caused by cyclone-induced
storm surges, and the possibility of increased wind speed and precipitation intensity. Previous work by the World
Bank, albeit based on older climate projections, has highlighted the potentially significant growth in the area of
Vietnam that would be exposed to storm surge under increased sea-levels and storm intensities.36
FIGURE 11. Historical cyclone tracks over Vietnam (1970–2015)37
Tropical depression
Tropical storm
SScat 1
SScat 2
SScat 3
SScat 4
SScat 5
35
Willner, S., Levermann, A., Zhao, F., Frieler, K. (2018). Adaptation required to preserve future high-end river flood risk at present
levels. Science Advances: 4:1.
36
Dasgupta, S., Laplante, B., Murray, S. and Wheeler, D. (2009). Sea-level Rise and Storm Surges: A Comparative Analysis of Impacts
in Developing Countries. The World Bank.
37
The Global Risk Data Platform. Assessed on Nov 26, 2018. URL: https://preview.grid.unep.ch/index.php?preview=map&lang=eng
CLIMATE RISK COUNTRY PROFILE: VIETNAM 14Modelling of climate change impacts on cyclone intensity and frequency conducted across the globe points to a
general trend of reduced cyclone frequency and increased intensity and frequency of the most extreme events.38
Further research is required to better understand potential changes in cyclone seasonality and routes, and the
potential for cyclone hazards to be experienced in unprecedented locations.
Studies suggest there has been a general trend involving an eastward shift of cyclone activity in the Western
North Pacific. Studies suggest this shift may be enhanced by climate change under higher emissions pathways.39
While studies are limited to subsets of models and many utilize older emissions scenarios and/or the AR3 model
ensemble, existing data suggests this has already begun reducing the frequency of tropical cyclone landfall over
Vietnam and Southeast Asia.40 Studies (albeit with similar limitations) have also suggested a small potential shift
of cyclone activity away from summer months and towards the winter.41
Climate change induced sea-level rise is likely to increase the potential risk associated with storm surges driven by
tropical cyclones. Studies estimate that without adaptation 9% of national GDP will be at risk from the impact of
a 1-in-100-year storm surge impacting the Red River Delta region in 2050.42 Storm surge is found to be a major
contributor to the economic costs of climate change on a national level in the period beyond 2050.43
CLIMATE CHANGE IMPACTS
Climate Change Impacts on Natural Resources
Water
Vietnam’s water resources already experience significant pressures from human development processes. Key issues
include over-utilization of groundwater, land-use changes (notably to aquaculture) and rapid, sometimes unplanned,
urban development.44 These processes also include transboundary issues in the case of the Mekong River, the basin
of which spans four other nations. Considerable uncertainty clouds projections of change in future precipitation
and cyclone activity. Most studies suggest such changes will have a markedly lesser impact in comparison with
38
Walsh, K., McBride, J., Klotzbach, P., Balachandran, S., Camargo, S., Holland, G., Knutson, T., Kossin, J., Lee, T., Sobel, A., Sugi, M. (2015).
Tropical cyclones and climate change. WIREs Climate Change: 7: 65–89.
39
Kossin, J., Emmanuel, K., Camargo, S. (2016). Past and projected changes in Western North Pacific tropical cyclone exposure.
Journal of Climate: 29: 5725–5739.
40
Redmond, G., Hodges, K. I., Mcsweeney, C., Jones, R., & Hein, D. (2015). Climate Dynamics: 45: 1983–2000.
41
Wang, C., Liang, J., & Hodges, K. I. (2017). Projections of tropical cyclones affecting Vietnam under climate change: downscaled
HadGEM2-ES using PRECIS 2.1. Quarterly Journal of the Royal Meteorological Society: 143: 1844–1859.
42
Neumann, J., Emanuel, K., Ravela, S., Ludwig, L., & Verly, C. (2015). Risks of Coastal Storm Surge and the Effect of Sea Level Rise in
the Red River Delta, Vietnam. Sustainability: 7: 6553–6572.
43
Arndt, C., Tarp, F., & Thurlow, J. (2015). The economic costs of climate change: A multi-sector impact assessment for Vietnam.
Sustainability: 7: 4131–4145.
44
Erban, L. E., Gorelick, S. M., & Zebker, H. a. (2014). Groundwater extraction, land subsidence, and sea-level rise in the Mekong Delta,
Vietnam. Environmental Research Letters, 9(8), 084010.
CLIMATE RISK COUNTRY PROFILE: VIETNAM 15human development impacts. In the context of uncertainty research has focused on the development of systems
for more efficient water management, and ensuring water security. These include wastewater reuse, managing
saline intrusion, and soft measures for improving water and irrigation use efficiency.45,46,47 Dam construction is
having a significant impact on the hydrology of the Mekong Delta, but overexploitation of groundwater resources
also represents a major pressure.48
A potential shift in tropical cyclone activity associated with climate change may have noticeable impacts on flow
dynamics.49 Peak flows associated with tropical cyclones have historically delivered the majority of the sediment
which ultimately deposits in the Mekong Delta and determines its capacity to build land height against sea-level
rise. Through this mechanism climate change can also influence nutrient fluxes to the Delta, with knock-on effects
for agricultural productivity.50 Any changes in the frequency and severity of extreme events are likely to have major
social and economic consequences, as shown by the drought event of 2015–2017 and the flooding regularly
experienced in the Mekong Delta throughout the 1990’s and 2000’s. In the case of the Mekong Delta, where
water resources management is a particular challenge, the Mekong Delta Plan, ratified in 2013, aims to set a future
course balancing competing development objectives and managing climate change risks.
The Coastal Zone
Sea-level rise threatens significant physical changes to coastal zones around the world. Global mean sea-level rise
was estimated in the range of 0.44–0.74 meters (m) by the end of the 21st century by the IPCC’s Fifth Assessment
Report51 but some studies published more recently have highlighted the potential for more significant rises
(Table 7).
Vietnam is one of the world’s most vulnerable countries to sea-level rise. Without adaptation an estimated 12 million
people face permanent inundation on higher emissions pathways, primarily concentrated in the nation’s two low-
lying mega-river deltas (Table 8). An estimated 2.4% of Vietnam’s GDP is at risk from permanent inundation in the
Red River Delta region.52 The national and provincial governments of Vietnam are already working to protect their
coastline, primarily through hard infrastructure, and in some cases through mangrove restoration. The protection
of the Mekong Delta has been the subject of debate through the development of the Mekong Delta Plan and its
vision to 2050. In 2016, the Ministry of Natural Resources and the Environment published an extensive assessment
45
Trinh, L. T., Duong, C. C., Van Der Steen, P., & Lens, P. N. L. (2013). Exploring the potential for wastewater reuse in agriculture as a
climate change adaptation measure for Can Tho City, Vietnam. Agricultural Water Management, 128, 43–54.
46
Toan, T. Q. (2014). Climate Change and Sea Level Rise in the Mekong Delta: Flood, Tidal Inundation, Salinity Intrusion, and Irrigation
Adaptation Methods. In N. D. Thao, H. Takagi, & M. B. T.-C. D. and C. C. in V. Esteban (Eds.) (pp. 199–218). Oxford: Elsevier.
47
Hong, N. B., & Yabe, M. (2017). Improvement in irrigation water use efficiency: a strategy for climate change adaptation and
sustainable development of Vietnamese tea production. Environment, Development and Sustainability, 19(4), 1247–1263.
48
Erban, L. E., Gorelick, S. M., & Zebker, H. a. (2014). Groundwater extraction, land subsidence, and sea-level rise in the Mekong Delta,
Vietnam. Environmental Research Letters, 9(8), 084010.
49
Darby, S. E., Hackney, C. R., Leyland, J., Kummu, M., Lauri, H., Parsons, D. R., . . . Aalto, R. (2016). Fluvial sediment supply to a
mega-delta reduced by shifting tropical-cyclone activity. Nature: 539: 276.
50
Whitehead, P. G., Jin, L., Bussi, G., Voepel, H. E., Darby, S. E., Vasilopoulos, G., … Hung, N. N. (2019). Water quality modelling of the
Mekong River basin: Climate change and socioeconomics drive flow and nutrient flux changes to the Mekong Delta. Science of The
Total Environment, 673, 218–229.
51
Church, J. a., Clark, P. U., Cazenave, A., Gregory, J. M., Jevrejeva, S., Levermann, A., . . . Unnikrishnan, A. S. (2013). Sea level change. In Climate
Change 2013: The Physical Science Basis. Contribution of Working Group I to the Fifth Assessment Report of the Intergovernmental Panel
on Climate Change (pp. 1137–1216). Cambridge, United Kingdom and New York, NY, USA: Cambridge University Press.
52
Neumann, J., Emanuel, K., Ravela, S., Ludwig, L., & Verly, C. (2015). Risks of Coastal Storm Surge and the Effect of Sea Level Rise in
the Red River Delta, Vietnam. Sustainability: 7: 6553–6572.
CLIMATE RISK COUNTRY PROFILE: VIETNAM 16TABLE 7. Estimates of global mean sea-level rise by rate and total rise compared to 1986–2005
including likely range shown in brackets, data from Chapter 13 of the IPCC’s Fifth Assessment Report
with upper-end estimates based on higher levels of Antarctic ice-sheet loss from Le Bars et al. 2017
Rate of Global Mean Sea-Level Global Mean Sea-Level Rise in
Scenario Rise in 2100 2100 Compared to 1986–2005
RCP2.6 4.4 mm/yr (2.0–6.8) 0.44 m (0.28–0.61)
RCP4.5 6.1 mm/yr (3.5–8.8) 0.53 m (0.36–0.71)
RCP6.0 7.4 mm/yr (4.7–10.3) 0.55 m (0.38–0.73)
RCP8.5 11.2 mm/yr (7.5–15.7) 0.74 m (0.52–0.98)
Estimate Inclusive of High-End Antarctic Ice-Sheet Loss 1.84 m (0.98–2.47)
of national vulnerability to sea-level rise. The report identifies vulnerable areas in the Red and Mekong deltas, with
50 centimeter (cm) of sea-level rise potentially inundating 6.9% and 4.5% respectively, as well as some vulnerable
central provinces, such as Quang Binh Province where 50cm would inundate 1.7% of the surface area.
In addition to the threat of permanent inundation, livelihoods in Vietnam’s low-lying areas face major challenges
from saline intrusion, which has already forced land-use changes, abandonment, and reduced yields in many
provinces. During particularly severe dry seasons, such as in 2016, salt has intruded up to 50km inland from the
coast and estuary, resulting in major crop damage. Coastal erosion exacerbated by climate change is also an
increasing threat to Vietnam’s extensive coastline.53
TABLE 8. The average number of people experiencing flooding per year in the coastal zone in the
period 2070–2100 under different emissions pathways (assumed medium ice-melt scenario)
and adaptation scenarios for Vietnam (UK Met Office, 2014)54
Scenario Without Adaptation With Adaptation
RCP2.6 6,335,260 47,920
RCP8.5 12,759,460 65,740
Fisheries and aquaculture represent major components of the Vietnamese economy, typically contributing around
6-7% of GDP and a similar proportion of employment. While other human drivers, such as overfishing and
intensification of aquaculture, represent the most significant threats to the sustainability of the sector, climate
change may have relevant impacts. Potential climate change impacts include rapid onset events such as river and
coastal flooding, as well as saline intrusion, which are known to reduce the productivity of aquaculture operations.
Coastal flooding may also impact on coastal infrastructure needed to access ocean fisheries. However, the
most significant climate impact is expected to be the change in the maximum catch potential in ocean fisheries
53
Duc, D.M., Yasuhara, K., Hieu, N.M. and Lan, N.C. (2017). Climate change impacts on a large-scale erosion coast of Hai Hau district,
Vietnam and the adaptation. Journal of Coastal Conservation, 21, 47–62.
54
UK Met Office (2014). Human dynamics of climate change: Technical Report. Met Office, UK Government.
CLIMATE RISK COUNTRY PROFILE: VIETNAM 17You can also read