Vision 2025 Las Vegas Global Economic Alliance
←
→
Page content transcription
If your browser does not render page correctly, please read the page content below

A Comprehensive Economic Development
                                                                         Strategy for Southern Nevada

          Las Vegas
                                                                   Vision 2025
                                                               Prepared by SRI International®
          Global
          Economic
          Alliance

Photo Courtesy of Carol Highsmith/Library of Congress/Flickr

July 2021                                                                       SRI International®
Authors
This report was researched and written by Steven Deitz, Paul Liu, Emily Mellicant, Roland Stephen,
and J.R. Sullivan at the Center for Innovation Strategy and Policy, SRI International. The authors
would like to acknowledge significant support provided by Jonas Peterson and the staff of the Las
Vegas Global Economic Alliance.

Note
This report was developed by SRI, based on research funded by the Las Vegas Global Economic
Alliance. The findings, conclusions, and any errors in the report are the sole responsibility of the
authors. SRI International is a registered trademark.

Contents
  Executive Summary
  Highlights of Southern Nevada’s Progress
1 Introduction
     2 A Note on the Impact of the COVID-19 Pandemic in
       Southern Nevada
3 Summary Background & Economic Assessment
16 SWOT Analysis
18 Strategic Direction & Activities Plan
33 Evaluation Framework
40 Appendix A: Interviewee & Participant List
42 Appendix B: Stakeholder Engagement Exercises
45 Appendix C: Detailed SWOT Analysis
65 Appendix D: Additional Visualizations
67 Appendix E: Data Used for Dislocated Workforce Analysis
70 Notes
Acknowledgements
This Comprehensive Economic Development Strategy is the outcome of a collaborative process
involving dozens of institutions across Southern Nevada. The project would not have been possible
without their participation. We thank the following organizations that contributed to this effort:

Airport Concessionaires,            Gordon Law                          PENTA Building Group
LLC
                                    Governor’s Office of                Raiders
Amerityre Corporation               Economic Development
                                                                        Regional Transportation
Bank of Nevada                      Governor’s Office of                Commission of Southern
                                    Workforce Innovation                Nevada (RTC)
Barclays U.S. Operations
                                    Green Valley Grocery                Renhead
Barrick Gold USA
                                    Greenberg Traurig, LLP              Silverton Casino and Hotel
Black Raven Films
                                    Henderson Chamber of                Southern Nevada Water
Boulder City
                                    Commerce                            Authority
Boulder City Chamber of
                                    Hilton Grand Vacations              Sun Commercial Real
Commerce
                                                                        Estate
                                    JPMorgan Chase
Boyd Gaming
                                                                        Tango Car
                                    Klai Juba Wald Architects
Brown & Brown Insurance
                                                                        U.S. Bank
                                    Las Vegas Global Economic
City of Henderson
                                    Alliance                            University of Nevada, Las
City of Las Vegas                                                       Vegas
                                    Las Vegas HEALS
City of Mesquite                                                        University of Phoenix
                                    Las Vegas Power
City of North Las Vegas             Professionals                       Urban Chamber of
Clark County                                                            Commerce
                                    Manpower Las Vegas
Clark County School District                                            Vegas Golden Knights
                                    Marnell Properties
College of Southern Nevada                                              WaterStart
                                    Martin-Harris Construction
Cox Communications                                                      Wells Fargo Bank
                                    Mesquite Chamber of
Eastridge Workforce                 Commerce                            Western Governors
                                                                        University Nevada
Solutions                           MGM Resorts International
                                                                        Workforce Connections
Fingerprinting Express              Nevada State College
Frazier and Deeter, LLC             Omni Limousine
Executive Summary
Vision 2025: A Comprehensive Economic
Development Strategy for Southern Nevada

         SRI engaged with stakeholders across              SRI also developed a series of goals
         Southern Nevada to develop a vision               and objectives that serve as a
         that captures the ambitions and                   roadmap for Southern Nevada’s
         capabilities of the region.                       future development efforts.

         Focus Groups
         SRI arranged focus groups with dozens of                    Promote a Resilient &
         organizations throughout Southern                              Diverse Economy
         Nevada to identify areas where the region
         outperformed and areas that could use
         further attention. In general, comments in              Connect People, Businesses,
         these focus groups frequently related to:               & Ideas
              Education, training, & workforce
              Strong communities
              Entrepreneurship & business support               Support the Emergence &
              Transportation                              Maturation of Southern Nevada’s
              Technology & innovation                               New Target Industries

         Visioning Exercises
                                                                 Strengthen & Reimagine Regional
         SRI also conducted a series of visioning
                                                                 Collaboration
         exercises with local stakeholders that
         included the use of hypothetical personas
         to identify specific pain points for different
         types of residents in the region. The needs             Stimulate a Future-Ready
         of the different personas generally aligned                            Workforce
         with those of the focus group, with some
         additions.
              Education opportunities & trained
              workforce
              Local amenities
              Affordable housing & cost of living

         These engagement sessions led SRI to
         develop the following vision for Southern
         Nevada:
         Southern Nevada is a global center for
         enterprise, imagination, and new
         experience, driven by innovation in
         entertainment, industry, and technology.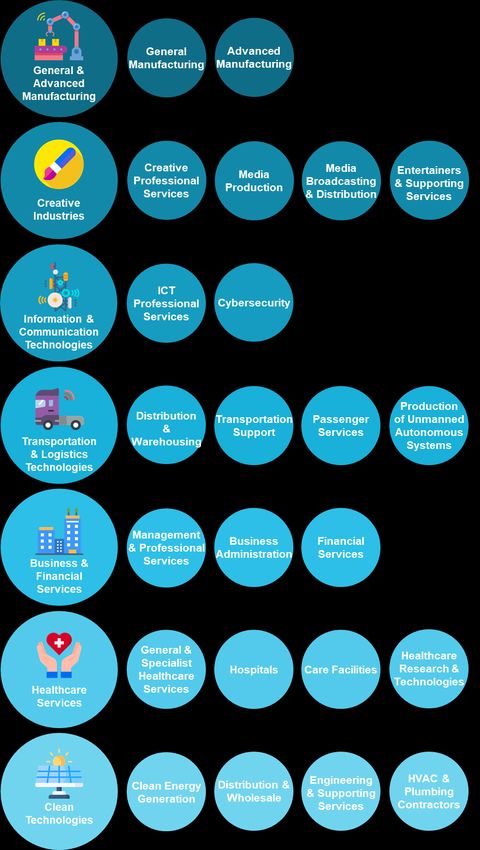
To assess the region’s economy, SRI           SRI used a SWOT analysis to go
conducted a Summary Background &              beyond a purely economic analysis,
Economic Assessment.                          capturing trends in Southern
                                              Nevada’s communities.

    Southern Nevada’s population is           Strengths
    increasing rapidly, growing twice as
    fast as the average for U.S. metro        Southern Nevada has achieved a globally
    areas since 2010. This population         recognized brand built on its world-class
    growth is driven by high domestic         entertainment options. A business-friendly
    migration from other regions in the       climate, strong infrastructure and data
                                              connectivity, and competitive cost of living
    country. Population increase is
    weighted toward young adults and          have enabled the region’s sustained
    seniors, with lower growth in prime       growth.
    working age adults.
                                              Weaknesses
    The region’s economy has recovered
    from the Great Recession, with large      Low educational attainment in the
    increases in GDP and business             region’s workforce and limited
    establishments and a reduction in         resources for R&D and innovation
    measures of economic distress.            hinder growth in high-skill, high-wage
                                              sectors. A scarcity of high-skill job
    Job growth is strong, and
                                              opportunities poses the “trailing
    unemployment continues to decline.
                                              spouse” problem for dual-income
    Unemployment has declined
                                              families.
    approximately 10 percentage points
    since its recession peak and is rapidly   Opportunities
    closing on the national average.
    Additionally, job growth has been         Southern Nevada can enhance its
    greater in higher wage non-hospitality    global connections and emerge as the
    target industries, and average wages      leading sports and entertainment
    across the workforce have increased.      destination in the world. It can be a
    Educational attainment in Southern        dynamic testbed for smart city and
    Nevada is significantly lower than peer   autonomous technology, and a global
    metro areas in the West. The portion      policy and technology leader in water
    of adults with postsecondary degrees      management.
    is rising, but at a slow pace.
                                              Threats
    University research and development
    (R&D) is increasing, but overall          The region remains vulnerable to
    innovation resources and activity in      external economic shocks, and its “Sin
    the region are limited. University        City” reputation can deter families
    technology transfer and the               from moving to the area. Its hospitality
    production of science and engineering     workforce may face displacement with
    degree holders are very low. However,     increased automation and use of
    new technology-focused collaborations     artificial intelligence. Climate change
    and spaces have been established,         may worsen water scarcity and lead to
    and venture capital funding is            dangerous heatwaves.
    increasing.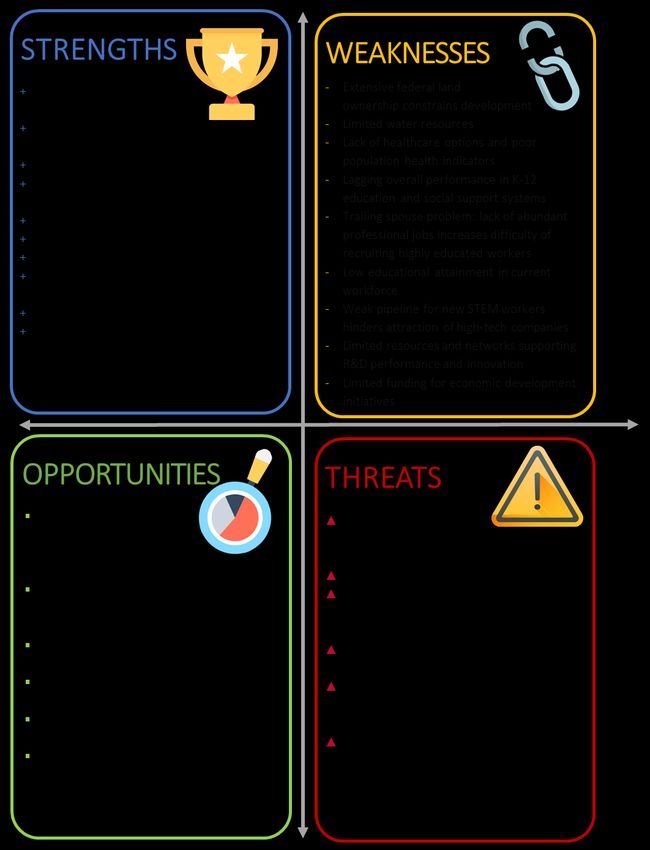
Highlights of Southern Nevada’s Progress
       Despite the impact of the pandemic on Southern Nevada’s communities and economy, the region
       has made significant process over the last decade that leaves it better positioned to recover from
       the pandemic-induced recession. Key institutions in the region have made significant achievements
       and formed new initiatives and collaborations and continue to reach major milestones. Highlights of
       Southern Nevada’s progress include the following:

                                                                                                    50
      200,000                         7,500                           85%
                                                                                                  Million

    Number of jobs               Number of new                 Milestone graduation           Record number of
    added between            business establishments           rate for Clark County         passengers travelling
    2011 and 2019.            added between 2011              School District in 2019.        through McCarran
                                    and 2019.                                            International Airport in 2019.

           Education &                                                        Innovation Ecosystem
           Workforce Development
                                                                               In 2016, Las Vegas established an
           Southern Nevada’s post-secondary education                          Innovation District to spur smart-city
           and training institutions have significantly                        technology infrastructure and launched
           increased their offerings.                              the International Innovation Center @ Vegas
                                                                   (IIC@V) incubator to support development of high
Notably, the University of Nevada, Las Vegas (UNLV)
                                                                   priority emerging technologies. Also, StartUpNV
doubled its research and development (R&D) performance
                                                                   launched the Southern Nevada Angel Conference
over the last decade and reached R1 status in 2018, the
                                                                   Seed Fund.
highest classification for research universities.
Additionally, the newly formed UNLV School of Medicine             The Las Vegas-based Nevada Institute for
started class in 2017, and the university established Black        Autonomous Systems was designated in 2013 as
Fire Innovation, a hospitality and gaming hub supported by         one of six official unmanned aircraft systems (UAS)
collaborations with Intel and Caesars Entertainment.               test sites in the United States, and the UNLV Tech
                                                                   Park has quickly emerged as a hub for regional
Nevada State College (NSC) more than double its degree
                                                                   innovation.
awards since 2011, with especially strong growth in
awards to racial and ethnic minorities, and in health              In July 2019, Google broke ground on a $600
professions that support a key regional target industry.           million data center, and in October 2019 Switch
                                                                   announced a partnership with UNLV to support
The College of Southern Nevada (CSN) was named as a
                                                                   sports science R&D. Switch also expanded its
Leader College of Distinction by national non-profit
                                                                   footprint in Southern Nevada to 4.6 million square
network Achieving the Dream in 2019 for its work on
                                                                   feet of data center space.
improving student outcomes and reducing student
achievement gaps.                                                  The Las Vegas Convention and Visitors Authority
                                                                   (LVCVA) partnered with the Boring Company to
                                                                   build a high-speed electric autonomous people
                                                                   mover for the Las Vegas Convention Center.
Introduction
This Comprehensive Economic Development Strategy (CEDS) presents a new plan for regional
economic development in Southern Nevada. The CEDS will provide essential guidance to regional
leaders across industry, government, nonprofits, and educational institutions in framing their
deliberations on the activities that have strategic economic value for the region. It was developed
with broad community participation, which was essential for developing a shared vision and set of
goals for Southern Nevada.
The Las Vegas Global Economic Alliance (LVGEA) plays a critical role in economic development as
Southern Nevada’s regional development authority. LVGEA has overseen the implementation of the
region’s previous CEDS, which was approved by the U.S. Economic Development Administration
(EDA) in 2013 and revised in 2016. LVGEA will take a leadership role in advancing this new strategy,
but its implementation requires a shared, coordinated effort across Southern Nevada’s institutions.
This strategy addresses Southern Nevada’s unique regional economic context while following EDA
guidelines for a CEDS. Major sections of the document include:
I. Summary Background and Economic Assessment. The Summary Background and
Economic Assessment evaluates Southern Nevada across a broad array of factors that
shape the region’s competitiveness. This quantitative analysis considers Southern
Nevada’s performance over time and in comparison to peer regions.
II. SWOT Analysis. The SWOT Analysis examines Southern Nevada’s regional strengths,
weaknesses, opportunities, and threats (SWOT). It is designed to enable Southern
Nevada to assess its current capabilities and understand how to work with them in order
to navigate future uncertainty.
III. Strategic Direction and Activities Plan. The Strategic Direction and Activities Plani lay
out an economic vision for Southern Nevada and describes the means by which the
region will achieve that vision. The Strategic Direction identifies where stakeholders
would like to be in the near- to mid-future, and the Activities Plan sets out how they will
work together to get there. This portion of the CEDS considers the regional assets and
external factors influencing Southern Nevada’s development examined in the Economic
Assessment and SWOT Analysis.
IV. Evaluation Framework. The Evaluation Framework provides a logic model for assessing
progress toward the goals of the CEDS and includes specific performance measures.
Supplementary information and the Detailed SWOT Analysis are provided in the appendices. The
Executive Summary, which begins on the following page, highlights key findings of the analyses and
briefly describes the vision, goals, and objectives of the strategy.
1A Note on the Impact of the COVID-19 Pandemic in Southern Nevada
The COVID-19 Pandemic introduced significant headwinds for Southern Nevada’s economy.
Beginning in March 2020, large segments of local, regional, national, and international
economies began indefinite closures due to the public health emergency. The dominance of
tourism, gaming, and hospitality in Southern Nevada’s economy once again left the region
disproportionately affected by these closures and, like the Great Recession, the region faced
higher rates of unemployment than other U.S. metropolitan areas.
However, interventions by state and federal governments, as well as local stakeholders like
LVGEA, likely prevented the type of severe, protracted recession that Southern Nevada
experienced in 2010 and 2011 after the Great Recession. These interventions, coupled with the
rapid rollout of vaccines, have jumpstarted Southern Nevada’s recovery. However, actions
remain necessary to strengthen Southern Nevada’s economy in the near-term and fortify it in the
long-term.
The discussion that follows in this CEDS will make references to the impact of the pandemic;
however, the purpose of this document is not to detail a pandemic-recovery strategy for Southern
Nevada. Rather, this document will build off the CEDS that SRI provided to LVGEA in February
2020, maintaining the original dedication to a five-year economic development strategy. While
the pandemic has introduced near-term headwinds for the region and will continue to hamper
growth in Southern Nevada’s traditionally dominant industries, many of the trends identified in
the 2020 CEDS remain true a year after the beginning of the pandemic. Such trends include:
Las Vegas remains one of the United States’ fastest growing metropolitan areas,
attracting individuals from all age groups, but particularly retirees.
Southern Nevada’s economy remains robust, with strong growth between 2011 and 2019
and a rapidly evolving recovery in 2020 and 2021.
Workforce capabilities remain a key concern for regional employers, and regional
organizations such as LVGEA and the Clark County government have made workforce
development efforts a leading priority for the region’s pandemic recovery.
Educational attainment continues to improve in Southern Nevada, but a more skilled
workforce remains necessary for the development of new industries in the region.
Southern Nevada’s innovation ecosystem remains an area in need of further support if
the region is to grow its capabilities in next-generation industries like advanced
manufacturing.
As a result, many of SRI’s original recommendations remain relevant during the pandemic and
will likely remain critical for post-pandemic growth and diversification. Nevertheless, SRI has
revised the 2020 CEDS to include data that captures the impact of the COVID-19 pandemic,
where possible, and provided a modified Strategic Direction & Activities Plan.
2Vision 2025
Summary Background &
Economic Assessment
A Comprehensive Economic Development
Strategy for Southern Nevada
Photo Courtesy of Mathieu Lebreton/Flickr
Summary Background & Economic Assessment
The Summary Background and Economic Assessment evaluates Southern Nevada across a broad
array of factors that shape the region’s competitiveness. These factors include demographics,
general economic conditions, labor market attributes and educational attainment, trends in target
industry sectors, and innovation and entrepreneurship activity. This quantitative analysis considers
Southern Nevada’s performance over time and in comparison to peer regions; qualitative factors and
stakeholder insights are more thoroughly discussed in the subsequent SWOT analysis. The trend
analysis primarily uses 2011 as the baseline year given its significance as the period of most intense
economic distress in Southern Nevada due to the Great Recession. SRI selected peer regions in
consultation with LVGEA on a mix of criteria, including size, rate of growth, geographic proximity,
climate similarities, and shared industry sectors.
Methodological Note
Most of the data in the Summary Background and Economic Assessment is analyzed at the level
of the metropolitan statistical area (MSA), as defined by the U.S. Office of Management and
Budget. The Las Vegas-Henderson-Paradise MSA is coextensive with Clark County, Nevada. Clark
County is the only county in the Southern Nevada region as defined by the Nevada Governor’s
3Office of Economic Development (GOED) and supported by LVGEA as the state-appointed
regional development authority (RDA).2 This report uses the terms Southern Nevada, greater Las
Vegas, and Las Vegas region/metro area interchangeably, and these should be seen as
equivalent.
Additionally, the names of the Las Vegas metro area and its peer regions may appear differently
in different tables and figures; this is due to differences in how the metro areas are named by
each data source. For example, the Las Vegas metro area may be referred to as Las Vegas-
Paradise, NV or Las Vegas-Henderson-Paradise, NV. Peer region names may also differ, such as
Phoenix-Mesa-Scottsdale, AZ and Phoenix-Mesa-Glendale, AZ. Regardless of the presented name
for the metro areas, the data provided comprehensively represents the various regions examined
in this report.
This analysis uses comprehensive datasets from Emsi, a commercial data service that integrates
economic and workforce data from a variety of data providers, as well as data gathered directly
from federal statistical agencies, such as the U.S. Census Bureau, Bureau of Economic Analysis,
and Bureau of Labor Statistics.
Demographics
The Las Vegas metropolitan area has experienced significant growth over the last decade, adding
more than 300,000 new residents. This population growth has been driven predominantly by
domestic migration from other regions within the United States, accounting for 59% of the region’s
total population growth during this time, far outpacing the region’s rate of natural increase (Figure 1
below).3 International migration is also a net contributor to the region’s population, but to a lesser
extent than the natural increase and domestic migration.
Migration from Other U.S. Regions Accounts for Most of Southern Nevada’s
Population Growth
Figure 1: Cumulative Estimates of the Components of Population Change, April 2010 to July 2019. Source: Population
Estimates Program, U.S. Census Bureau.
350,000
185,570 315,447
300,000
250,000
200,000
150,000
23,319
105,372
100,000
50,000
0
Natural Increase International Migration Domestic Migration Total
4Overall, between 2011 and 2019, the region’s population grew by nearly 16%. Among the peer
regions selected for this analysis, only three metros grew at a quicker pace: Austin, Orlando, and
Phoenix. Figure 2 provides detail on population change in Las Vegas and its peer metro regions (see
Table 9, Table 10, and Figure 13 in Appendix D for more detailed demographic data).
Within this overall population increase, it is worthwhile to disaggregate trends for different age
groups. The growth rate for individuals aged 25–44 is of particular interest given that this group
captures early- and mid-career workers who are likely to make significant contributions to the
region’s workforce. For the Las Vegas metropolitan area, the population of this age group increased
by 7.6% between 2011 and 2019. As the figure shows, however, Las Vegas’ growth for those aged
25–44 is relatively low among its peer regions, ranking the Las Vegas metropolitan area ninth out of
the ten regions examined.
Southern Nevada has experienced a substantial increase in its population aged 65 and older, a
common trend among its peer metro areas, many of which are located in the Southwest (see Figure
13 in Appendix D). A variety of factors may be driving the increase in this population group, but these
likely include Southern Nevada’s favorable cost-of-living, especially as compared to neighboring
coastal states, as well as the relative stability and warmth of the region’s climate.
Southern Nevada’s Population has Grown Rapidly, Fueled by Those Aged 65+
Figure 2: Population Change in Las Vegas and its Peer Metro Areas, 2011-2019. Source: U.S. Census Bureau, Population
Division; American Community Survey.
Austin-Round Rock-Georgetown, TX
Orlando-Kissimmee-Sanford, FL
Phoenix-Mesa-Chandler, AZ
% Change in 65+: 47.5%
Las Vegas-Henderson-Paradise, NV % Change in 25-44: 7.6%
% Change in Total: 15.5%
Denver-Aurora-Lakewood, CO
Colorado Springs, CO
Salt Lake City, UT
Portland-Vancouver-Hillsboro, OR-WA
Sacramento-Roseville-Folsom, CA
Albuquerque, NM
0% 10% 20% 30% 40% 50% 60% 70%
5General Economic Measures
Over the last decade, Southern Nevada has achieved strong gross domestic product (GDP) growth,
with GDP increasing by nearly 50% between 2011 and 2019 (Figure 3Error! Reference source not
found.). Growth in the Las Vegas metro accelerated in the latter half of the decade, placing the
region in the middle of the pack of its peer metros.
The Las Vegas Metro Area Has Experienced Strong GDP Growth
Figure 3: Index of GDP Growth for Las Vegas and Peer Metros (2011=100). Source: Bureau of Economic Analysis, Federal
Reserve Bank of St. Louis.
170
160
150
146
140 139
130
128
Las Vegas-Henderson-
122 Paradise, NV
120
117
110 109
105
100 100 101
2011 2012 2013 2014 2015 2016 2017 2018 2019
However, while data for 2020 are not yet available for MSA GDP, it is clear the pandemic has had a
negative impact on Southern Nevada’s economy, and it is likely the regional economic contraction
has moderated the gains made since 2011 (for example, see the rise in unemployment in Figure 5).
Despite general economic expansion prior to the pandemic, poverty rates increased for adults in Las
Vegas across all levels of educational attainment, climbing the highest for those with a high school
diploma or equivalent (Table 11). The increase in poverty rates follows a general trend shared by
many of Las Vegas’ peer metros, which have significantly expanded their economies and
populations. An increasing poverty rate can be a consequence of in-migration of lower income
populations rather than regional economic decline. Data from the Economic Innovation Group (EIG)
show that even as the poverty rate has increased, the percentage of Clark County’s population living
in distressed ZIP codes has more than halved, falling from 31.6% (2007–2011) to 14.1% (2014–
2018).4
6Wages and Educational Attainment
Wages in Southern Nevada have shown moderate growth since the Great Recession. According to
the Bureau of Labor Statistics, the average wage in the region increased from $41,290 in 2011 to
$44,450 in 2017, an increase of almost 8%.5 However, data from the U.S. Census Bureau for the
same time period indicate that wages are not rising consistently across different education levels in
Southern Nevada; instead, the data suggest that wages are actually rising slowest for the highly
educated.6 This trend counteracts developments in peer regions and much of the rest of the nation,
where wages are increasing most quickly for those with higher levels of educational attainment. For
example, wages have increased by over 10% for workers with graduate degrees in the Portland and
Salt Lake City metros, while remaining static in the Las Vegas metro. Low-wage growth for higher
education levels produces disincentives on two fronts: Southern Nevada’s workers may not see a
need for further education, and highly educated workers located outside the region may fear a pay
decrease if they relocate to the area.
The Las Vegas metro still lags far behind peer regions in educational attainment (Table 1). Las Vegas
has the lowest concentration of adults with a bachelor’s degree and those with a graduate degree or
higher. Southern Nevada still struggles to develop and attract highly skilled workers.
Southern Nevada’s Labor Force Remains Concentrated in Lower Education
Levels
Table 1. Percentage of Adults 25 and Over by Highest Educational Attainment Among Peer Metros, 2019. Source:
American Community Survey, U.S. Census Bureau.
High Graduate
Some Associates Bachelor’s
Metropolitan Area School Degree or
College Degree Degree
Graduate Higher
Albuquerque, NM 25% 23% 9% 18% 14%
Austin-Round Rock-San Marcos, TX 19% 20% 6% 29% 16%
Colorado Springs, CO 21% 24% 11% 24% 15%
Denver-Aurora-Broomfield, CO 20% 20% 8% 28% 16%
Las Vegas-Paradise, NV 28% 25% 8% 16% 8%
Orlando-Kissimmee-Sanford, FL 26% 20% 12% 21% 11%
Phoenix-Mesa-Glendale, AZ 23% 24% 9% 20% 11%
Portland-Vancouver-Hillsboro, OR-WA 20% 24% 9% 25% 15%
Sacramento--Arden-Arcade--Roseville, CA 21% 25% 10% 22% 12%
Salt Lake City, UT 23% 24% 9% 22% 13%
Southern Nevada has experienced some growth in the percentage of adults with a bachelor’s degree
or higher, but not to the same extent as its peer regions (Figure 4). The Las Vegas metro only saw a
2.4 percentage point increase in the share of people 25 years or older with a bachelor’s degree or
higher. While Las Vegas is growing rapidly, it is still lagging peer metropolitan areas in expanding its
educated workforce.
7Las Vegas Lags in Developing and Attracting High-Skilled Workers
Figure 4: Percentage Point Change in the Share of Population Over 25 with a Bachelor’s Degree or Higher among Peer
Metropolitan Areas, between 2011 and 2019. Source: American Community Survey, U.S. Census Bureau.
Las Vegas-Paradise, NV
Albuquerque, NM
Phoenix-Mesa-Glendale, AZ
Sacramento--Arden-Arcade--Roseville, CA
Colorado Springs, CO
Orlando-Kissimmee-Sanford, FL
Salt Lake City, UT
Austin-Round Rock-San Marcos, TX
Denver-Aurora-Broomfield, CO
Portland-Vancouver-Hillsboro, OR-WA
0.0 1.0 2.0 3.0 4.0 5.0 6.0 7.0
Employment
Prior to the pandemic recession, Southern Nevada experienced rapid job growth. Total employment
in all sectors increased by roughly 17%, from about 876,000 in 2011 to 1,086,000 in 2019.
Concurrently, the unemployment rate in the region fell sharply. As Figure 5 shows, the Las Vegas
metropolitan area followed peer metropolitan regions’ trends in reducing unemployment between
2011 and 2019, falling from 13.2% to under 4.0%. However, the pandemic has rapidly increased the
levels of unemployment in Southern Nevada, and the region’s annual average for 2020 was 4.5
percentage points higher than the next-highest metro area (Orlando, FL). By February 2021, the
unemployment rate in Las Vegas had fallen to 9.3%, though remained higher than the U.S. average
(6.6%) and all peer metro areas.7
8Prior to the Pandemic, Southern Nevada Had Rapidly Reduced Unemployment
Figure 5: Unemployment Rate among Peer Metropolitan Areas, by Year, 2011-2020. Source: Bureau of Labor Statistics,
Local Area Unemployment Statistics.
16%
14.7%
14% 13.2%
Las Vegas-Henderson-Paradise, NV
12% 11.3%
9.7%
10%
8.0%
8% 6.8%
5.8%
6% 5.2% 4.0%
4.7%
4%
2%
0%
2011 2012 2013 2014 2015 2016 2017 2018 2019 2020
Southern Nevada Target Industry Trends
In 2017, LVGEA undertook a target industry validation study to identify specific industries that have
the potential to grow significantly in Southern Nevada, compared to most other industries.8 These
industries, adapted from prior targets in the 2011 SRI-Brookings report,9 included the following:
Autonomous Systems Gaming, Tourism, and Conventions
Business Headquarters and Services Health Care Services and Medical
Education
Emerging Technology
Logistics, Manufacturing, and Supply
Finance, Banking, and Insurance
Chain Management
Since 2017, Southern Nevada has made progress in diversifying its economy by growing
employment in the above target industries. Certain industries—such as Emerging Technology (+89%)
and Logistics, Manufacturing, and Supply Chain Management (+61%)—have significantly grown their
share of total employment in Southern Nevada. Overall, between 2011 and 2017 employment in
these target industries grew by about 20%, though their overall share of total employment in the
region remained relatively flat (about 56%). For a more comprehensive examination of shifts in
Southern Nevada’s 2017 target industries, please see Table 12 in Appendix D.
In early 2021, LVGEA contracted SRI to revisit the existing target industries to determine if LVGEA
should pursue opportunities in new industries that were not captured in the current set of targets.
SRI’s study of new target industries found that while several of the existing target industries were
well-aligned with Southern Nevada’s capabilities and ambitions, there were emerging opportunities
that had not yet been identified. In addition to identifying these new targets, SRI identified a series of
component industries related to each target that can be used to monitor the composition of growth
more closely within each target industry.
910
By 2019, these new target industries represented slightly more than 33% of total employment in
Southern Nevada and, despite the pandemic, this number reached almost 35% in 2020 (see Table 2
below). While this share is smaller than the previous set of target industries, this is largely due to the
exclusion of gaming, tourism, and hospitality from the new target industries. Gaming, tourism, and
hospitality will continue to play a prominent role in the region’s economy due to the comparative
advantage Southern Nevada has in this industry over other regions of the United States. However,
the region will need to create programs and initiatives, such as workforce development partnerships,
that make Southern Nevada a competitive location for businesses in the new target industries.

Southern Nevada’s New Target Industries Represent an Increasing Share of the
Region’s Total Employment
Table 2: Changes in Target Industry Employment, 2011–2019. Source: Emsi.

                                                                                        2011          2019
                                                 2011            2019       Percent
              Target Industry                                                         Employment    Employment
                                               Employment      Employment   Change
                                                                                        Share         Share
Total Target Industries                          229,898         340,751    +48.2%       28.7%         33.2%
General & Advanced Manufacturing                  18,615          24,420    +31.2%       2.3%           2.4%
Business & Financial Services                    101,074         140,691    +39.2%       12.6%         13.7%
Creative Industries                               14,332          17,157    +19.7%       1.8%           1.7%
Clean Technologies                                14,981          21,352    +42.5%       1.9%           2.1%
Transportation & Logistics Technologies           16,529          33,822    +104.6%      2.1%           3.3%
Information & Communication Technologies          10,500          26,283    +150.3%      1.3%           2.6%
Healthcare Services                               53,866          77,025    +43.0%       6.7%           7.5%

Growth within each target industry is usually driven by a primary component industry. Between 2011
and 2019, growth in General & Advanced Manufacturing was driven by General Manufacturing
(+44%); by Management & Professional Services (+55%) in Business & Financial Services; by
Entertainers & Supporting Services (+24%) in Creative Industries; by HVAC & Plumbing Contractors
(+97%) in Clean Technologies; by Distribution & Warehousing (+165%) in Transportation & Logistics
Technologies; by ICT Professional Services (+232%) in Information & Communications Technologies;
and by General & Specialist Healthcare Services (+39%) in Healthcare Services. For a more detailed
discussion of trends within Southern Nevada’s new target industries, see Target Industry Validation
Study: Revisiting Southern Nevada’s Approach to Economic Diversification.10
The use of component industries within the new target industries allows LVGEA to track not only
employment dynamics within a target industry, but also wage variation between different component
industries within a target industry. Because employment growth is driven by employment changes in
higher- and lower-paying industries, it is important for the target industries to capture higher- and
lower-paying industries. Figure 6 below provides a range of average wages across Southern
Nevada’s new target industries. The range of each target industry is comprised of the average wages
for each industry’s component industries.

                                                       11
Wages Vary Significantly among Southern Nevada’s Target Industries
Figure 6: Range of Average Earnings for Southern Nevada's New Target Industries. Source: Emsi.
$180,000
$160,000
$140,000
$120,000
$100,000
$80,000
$60,000
$40,000
$20,000
$-
General & Business & Creative Clean Transportation Information & Healthcare
Advanced Financial Industries Technologies & Logistics Communication Services
Manufacturing Services Technologies Technologies
Methodological Note
Target industry estimates are based on analysis of employment and wage data as measured at
the 6-digit North American Industry Classification System (NAICS) level in the Emsi platform. Data
limitations place some qualifications on our conclusions. First, some industry sub-sectors are
common across multiple target industries. Summing employment figures across industries will
result in an overestimate of total target industry employment. As a result, sub-sectors that occur
in more than one industry have been listed only once in a single target industry, rather than
duplicated across several target industries. This minimizes overestimations in the data that may
show some target industries as larger than they are. Secondly, data are occasionally suppressed
at the detailed NAICS levels to avoid disclosure of sensitive information. Despite these
limitations, it remains feasible to evaluate employment and wage trends in the industries of
greatest interest to LVGEA.
Innovation and Entrepreneurship
Southern Nevada is known for its creative and entrepreneurial culture, but regional activity related to
innovation and high-technology business formation and growth is limited. Stakeholders and
policymakers have created new and exciting initiatives and institutions (discussed later in the SWOT
Analysis) to bolster the region’s innovation ecosystem, yet some indicators suggest that Southern
Nevada continues to experience a dearth of innovation resources and activity.
The University of Nevada, Las Vegas (UNLV) is Southern Nevada’s leading public research university
and, as such, is among the region’s most significant innovation assets. UNLV has roughly doubled its
level of research and development (R&D) performance over the last decade and has recently
achieved an R1 research university classification,11 indicative of rising academic research intensity.
12The distribution of UNLV’s R&D expenditures varies significantly from the average for all U.S. higher
educational institutions. Expenditures in life sciences R&D make up 26% of the total at UNLV,
considerably lower than the national average of 58%. In contrast, UNLV has a much higher R&D
concentration in fields outside of science and engineering (S&E): 25% of UNLV’s expenditures are in
non-S&E fields, over four times more than the average (Figure 7). Within these non-S&E fields, R&D
in business management and administration at UNLV is roughly on par with the national average,
and R&D in visual and performing arts is significantly higher, indicative of a close alignment with
Southern Nevada’s unique regional economy.12
Compared to the Average University, UNLV Concentrates R&D Less in Life
Sciences and Far More in Fields Outside of Science and Engineering
Figure 7: Percent Distribution of R&D Spending at UNLV and All U.S. Higher Education Institutions, 2018. Source: National
Center for Science and Engineering Statistics, Higher Education Research and Development Survey.
University of Nevada, Las Vegas
Life Sciences
Non-S&E Fields All U.S. Institutions
Engineering
Physical Sciences
Earth Sciences
Social Sciences
Computer and Information Sciences
Mathematics and Statistics
Other Sciences
Psychology
0% 10% 20% 30% 40% 50% 60% 70%
Despite UNLV’s increase in R&D expenditures, closer examination shows that institution research
and technology transfer activity remain comparatively low overall (Table 3). Relative to similarly sized
research universities in neighboring states, UNLV has vastly lower R&D expenditures, averaging
roughly $73 million per year in recent years.13 In terms of innovation outputs such as licenses,
invention disclosures, patents, and startup creation, the university also lags by a significant margin.
13UNLV Has Comparatively Low Annual R&D and Technology Transfer
Performance
Table 3. University R&D Activity and Outputs (Annual Averages 2013-18). Source: Association of University Technology
Managers (AUTM). Enrollment figures from U.S. Department of Education, National Center for Education Statistics, College
Navigator.
Total Gross
R&D Licenses Invention Patent Startups
University Enrollment Licensing
Expenditures Executed Disclosures Applications Formed
(Fall 2019) Income
University of
37,883 $698,893,916 40 $6,079,865 211 295 9
Colorado, Boulder
University of
44,577 $622,917,167 69 $2,465,818 222 110 12
Arizona
University of Utah 32,852 $419,918,490 63 $38,368,565 187 79 15
Colorado State
53,177 $330,575,644 31 $2,436,653 108 52 5
University
University of New
22,729 $236,548,565 13 $1,501,723 118 92 10
Mexico
University of
20,993 $99,305,432 3 $241,855 23 12 2
Nevada, Reno
University of
22,517 $77,484,049 232 $8,284,453 36 10 2
Oregon
University of
31,171 $73,392,667 7 $301,966 52 18 2
Nevada, Las Vegas
Note: AUTM data not available for all years for all institutions. Data for the University of Oregon for 2018 shows 1,146
licenses executed for that year, significantly inflating the university’s annual average for 2013-2018. Excluding the 2018
data, the University of Oregon shows an annual average of 49 licenses per year 2013-2017. Enrollment data for Colorado
State University include enrollment for Colorado State University, Pueblo; Colorado State University, Fort Collins; and
Colorado State University Global Campus.
Across a range of science and engineering (S&E) metrics, Nevada trails the vast majority of other
states, even when adjusting for the state’s relatively small population and economy. 14 Furthermore,
Nevada has not achieved significant progress in many of these indicators since the recession (Table
4). Nevada’s workforce has one of the lowest concentrations in S&E occupations, and the state’s
share of its young population acquiring S&E bachelor’s degrees, an indication of its workforce
pipeline for high-technology industry sectors, ranks 50th in the nation. The R&D intensity of the
state’s economy—R&D expenditures as a share of GDP—is also one of the country’s lowest. Nevada’s
small businesses attract comparatively little federal support through the Small Business Innovation
Research (SBIR) and Small Business Technology Transfer (STTR) programs. The region has
experienced recent growth in venture capital investment—an important funding source for technology
startups with high growth potential—and performs closer to the national average on this metric.
14Nevada Continues to Rank Low in Its Innovation Resources and Activity
Table 4. Nevada values and rankings for selected science and engineering indicators. Source: National Science Board.
2018. Science and Engineering Indicators 2018, State Indicators (NSB-2018-1).
2018
Indicator 2010 Rank (or most recent Rank
year)
S&E Bachelor’s Degrees Conferred per
8.50 50 12.78 50
1,000 Individuals 18–24 Years Old
S&E Occupations as a Percentage of All
2.41% 47 2.43% 44
Occupations
0.54%
R&D as a Percentage of GDP 0.76% 45 50
(2017)
Business R&D as a Percentage of Private 0.45%
0.65% 37 43
Industry Output (2017)
Average Annual SBIR and STTR Funding $44.39 $35.17
44 42
per $1 Million GDP (2010–12 avg) (2014–16 avg.)
Venture Capital Disbursed per $1 Million $469.53
$232.12 38 36
GDP (2017)
15Vision 2025
SWOT Analysis
A Comprehensive Economic Development
Strategy for Southern Nevada
Photo Courtesy of Tiomax80/Flickr
SWOT Analysis
The SWOT analysis examines Southern Nevada’s regional strengths, weaknesses, opportunities, and
threats (SWOT). The SWOT reviews the following elements:
Strengths are regional competitive advantages. They refer to what is satisfactory in the present and
are primarily internal.
Weaknesses are regional competitive disadvantages. They refer to what is currently unsatisfactory
and are primarily internal.
Opportunities are chances or occasions for regional improvement or progress. They refer to
emerging trends that present openings for growth and resilience and are primarily external.
Threats are chances or occasions for negative impacts on the region or regional decline. They refer
to emerging trends that present obstacles to growth and resilience and are primarily external.15
The SWOT analysis is designed to enable Southern Nevada to assess its current capabilities and
understand how to work with them in order to navigate future uncertainty. It is a critical part of the
CEDS as it illuminates regional vulnerabilities to economic and environmental shocks and helps
guide subsequent economic development strategy toward enhanced resiliency. The results of the
SWOT guide the subsequent Strategic Direction and Activities Plan of the CEDS.
The SWOT analysis synthesizes stakeholder interview and workshop input with a detailed review of
social, economic, education, industry, and environmental data relevant to the region’s economic
16future. Key findings of the SWOT are visualized on the following page. The Detailed SWOT Analysis,
which provides a comprehensive review of regional attributes and trends, is available in Appendix C.
17Vision 2025
Strategic Direction
& Action Plan
A Comprehensive Economic Development
Strategy for Southern Nevada
Photo Courtesy of Bert Kaufmann/Flickr
Strategic Direction & Activities Plan
The Strategic Direction and Activities Plan lay out an economic vision for Southern Nevada and
describes the means by which the region will achieve that vision. The Strategic Direction identifies
where stakeholders would like to be in the near- to mid-future, and the Activities Plan sets out how
they will work together to get there. This portion of the CEDS considers the regional assets and
external factors influencing Southern Nevada’s development examined in the Economic Assessment
and SWOT Analysis.
The Strategic Direction is composed of a vision, goals, and objectives. The vision describes a
desired future for Southern Nevada that reflects the collective aspirations of regional stakeholders. A
small set of broad goals is articulated, which, if achieved, will help Southern Nevada realize this
vision. Each goal is then disaggregated into specific, measurable objectives to be accomplished.
Community involvement is critical to the formation of a compelling and broadly shared vision. To that
end, interviews and stakeholder visioning sessions were held with representatives from dozens of
organizations across Southern Nevada. Stakeholder engagement revealed a range of aspirations
spanning economic competitiveness and diversification, workforce development, quality of life,
regional identity, and social connection. Accordingly, the goals of this CEDS relate to Southern
Nevada’s economic development understood broadly—supporting durable, long-term gains in the
18region’s economic and social well-being. In short, the goals and objectives of this CEDS aim to make
Southern Nevada the best place it can be for businesses and for communities. Additional
information on stakeholder engagement and participant comments is available in Appendix B.
The Activities Plan translates the content of the Strategic Direction into concrete steps to be taken
by Southern Nevada’s stakeholders in support of regional development goals. It describes the
specific activities to be performed and designates lead and supporting organizations responsible for
conducting these activities. Each activity has an approximate time frame for execution over a 5-year
period, as well as a rough indication of resources required to conduct the activity. Some activities
may require little to no additional resources, whereas others are conditional on new financial
commitments. This distinction should be noted when evaluating the implementation of the CEDS.
Resilience
The intense socioeconomic distress and high unemployment that Southern Nevada encountered
during the Great Recession demonstrated the region’s vulnerability to external shocks in stark terms.
Strengthening resilience—the ability to prevent, withstand, and quickly recover from shocks—should
be central to Southern Nevada’s economic strategy. Two important drivers of potential shocks
emerged from the SWOT. First is the loss of gaming- and tourism-derived income and government
revenue that can result from greater economic downturns, as consumers cut back on discretionary
spending and travel to destinations like Southern Nevada. Second is climate change, which is likely
to exacerbate regional water scarcity and fuel increasingly dangerous heatwaves. Many of the goals
and objectives presented in the Strategic Direction and Activities Plan are formulated to address
these threats.
Strategic Direction
Vision
Vision: Southern Nevada is a global center for enterprise, imagination, and new experience, driven
by innovation in entertainment, industry, and technology.
Crucial drivers of the region’s success will be a business-ready environment that fosters
entrepreneurship and continued progress toward a diversified economy with high-skill, high-wage
jobs. Success also requires that Southern Nevada offer residents quality education and flexible
opportunities to acquire new skills so they can meet the needs of the region’s industries and adapt
to an evolving labor market. Promotion of regional quality of life, increased availability of healthcare
services, and greater social engagement will help attract and retain the human capital required to
power the region’s economy. Enhanced connections in transportation, data, and business networks
will boost commerce and collaboration. Finally, a proactive mindset, coupled with bold and creative
approaches, will keep Southern Nevada resilient in the face of technological and environmental
change in the next decade and beyond.
Community Vision Components
Participants in stakeholder engagement exercises imagined what success looks like for Southern
Nevada. Each participant submitted his or her top three most important components of that vision of
success. The figure below visualizes the most common words across participant submissions (see
Appendix B for more details on stakeholder exercises).
19Figure 8. Top Stakeholder Vision Components.
Vision 2025 Activities Plan
Goal 1: Promote a Resilient & Diverse Economy
Nevada remains one of the most pro-business states in the Mountain West, and local governments
and organizations in Southern Nevada have consistently demonstrated a willingness to work with
businesses interested in relocating to the region. Despite the pandemic, a “can-do” business-ready
environment with streamlined government and light-touch regulations and taxes will preserve the
region’s attractiveness to employers and maintain its entrepreneurial spirit. Southern Nevada’s small
businesses and entrepreneurs will help fuel the region’s recovery, and the relocation of larger
companies to the region can provide employment opportunities for workers in target industries.
Recruitment should focus on sectors that enhance the region’s economic diversity and build
resiliency against external shocks and economic downturns. Policies and programs should prioritize
job gains in new target industries that build valuable skills and pay higher wages to create a more
diverse and resilient economy. A more qualified regional workforce (see Goal 5) will ensure that a
greater share of regional residents is able to fill these new jobs, rather than industry relying on labor
recruited from outside the region.
Below are a series of objectives and activities that should be pursued by LVGEA and affiliated
stakeholders to achieve the mission of Goal 1. Note that activities in italics are those identified by
LVGEA as unfunded or underfunded as of July 2021.
Objective 1.1. Accelerate the growth of high-skill, high-wage jobs.
Assess upstream and downstream technology trends and adoption in the gaming
and hospitality industry and attract high-tech firms in other target sectors that LVGEA
can fill technology demands in this anchor industry.
20Monitor trends in Southern Nevada’s target industries and redefine targets as
LVGEA
new industry clusters and economic development opportunities emerge.
Research potential economy-wide shifts and disruptions driven by new
LVGEA
technology and identify vulnerable sectors and occupations.
Objective 1.2. Encourage a business-ready environment that enables entrepreneurship.
Conduct a survey of regional small- and medium-sized enterprises to identify LVGEA,
issues that entrepreneurs face when starting, maintaining, and growing their Chambers of
businesses (e.g., permitting, regulatory, tax, infrastructure, zoning, and land use). Commerce
LVGEA,
Facilitate the development of partnership programs that educate Southern Chambers of
Nevadans about the potential of entrepreneurship. Commerce,
SBDC
LVGEA,
Support the preservation of Nevada’s pro-business advantages relative to higher
Chambers of
cost regional competitors.
Commerce
Support the retention and expansion of community banks in Southern Nevada,
LVGEA
providing a critical funding resource to the region’s entrepreneurs.
Objective 1.3. Support the growth of existing Nevada businesses and help them expand within
and beyond the region.
LVGEA, Cities,
Assist existing Southern Nevadan businesses in reaching new markets by
Clark County,
connecting them to resources (e.g., financial, professional, etc.) and
Chambers of
decisionmakers.
Commerce
Continue to provide events, resources, and networking opportunities for LVGEA,
Southern Nevadan firms to make business connections and form new Chambers of
partnerships. Commerce
Increase utilization of Southern Nevada’s foreign trade zone through expanded
LVGEA
freight rail integration with regional firms.
Provide economic forecasting and market trend identification to help companies
LVGEA
prepare for upcoming opportunities.
Implement regional business retention and expansion program (BizCONNECT) to
LVGEA, Cities,
connect businesses with available resources and identify business satisfaction
Clark County
levels, growth opportunities, and barriers.
Objective 1.4. Ensure sufficient land, infrastructure, and resources are available for new
development in Southern Nevada.
21Clark County,
Continue to work with local, state, and federal lawmakers to identify land parcels Cities, GOED,
for potential future development. LVGEA,
NAIOP, SIOR
Execute a feasibility study for the Jean Industrial Complex to determine the best
development opportunities for this area (e.g., advanced manufacturing, logistics) LVGEA
and the necessary infrastructure.
Collaborate with city and county leaders in developing an infill strategy Clark County
(residential and commercial) for Southern Nevada. OCED, Cities
NV Energy,
Deploy clean technology-related infrastructure, including expanded access to
RTC, Cities,
electric vehicle charging stations and industry-specific clean energy solutions.
County
Coordinate with city and county agencies to integrate transportation and land
RTC, Cities,
use planning through transit-oriented development to enhance access, promote
County
housing diversity, and increase economic development
Objective 1.5. Promote and coordinate access to federal, state, and local economic recovery
programs and services.
LVGEA,
Maintain and update the Business Information Network (BIN) as needed. Chambers of
Commerce
LVGEA,
Provide marketing support and/or events to raise awareness of COVID-19 Chambers of
business recovery resources and programs. Commerce,
Cities
Objective 1.6. Increase Southern Nevada’s appeal to young families and professionals.
Gauge unmet needs for local family-friendly attractions that would increase
attraction and retention of families (for example, through surveys and focus LVGEA
groups).
LVGEA,
Provide community welcome and engagement resources to new residents,
Chambers of
especially young professionals.
Commerce
Continue to conduct the “Here You Can” initiative and advertise Southern
LVGEA
Nevada as a desirable location for businesses and place to live for families.
Expand the “Here You Can” initiative to promote Las Vegas’s quality of life
LVGEA
attributes to outside talent.
22Goal 2: Connect People, Businesses, & Ideas
Connections—physical, digital, and social—sustain Southern Nevada’s economic dynamism, and the
COVID-19 pandemic has highlighted the value of these connections to the region’s communities.
Further developing the region’s physical infrastructure, such as by swiftly building out 5G networks
and closing its remaining digital divides, will enable Las Vegas to claim a leadership position as the
data capital of the Mountain West. The region has many strengths in physical infrastructure and road
networks, but limited commuting options outside of personal auto transport will hamper its growth.
New transportation connections between key tourist and business destinations will further expand
the region’s capacity for commerce and deliver a more attractive experience for visitors.
Strengthening institutional infrastructure—such as business collaboration frameworks or
entrepreneurship funding networks—will foster new connections, creative partnerships, and
entrepreneurial collaborations.
Below are a series of objectives and activities that should be pursued by LVGEA and affiliated
stakeholders to achieve the mission of Goal 2. Note that activities in italics are those identified by
LVGEA as unfunded or underfunded as of July 2021.
Objective 2.1. Become the Data Capital of the Mountain West through expansions in 5G
infrastructure, ICT businesses, and broadband access.
Internet
Close the remaining digital divides in Southern Nevada by increasing internet service
access for underserved populations and enabling broader participation in the providers,
region’s digital economy. Cities, Clark
County
Pursue opportunities to recruit information and communication technology
companies to Southern Nevada at major information and communication LVGEA
technology events.
Boost collaboration between resorts, technology companies, and researchers to UNLV
accelerate development and deployment of innovations in gaming and Economic
hospitality. Development
Internet
Build out 5G networks to improve the speed and reliability of regional data
Service
connections.
Providers
Objective 2.2. Encourage effective business collaborations, including partnerships between
startups and established, larger businesses.
LVGEA,
Chambers of
Develop “buy local” supply chain strategies to connect area small businesses
Commerce,
with resorts.
Cities, Clark
County
23You can also read