Visual working memory and sensory processing in autistic children
←
→
Page content transcription
If your browser does not render page correctly, please read the page content below
www.nature.com/scientificreports
OPEN Visual working memory
and sensory processing in autistic
children
Ryan A. Stevenson1,2,3,4,5*, Justin Ruppel6, Sol Z. Sun6, Magali Segers1,7,
Busisiwe L. Zapparoli7, James M. Bebko7, Morgan D. Barense6,8 & Susanne Ferber6,8
While atypical sensory processing is one of the more ubiquitous symptoms in autism spectrum
disorder, the exact nature of these sensory issues remains unclear, with different studies showing
either enhanced or deficient sensory processing. Using a well-established continuous cued-recall task
that assesses visual working memory, the current study provides novel evidence reconciling these
apparently discrepant findings. Autistic children exhibited perceptual advantages in both likelihood
of recall and recall precision relative to their typically-developed peers. When autistic children did
make errors, however, they showed a higher probability of erroneously binding a given colour with
the incorrect spatial location. These data align with neural-architecture models for feature binding in
visual working memory, suggesting that atypical population-level neural noise in the report dimension
(colour) and cue dimension (spatial location) may drive both the increase in probability of recall
and precision of colour recall as well as the increase in proportion of binding errors when making an
error, respectively. These changes are likely to impact core symptomatology associated with autism,
as perceptual binding and working memory play significant roles in higher-order tasks, such as
communication.
The rising prevalence of autism spectrum disorder (ASD) to 1 in every 59 births1 and the rising global cost of
care2 necessitate a better understanding of the etiology and associated heterogeneous symptomology of the
condition. Historically, theories explaining ASD focus on disturbances in high-level cognitive functioning such
as theory of mind3, weak central c oherence4, or executive d ysfunction5. More recent accounts, however, have
focused on low-level, underlying neurobiological differences that unfold throughout development and cascade
into social and cognitive challenges. These include changes in excitation and inhibition spurred by imbalances in
GABAergic and glutamatergic synapses6, irregular temporal fidelity of neuronal coupling7, or deficits in Bayesian
statistical learning8. These accounts share a common link in providing explanations for atypical sensory percep-
tion in autism9, which have been both theorized to10,11 and empirically shown to impact s ymptomatology12.
Sensory issues are nearly ubiquitous in ASD, affecting up to 94% of autistic individuals13. Atypical sensory
perception impacts core diagnostic criteria, including social communication and restricted interests and repeti-
tive behaviors14. Although sensory issues are commonly discussed as an impairment, there are also areas where
autistic individuals outperform their typically-developed (TD) peers15. Thus, a complete account of sensory issues
in autism must explain not only the observed weaknesses, but also the areas of enhanced performance. To this
aim, we employed a well-characterized continuous cued-recall t ask16,17 to study the strengths and weaknesses of
maintaining sensory representations in visual working memory (VWM), a mental workspace to connect inputs
with higher-order cognition18. Participants study a varying number of coloured squares (set size; 2–3 in the cur-
rent study) in discrete locations and after a brief delay, they report the remembered color of a randomly cued
square, indicated by a location probe (i.e., “what colour did you study in this location previously?”). This response
is made by selecting the remembered colour from a continuous colour wheel, allowing for the measurement
of not only VWM capacity, but also of recall precision, and perceptual binding of colour and location. Autistic
individuals often exhibit enhanced visual perceptual abilities on simple visual tasks, such as change detection,
1
Department of Psychology, University of Western Ontario, Western Interdisciplinary Research Building, 1151
Richmond Street, London, ON N6G 2K3, Canada. 2Brain and Mind Institute, University of Western Ontario, London,
ON, Canada. 3Department of Psychiatry, Schulich School of Medicine and Dentistry, University of Western Ontario,
London, ON, Canada. 4Schulich School of Medicine and Dentistry, Neuroscience Program, University of Western
Ontario, London, ON, Canada. 5Centre for Vision Research, York University, Toronto, ON, Canada. 6Department
of Psychology, University of Toronto, Toronto, ON, Canada. 7Department of Psychology, York University, Toronto,
ON, Canada. 8Rotman Research Institute, Toronto, ON, Canada. *email: rsteve28@uwo.ca
Scientific Reports | (2021) 11:3648 | https://doi.org/10.1038/s41598-021-82777-1 1
Vol.:(0123456789)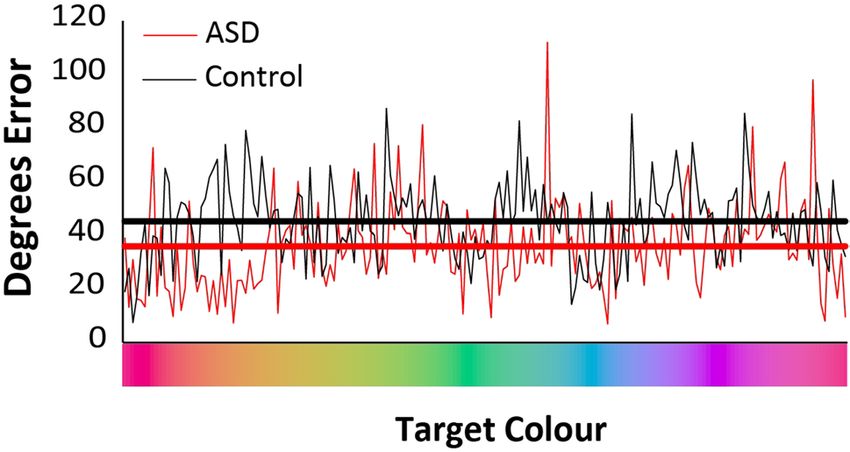
www.nature.com/scientificreports/
Figure 1. Trial composition. This panel depicts an individual trial (set size = 3). Responses were analyzed with
a probabilistic mixture model in which the degree of error between the chosen colour and the actual presented
colour is calculated and tabulated across trials.
colour discrimination, and simple visual search tasks for review, see19. In the VWM colour wheel task, the preci-
sion of an individual’s response (i.e., how closely individuals recall the exact studied color) would tap into this
strength. Therefore, we predicted that autistic individuals would exhibit greater VWM precision than their TD
peers and may, overall, show fewer errors.
When an error is made, however, the VWM colour-wheel task affords us with the possibility to determine the
origin of such errors, forgetting the studied colour or misbinding a studied colour with the incorrect location.
Autistic individuals have difficulties binding sensory information into a unified percept20–22: they are less suscep-
tible to visual illusions that require integration of multiple component features23, and show reduced benefits of
binding a speaker’s face with their v oice24–27. In a colour-wheel VWM task, these binding errors would result in
recalling a colour that was presented at a non-target location. We predicted that when errors are made, autistic
individuals would be more likely to make binding errors than their TD peers. Therefore, this task allows us to
simultaneously observe strengths and weaknesses in sensory processing in the same individuals while keeping
the task demands unaltered.
Methods
Participants. Participants included 51 children (mean age = 12.0 ± 2.8 years) split into two groups, TD and
ASD. TD children (N = 30, 8 males, age range 7–16 years old, mean age = 11 years old) had neither an individual
or familial diagnosis of ASD, nor any other neurological condition. Autistic participants (N = 21, 17 males, age
range 8–17 years old, mean age = 13 years old) had a formal ASD diagnosis by a clinical practitioner familiar with
ASD and provided their clinical report. Diagnoses were confirmed through the administration of the Autism
Diagnostic Observation Schedule (ADOS-1 or -228) by a research-reliable clinician. To ensure that TD partici-
pants were not on the autism spectrum, and to assess symptom severity in ASD, the Autism Quotient (AQ29)
and Social Responsiveness Scale (SRS30) were administered to all participants. The AQ was scored using Likert
scoring31, with the TD group scoring significantly lower than the ASD group (TD mean score = 51.3 ± 13.9,
ASD mean score = 95.3 ± 15.7, p = 8.00e−14, t(49) = 10.28, d = 2.39). Likewise on the SRS, the TD group scored sig-
nificantly lower than the ASD group (TD mean score = 51.0 ± 8.9; ASD mean score = 75.7 ± 11.6, p = 9.62e−10,
t(49) = 7.54, d = 2.39). Note that a score of 76 and above on the SRS is considered severe, a score between 60 and 75
is considered indicative of so-called “high-functioning” ASD in those with a diagnosis, and 59 or below is con-
sidered asymptomatic. Cognitive abilities were measured using the Weschler Abbreviated Scale of Intelligence
(WASI-232) 2-scale subtest. TD participants’ scores did not significantly differ from those of ASD participants
(TD mean = 102.9 ± 10.8, ASD mean = 107.4 ± 14.9, p = 0.23, t(49) = 1.59, d = 0.34).
All protocols were approved by the research ethics board at the University of Toronto, and all experiments
were performed in accordance with relevant guidelines and regulations. Informed consent was obtained from
a parent and/or legal guardian. Participants were compensated monetarily for their time and with a small gift.
Apparatus. Participants were seated in front of a 15-inch laptop screen at a distance of approximately 60 cm.
The screen resolution was 1280 × 960 pixels and the refresh rate was 60 Hz. Stimuli were generated and presented
using MATLAB (Natick, MA) and the Psychophysics Toolbox 3 extensions33–35.
Stimuli and procedure. Stimuli and task design were based on Zhang and Luck16 but adapted to be more
suitable for a younger age group. Each trial started with a 100 ms long presentation of coloured squares as
memory samples, with set sizes of either 2 or 3, around a black fixation cross (1.0° × 1.0° visual angle) on a gray
background. The to-be-remembered coloured squares (henceforth, sample items) were 1.2° by 1.2° in size and
could be located at 18 possible locations arranged around a virtual circle with a radius of 5.6° (Fig. 1). Partici-
pants were instructed to remember as many of the sample items as possible.
Sample item colours were selected from 180 possible colours, evenly distributed along an isoluminant colour
wheel (centered at (L = 65 a = 5 b = 5) in the CIEL*a*b* colour space The colours of all sample items on a given
trial were randomly chosen without replacement from these 180 colours, with the constraint that two samples
colours must be separated by a minimum 15 values (i.e., 40°) in colour space to ensure discriminability.
Scientific Reports | (2021) 11:3648 | https://doi.org/10.1038/s41598-021-82777-1 2
Vol:.(1234567890)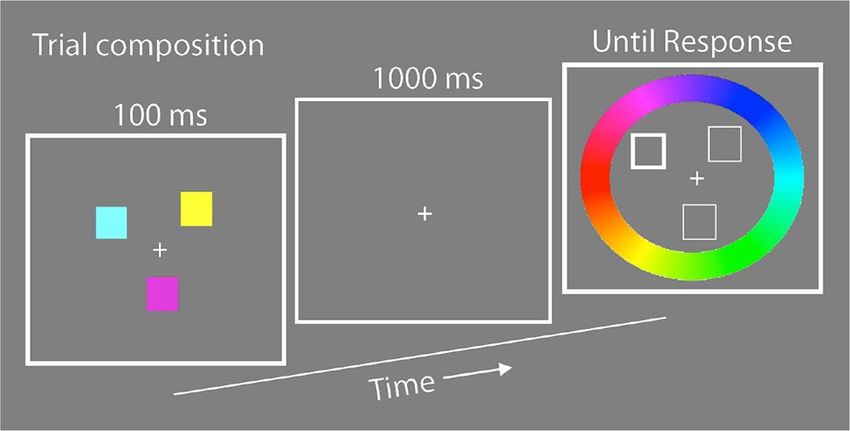
www.nature.com/scientificreports/
After a 1000-ms delay screen containing only the fixation cross, the test screen was presented. The locations of
the sample items were outlined in black (with no colour fill except the gray background), and the to-be-reported
target item’s location bolded to distinguish it from the non-target locations (4 pixel weight for non-targets items, 8
pixel weight for the target item). The test screen also contained a visual presentation of the colour wheel described
above, arranged on an annulus with an inner radius of 7.6° and an outer radius of 10.1° The luminance of all
possible stimulus colours remained constant and independent of hue.
During the test screen phase, participants used the computer mouse to select the remembered colour of the
target square by clicking the location on the colour wheel that most precisely corresponded with the remembered
colour of the target item. To facilitate visualization of the chosen colour, when the participant selected a colour
from the colour wheel, the target location’s outline was filled with the selected color. Emphasis was placed on
precision, and participants were given unlimited time to change and adjust their selection until they were satisfied
with their choice. The participants pressed the keyboard space bar when they felt ready to lock in their response
and would then advance to the next trial following a 500 ms inter-trial interval. Participants were instructed to
avoid selecting non-target colours and instead to guess a random colour if they could not recall the target item.
Participants completed 80 trials in total, with 40 trials per set-size condition interleaved within a single block.
Prior to data collection, participants completed 10 practice trials to ensure that they understood the task and
were completing it properly.
Analysis. Behavioural data analysis was based on the method outlined by Bays et al. 2008 http://www.baysl
ab.com17. Stimulus colours and participant responses were coded in circular units (from π radians to -π radians),
and recall error was calculated as the angular deviation between the actual target colour and the colour selected
by the participant.
To investigate participants’ VWM, we employed a probabilistic mixture model developed by Bays et al.36.
The model assumes that three memory states account for the distribution of responses in a VWM task: recalling
the target, recalling a non-target, or recalling nothing from memory which will result in guessing. When the
participant can recall the target colour, measured as the probability to recall the target, or pMem, target responses
are assumed to be normally distributed around the target colour using a circular analogue of the Gaussian
distribution, the von Mises distribution. For instances in which the participant retrieves a non-target colour,
measured as the probability to recall the non-target, pNT or binding error, each pNT response is also assumed
to be distributed around a non-target colour using a von Mises distributions. Finally, the participant may not
be able to access the target at all and has to guess randomly, measured as the probability of guesses, pGuess, a
uniform distribution around the circle. It should be noted here that pGuess is equal to 1 − (pMem + pNT) and is
not considered a parameter itself, thus the parameters pMem and pNT determine the probability of any of the
three memory states, all of which must sum to 1.
In addition, the precision parameter reflects the fidelity or resolution with which the colour has been repre-
sented in memory, when colour can be retrieved (pMem). Recall precision was calculated as the reciprocal of the
standard deviation of the recall error (using Fisher’s definition of circular standard deviation). Recall precision
assesses the degree to which responses cluster around the original target colour (i.e., higher precision scores
indicate the participant’s responses cluster more narrowly around the target colour, suggesting more precise
responses). It is assumed that the von Mises distribution around target and non-targets are assumed to have the
same precision.
Maximum likelihood estimates of the three aforementioned parameters, pMem, pNT, and precision, were
separately obtained for each participant and each set-size using an expectation–maximization algorithm. The
three memory states defined by these parameters will henceforth be referred to as memory (pMem), binding
errors (pNT), and guesses (pGuess), respectively. Model parameter estimation was performed with a range of
initial parameter estimates to ensure global maxima were achieved.
Differences between diagnostic groups and set sizes were subsequently tested using a mixed-model analysis of
variance (ANOVA) and follow-up t-tests in the parameter values pMem, recall precision, pNT, and pGuess. Also,
given significant differences in pMem between groups, the proportion of binding errors relative to all errors, or
pNT Error = pNT/(pNT + pGuess)
were calculated to account for differences in total number of errors, then compared. The proportion of guesses rel-
ative to total errors is equal to one minus pNT|Error, thus independent analysis is redundant. Greenhouse–Geis-
ser corrections were applied whenever the sphericity assumption of the ANOVA was violated.
Symptom severity in the ASD group was calculated as the weighted sum of the SRS and AQ measures:
AQscore SRSscore
AQmax + SRSmax
Symptom Severity = ,
2
where AQmax and SRSmax represent the maximum score on each measure, resulting in a range of symptom severity
from 0 (least severe) to 1 (most severe). The relationship between pMem, precision, and pNT|Error on symptom
severity was analyzed via multiple regression.
Results
Analysis of target responses: probability of recall (pMem) and precision. We first measured the
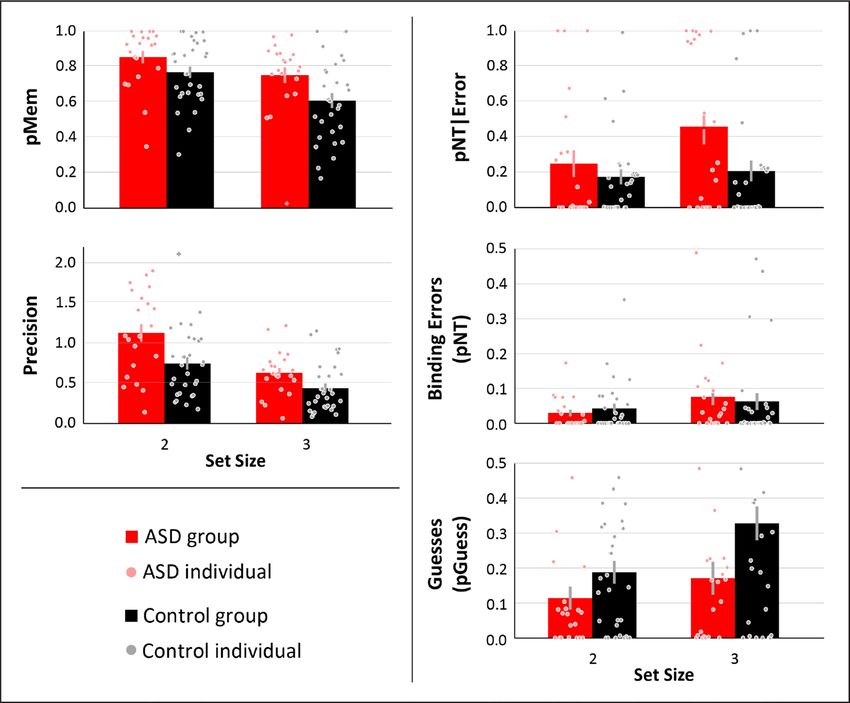
probability of participants recalling the target colour, or pMem. In the ASD group, pMem was 0.86 (SE = 0.04) for
the set size two and 0.75 (SE = 0.05) for set size three (Fig. 2, top). In the TD group, pMem was 0.77 (SE = 0.03)
and 0.61 (SE = 0.03) with a set size of two and three, respectively. A 2 × 2 mixed-model ANOVA (group x set
Scientific Reports | (2021) 11:3648 | https://doi.org/10.1038/s41598-021-82777-1 3
Vol.:(0123456789)www.nature.com/scientificreports/
Figure 2. Results. Autistic individuals exhibited increases in their likelihood to remember the target and the
precision of their responses, but also an increased NT|Error. Bars represent group averages, circles represent
individuals’ data, with crosses representing outliers. Error bars represent standard error of the mean.
size) with pMem as the dependent variable revealed a significant main effect of set size, with the set size of
two having a higher pMem than the set size of 3 (F(1,49) = 23.54, p < 0.001, ηp2 = 0.33). Furthermore, there was
a significant main effect of diagnostic group, with pMem being higher in the ASD group than the TD group
(F(1,49) = 5.19, p = 0.03, ηp2 = 0.10). There was no significant interaction between set size and group ( F(1,49) = 1.08,
p = 0.30, ηp2 = 0.02).
Precision was also estimated, which reflects the fidelity or resolution with which the colour has been rep-
resented in memory, when colour can be retrieved. Precision in the ASD group was 1.13 (SE = 0.12) and 0.63
(SE = 0.06) for set sizes two and three, respectively (Fig. 2, middle). In the TD group, precision was 0.75 (SE = 0.08)
and 0.44 (SE = 0.06) for set sizes two and three, respectively. A 2 × 2 mixed-factor ANOVA (group x set size)
revealed a significant main effect of set size with higher precision at a set size of two, relative to three, items
(F(1,49) = 64.97, p < 0.001, ηp2 = 0.57). Furthermore, there was a significant main effect of diagnostic group, with
the ASD group exhibiting higher precision than the TD group ( F(1,49) = 7.99, p = 0.007, ηp2 = 0.14). Finally, there
was a non-significant trend towards a group by set size interaction; the precision benefit for the ASD group was
marginally higher at set size 2 relative to set size 3 (F(1,49) = 3.62, p = 0.07, ηp2 = 0.07). The average error with each
presented target colour was also calculated to determine whether precision varied across the colour spectrum
in a meaningful, patterned way, and did not (Fig. 3).
Analysis of error responses: binding errors (pNT) and guesses. When the target was not recalled,
two types of errors were possible: specifically, binding errors (pNT) and guesses. Binding errors occur when a
participant recalls the non-target colour, and guesses occur when the participant reports a colour that was not
presented. To explore the nature of these errors, we estimated the frequency of each type of error, then compared
across groups and between conditions in two ways, first accounting for group differences in frequency of errors
using pNT|Error, followed by examining values of binding errors and guesses without accounting for the differ-
ence in pMem, to examine what drove effects found in the initial analysis.
As reported above, pMem in the ASD group was significantly larger relative to the TD group. This means
that the magnitude of binding errors and guesses will, by necessity, be lower in the ASD group. Therefore, we
calculated the proportion of binding errors relative to total errors, pNT|Error, and subjected those to a 2 × 2
Scientific Reports | (2021) 11:3648 | https://doi.org/10.1038/s41598-021-82777-1 4
Vol:.(1234567890)www.nature.com/scientificreports/
Figure 3. Error by individual colour. Autistic individuals’ higher precision than controls can be seen in their
lower average error than controls (heavy lines). No meaningful pattern of error by individual colours was
observed (light lines).
(diagnostic group x set size), mixed-model ANOVA (Fig. 2, top right). A significant main effect of set size was
observed, with pNT|Error higher with a set size of three relative to two items ( F(1,49) = 4.20, p = 0.04, ηp2 = 0.08).
Critically, a main effect of diagnostic group was also observed, with the ASD group exhibiting higher pNT|Error
than the TD group (F(1,49) = 4.22, p < 0.04, ηp2 = 0.08). No significant group by set size interaction was observed
(F(1,49) = 2.19, p < 0.15, ηp2 = 0.04).
To examine what drove this effect, we examined measures of binding errors and guesses not accounting for
differences in pMem. Binding errors in the ASD group were 0.03 (SE = 0.04) and 0.08 (SE = 0.11) for set sizes
two and three, respectively (Fig. 2, middle right). In the TD group, binding errors were 0.04 (SE = 0.08) and 0.06
(SE = 0.13) for set sizes two and three, respectively. A 2 × 2 mixed-factor ANOVA (group x set size) revealed
a marginally significant main effect of set size with higher binding errors at a set size of three, relative to two,
items (F(1,49) = 9.24, p = 0.004, ηp2 = 0.16). There was not a significant main effect of diagnostic group with binding
errors (F(1,49) < 0.01, p = 0.99, ηp2 < 0.01). There was not a significant group by set size interaction ( F(1,49) = 0.58,
p = 0.45, ηp2 = 0.01).
Guesses in the ASD group were 0.11 (SE = 0.03) and 0.17 (SE = 0.05) for set sizes two and three, respectively
(Fig. 2, bottom right). In the TD group, guesses were 0.19 (SE = 0.03) and 0.33 (SE = 0.05) for set sizes two and
three, respectively. A 2 × 2 mixed-factor ANOVA (group x set size) revealed a significant main effect of set size
with higher rate of guessing at a set size of two, relative to three, items (F(1,49) = 9.24, p = 0.004, ηp2 = 0.16). Further-
more, there was a significant main effect of diagnostic group, with the ASD group exhibiting fewer guesses than
the TD group (F(1,49) = 5.03, p = 0.03, ηp2 = 0.09). Finally, there was a no significant group by set size interaction
(F(1,49) = 1.65, p = 0.21, ηp2 = 0.03).
Given that the TD group exhibited significantly more guesses that the ASD group, it is possible that the
increase in pNT|Error was driven by an increase in attentional lapses or failure to encode for other extraneous
reasons. We conducted post hoc t-tests to examine this possibility in more detail. No significant difference was
found between the ASD and TD group with a set size of two (t(49) = 1.52, p = 0.14, d = 0.43), but a significant dif-
ference was observed with a set size of three ( t(49) = 2.21, p = 0.03, d = 0.63). No significant difference was found
in guesses between set sizes in the ASD group (t(20) = 1.94, p = 0.07, d = 0.42), but a significant increase in guesses
was observed from set size 2 to 3 in the TD group ( t(29) = 2.80, p = 0.009, d = 0.51).
Relation to clinical symptomatology. Within the ASD group, multiple regression was used to deter-
mine if pMem, precision, or binding errors were associated with symptom severity, as assessed with the SRS and
AQ (mean = 0.76, range = 0.57–0.90 of a possible 0–1). The overall model was significant (R2 = 0.46, F(3,17) = 4.90,
p = 0.01), with pMem being the strongest predictor (t = -3.07, rpartial = -0.60, p = 0.007). However, pMem and pre-
cision were multicollinear ( r20 = 0.84, 95% CI = [0.64 to 0.55], VIF = 3.35, p = 0.0004). For thoroughness, it should
be noted that binding errors were not related to either pMem (r20 = 0.01, 95% CI = [-0.42 to 0.44], p = 0.96) or pre-
cision (r20 = 0.32, 95% CI = [-0.12 to 0.66], p = 0.16). Given the multicollinearity, precision was removed from the
model, and a second multiple regression was conducted using pMem and pNT|Error to predict symptom sever-
ity. The overall model remained significant (R2 = 0.40, F(2,18) = 6.00, p = 0.01), with pMem (t = -3.46, rpartial = -0.63,
p = 0.003) but not pNT|Error (t(20) = 1.28, rpartial = 0.29, p = 0.22) significantly predicting symptom severity.
Sex differences. Given the differences in sex distribution across groups, sex differences were explored. No
significant differences were found between males and females in pertinent variables at either set size (2 and 3,
respectively), including pMem (t(49) = 1.15, p = 0.11, d = 0.32; t(49) = 0.23, p = 0.90, d = 0.06), precision (t(49) = 0.81,
p = 0.59, d = 0.23; t(49) = 0.55, p = 0.34, d = 0.15), binding errors ( t(49) = 1.44, p = 0.07, d = 0.40; t(49) = 1.52, p = 0.07,
d = 0.42), pNT|Error (t(49) = 0.55, p = 0.48, d = 0.15; t(49) = 0.88, p = 0.14, d = 0.25), or guesses ( t(49) = 0.66, p = 0.18,
d = 0.; t(49) = 0.50, p = 0.85, d = 0.14).
Scientific Reports | (2021) 11:3648 | https://doi.org/10.1038/s41598-021-82777-1 5
Vol.:(0123456789)www.nature.com/scientificreports/
Discussion
Through the use of a well-established VWM continuous cued-recall task, this study provided novel evidence
reconciling two apparently discrepant findings relating to sensory processing in autism. That is, both enhanced
and impaired sensory processing in autism have been shown with almost equal frequency for review, see14,19.
Typically, these differences have been shown across distinct tasks37 and stimulus t ypes38, with enhanced percep-
tion commonly found with simple stimuli and detail-oriented tasks and impaired perception commonly seen
with more complex stimuli and globally-oriented tasks. Results from the current study, for the first time, indicate
enhanced sensory processing in both accuracy and precision of sensory recall, yet increased binding errors when
errors are made: distinct aspects of sensory processing using the same task, stimuli, and individuals.
The Enhanced Perceptual Functioning (EPF) model of sensory processing in autism proposes that autis-
tic individuals prioritize the perception of low-level sensory information relative to higher-level perceptual
operations15,19,39. This difference in processing has been hypothesized to lead to both enhancements in perceptual
abilities (e.g., enhanced pitch memory40 and visual discrimination41), but differential abilities at higher levels of
perception (e.g., biological motion perception42)—a combination of perceptual effects commonly referred to as
a difference in local–global bias. This account has typically been described through comparing performances
across different cognitive tasks or stimuli. For example, when processing composite letters, autistic individuals
show a bias towards over-representation of the smaller, component letters relative to their TD peers, but this
effect disappears when specifically asked to attend to the larger, global letters37. Thus, it has been postulated that
deficits in more global, integrative sensory processing may result from a difference in default perceptual style,
with a tendency to focus on the detailed aspects of any given sensory input. The current results expand on this
finding, however, suggesting that findings of perceptual enhancements and differences in autism are not specifi-
cally task-reliant but instead process-reliant, as can be observed simultaneously in a single paradigm.
Autistic children exhibited specific perceptual advantages in their ability to recall visual representations (as
measured by pMem), and additionally, the precision of those representations was of higher fidelity then their TD
peers. That is, when correctly remembering a colour in a specific location, autistic children’s ability to recall the
exact hue of the colour was greater. Interestingly, recent computational work has suggested that both precision
and pMem may be accounted for by a single factor of memory strength, or s ensitivity43—and explanation that
is parsimonious with the current data given the strong relationship between pMem and precision. Interestingly,
the perceptual advantage of increased likelihood of recall significantly was predictive of clinical symptom sever-
ity as assessed through the Social Responsiveness Scale and the Autism-spectrum Quotient. This relationship
between levels of autistic traits and performance in a VWM task provides convergent evidence that atypical
sensory processing may contribute to clinical symptomatology for review, s ee14.
The analysis of concurrent error types was more equivocal, with multiple possible interpretations. When
examining binding errors relative to the total proportion of errors committed (pNT|Error), autistic participants
committed a higher proportion of binding errors; they incorrectly perceptually bound a presented colour with
the wrong spatial location. In conjunction with the observed increase in precision, this would suggest that the
perceptual representation of colour is being maintained with high fidelity. Further, given the higher level of pMem
in ASD relative to controls, this suggests that autistic individuals broadly have the capacity to bind colour and
space. However, the autistic group showed a higher proportion of binging errors relative to the total number of
errors than the control group. This finding is in line with previous research, which has reliably demonstrated that
autistic individuals exhibit atypical integration of individual pieces of information to form a coherent Gestalt
percept20–22. This effect ranges from the perceptual processing of sensory stimuli such as a speaker’s face and
voice24–27 to higher-level cognitive representations, such integrating content of a story into a global narrative44.
The above hypothesis of atypical binding reflects the rate of binding errors when an error is committed. This
phenomenological finding has multiple possible alternative explanations at the mechanistic level. The increase
in pNT|Error in the autistic group was driven by a significantly higher rate of guesses in the control group, in
particular with a set size of three. Thus, alternatively to the above hypothesis, analysis of the binding errors with-
out accounting for group differences in pMem did not reveal group differences, leaving the possibility that there
a greater number of attentional lapses in the control group may also contribute to or drive this effect. Further,
if autistic children were inherently better at color than spatial attention (within ASD), or if autistic children
were better at colour memory than controls, this could result in performance in the autistic group to be biased
towards colour rather than space more so than the control group. Lastly, the autistic group may be more likely
to focus on the task, and, as a colour memory task, may have biased the autistic group more than the control
group towards attending to colour. Future studies in which the task was to remember the location will be able
to assess these alternate hypotheses.
How might we understand the present pattern of results from a neuro-computational perspective? Recent
computational models have proposed that both precision and binding errors in VWM can be explained through
decoding of noisy population neural activity45,46. Specifically, the model consists of populations of neurons,
which respond conjunctively to multiple feature dimensions (e.g., color, orientation, location). For example, a
given neuron in the model might respond most strongly to a specific hue of green, at a specific location, with
the firing rate decreasing as the presented hue (or location) deviates from the maximally preferred value. In this
way, the firing properties of each neuron can be represented as a multivariate Gaussian tuning function across
all feature dimensions of interest. During study, sample items are encoded and maintained through the firing
rate of the neural populations, which are determined by their respective tuning preferences. During recall, a
decoder is applied to the pattern of population activity, ultimately selecting the most likely feature value, given
the cue. Thus, the imprecision of responses can arise from population neural noise across the target dimension
(e.g., colour), while binding errors arise from noise across the cue dimension (e.g., location). Applied to our data,
this model would suggest that autistic individuals represent sample items with lower levels of noise in the target
Scientific Reports | (2021) 11:3648 | https://doi.org/10.1038/s41598-021-82777-1 6
Vol:.(1234567890)www.nature.com/scientificreports/
dimension, but that higher levels of noise in the cue dimension result in an unreliable mapping of the location
cue to the correct color, thereby resulting in binding errors between colors and their locations. Indeed, autism
researchers have suggested that atypical behaviours and perceptions in autism may be linked to changes in the
variability, or noisiness, of neural response p atterns47–51.
Based on their work with healthy populations, Bays et al.45,46 also argue that in VWM recall tasks, non-
spatial features (e.g., color and orientation) are obligatorily bound to their associated locations, with no binding
between non-spatial features. Similarly, face perception research suggests that the healthy human visual system
automatically binds facial elements into an undifferentiated whole52. Given the deficits in holistic face percep-
tion in ASD53,54, along with group differences in binding deficits between a spatial and non-spatial feature when
accounting for differences in overall error rates reported here, an interesting prediction is that autistic individuals
might only show binding difficulties across features that are obligatorily integrated in the healthy visual system.
Additionally, integration of multiple types of sensory information, in this case spatial and colour information,
requires functional connectivity between multiple brain regions. However, research has demonstrated that autistic
individuals have decreased connectivity between brain regions in g eneral55,56, and within the dorsal visual stream
specifically57. Furthermore, autistic individuals show atypical activation, functional connectivity, and inter-region
neural synchronization in fronto-parietal networks during letter-based VMW tasks58 and in fronto-temporal
networks during face-based VWM t asks59. Coupled with the current findings, these studies lend support to the
claim of the EFT model suggesting that improved processing of individual aspects of sensory inputs may come
with a cost, in this case including higher levels of binding errors relative to all errors during VWM. These changes
are likely to directly impact core symptomatology associated with autism, as perceptual b inding60 and working
61
memory, including V WM , play significant roles in communication.
Received: 1 April 2020; Accepted: 28 December 2020
References
1. Abrams, D. A. et al. Underconnectivity between voice-selective cortex and reward circuitry in children with autism. Proc. Natl.
Acad. Sci. USA 110, 12060–12065 (2013).
2. Leigh, J. P. & Du, J. Brief report: Forecasting the economic burden of autism in 2015 and 2025 in the United States. J. Autism Dev.
Disord. 45, 4135–4139 (2015).
3. Baron-Cohen, S., Leslie, A. M. & Frith, U. Does the autistic child have a “theory of mind”?. Cognition 21, 37–46 (1985).
4. Happe, F. Autism: Cognitive deficit or cognitive style?. Trends Cogn. Sci. 3, 216–222 (1999).
5. Ozonoff, S., Pennington, B. F. & Rogers, S. J. Executive function deficits in high-functioning autistic individuals: Relationship to
theory of mind. J. Child Psychol. Psychiatry 32, 1081–1105 (1991).
6. Rubenstein, J. L. & Merzenich, M. M. Model of autism: increased ratio of excitation/inhibition in key neural systems. Genes Brain
Behav. 2, 255–267 (2003).
7. Brock, J., Brown, C. C., Boucher, J. & Rippon, G. The temporal binding deficit hypothesis of autism. Dev. Psychopathol. 14, 209–224
(2002).
8. Pellicano, E. & Burr, D. When the world becomes ‘too real’: A Bayesian explanation of autistic perception. Trends Cogn. Sci. 16,
504–510 (2012).
9. Wallace, M. T., Woynaroski, T. G. & Stevenson, R. A. Multisensory integration as a window into orderly and disrupted cognition
and communication. Annu. Rev. Psychol. 71, 193–219 (2020).
10. Stevenson, R. A., Segers, M., Ferber, S., Barense, M. D. & Wallace, M. T. The impact of multisensory integration deficits on speech
perception in children with autism spectrum disorders. Front Psychol 5, 379 (2014).
11. Wallace, M. T. & Stevenson, R. A. The construct of the multisensory temporal binding window and its dysregulation in develop-
mental disabilities. Neuropsychologia 64C, 105–123 (2014).
12. Stevenson, R. A. et al. The cascading influence of multisensory processing on speech perception in autism. Autism 22, 609–624
(2018).
13. Tomchek, S. D. & Dunn, W. Sensory processing in children with and without autism: A comparative study using the short sensory
profile. Am. J. Occup. Ther. 61, 190–200 (2007).
14. Baum, S. H., Stevenson, R. A. & Wallace, M. T. Behavioral, perceptual, and neural alterations in sensory and multisensory function
in autism spectrum disorder. Prog. Neurobiol. 134, 140–160 (2015).
15. Mottron, L. & Burack, J. A. Enhanced Perceptual Functioning in the Development of Autism (Springer, New York, 2001).
16. Zhang, W. & Luck, S. J. Discrete fixed-resolution representations in visual working memory. Nature 453, 233–235 (2008).
17. Bays, P. M. & Husain, M. Dynamic shifts of limited working memory resources in human vision. Science 321, 851–854 (2008).
18. Baddeley, A. Working memory: Looking back and looking forward. Nat. Rev. Neurosci. 4, 829 (2003).
19. Mottron, L., Dawson, M., Soulieres, I., Hubert, B. & Burack, J. Enhanced perceptual functioning in autism: An update, and eight
principles of autistic perception. J. Autism Dev. Disord. 36, 27–43 (2006).
20. Stevenson, R. A. et al. Multisensory temporal integration in autism spectrum disorders. J. Neurosci. 34, 691–697 (2014).
21. Stevenson, R. A. et al. Brief report: Arrested development of audiovisual speech perception in autism spectrum disorders. J. Autism
Dev. Disord. 44, 1470–1477 (2014).
22. Stevenson, R. A. et al. Evidence for diminished multisensory integration in autism spectrum disorders. J. Autism Dev. Disord. 44,
3161–3167 (2014).
23. Happé, F. G. Studying weak central coherence at low levels: children with autism do not succumb to visual illusions. A research
note. J. Child Psychol. Psychiatry 37, 873–877 (1996).
24. Foxe, J. J. et al. Severe multisensory speech integration deficits in high-functioning school-aged children with autism spectrum
disorder (ASD) and their resolution during early adolescence. Cereb. Cortex 25, 298–312 (2013).
25. Stevenson, R. A. et al. Multisensory speech perception in autism spectrum disorder: From phoneme to whole-word perception.
Autism Res. 10, 1280–1290 (2017).
26. Irwin, J. R., Tornatore, L. A., Brancazio, L. & Whalen, D. H. Can children with autism spectrum disorders “hear” a speaking face?.
Child Dev. 82, 1397–1403 (2011).
27. Smith, E. G. & Bennetto, L. Audiovisual speech integration and lipreading in autism. J Child Psychol Psychiatry 48, 813–821 (2007).
28. Lord, C. et al. Autism Diagnostic Observation Schedule: ADOS-2 (Western Psychological Services, Los Angeles, CA, 2012).
29. Baron-Cohen, S., Wheelwright, S., Skinner, R., Martin, J. & Clubley, E. The autism-spectrum quotient (AQ): Evidence from asperger
syndrome/high-functioning autism, malesand females, scientists and mathematicians. J. Autism Dev. Disord. 31, 5–17 (2001).
Scientific Reports | (2021) 11:3648 | https://doi.org/10.1038/s41598-021-82777-1 7
Vol.:(0123456789)www.nature.com/scientificreports/
30. Constantino, J. N. et al. Validation of a brief quantitative measure of autistic traits: comparison of the social responsiveness scale
with the autism diagnostic interview-revised. J. Autism Dev. Disord. 33, 427–433 (2003).
31. Stevenson, J. L. & Hart, K. R. Psychometric properties of the autism-spectrum quotient for assessing low and high levels of autistic
traits in college students. J. Autism Dev. Disord. 6, 1838–1853 (2017).
32. Wechsler, D. & Hsiao-pin, C. WASI-II: Wechsler Abbreviated Scale of Intelligence (Pearson, New York, 2011).
33. Brainard, D. H. The psychophysics toolbox. Spat. Vis. 10, 433–436 (1997).
34. Pelli, D. G. The VideoToolbox software for visual psychophysics: transforming numbers into movies. Spat. Vis. 10, 437–442 (1997).
35. Kleiner, M. et al. What’s new in Psychtoolbox-3. Perception 36, 1 (2007).
36. Bays, P. M., Catalao, R. F. & Husain, M. The precision of visual working memory is set by allocation of a shared resource. J. Vis. 9,
7–7 (2009).
37. Plaisted, K., Swettenham, J. & Rees, L. Children with autism show local precedence in a divided attention task and global precedence
in a selective attention task. J. Child Psychol. Psychiatry 40, 733–742 (1999).
38. Bertone, A., Mottron, L., Jelenic, P. & Faubert, J. Enhanced and diminished visuo-spatial information processing in autism depends
on stimulus complexity. Brain 128, 2430–2441 (2005).
39. Mottron, L., Belleville, S. & Menard, E. Local bias in autistic subjects as evidenced by graphic tasks: Perceptual hierarchization or
working memory deficit?. J. Child. Psychol. Psychiatry 40, 743–755 (1999).
40. Mottron, L., Peretz, I., Belleville, S. & Rouleau, N. Absolute pitch in autism: A case study. Neurocase 5, 485–501 (1999).
41. Plaisted, K., O’Riordan, M. & Baron-Cohen, S. Enhanced visual search for a conjunctive target in autism: a research note. J. Child.
Psychol.. Psychiatry 39, 777–783 (1998).
42. Blake, R., Turner, L. M., Smoski, M. J., Pozdol, S. L. & Stone, W. L. Visual recognition of biological motion is impaired in children
with autism. Psychol. Sci. 14, 151–157 (2003).
43. Baio, J. et al. Prevalence of autism spectrum disorder among children aged 8 years—autism and developmental disabilities moni-
toring network, 11 Sites, United States, 2014. Morb. Mortal. Wkly. Rep. (MMWR) 67, 1–23 (2018).
44. Loveland, K. A., McEvoy, R. E., Tunali, B. & Kelley, M. L. Narrative story telling in autism and Down’s syndrome. Br. J. Dev. Psychol.
8, 9–23 (1990).
45. Bays, P. M. Noise in neural populations accounts for errors in working memory. J. Neurosci. 34, 3632–3645 (2014).
46. Schneegans, S. & Bays, P. M. Neural architecture for feature binding in visual working memory. J. Neurosci. 37, 3913–3925 (2017).
47. Perez Velazquez, J. L. & Galan, R. F. Information gain in the brain’s resting state: A new perspective on autism. Front. Neuroinform.
7, 37 (2013).
48. Dinstein, I. et al. Unreliable Evoked Responses in Autism. Neuron 75, 981–991 (2012).
49. Haigh, S. M., Heeger, D. J., Dinstein, I., Minshew, N. & Behrmann, M. Cortical variability in the sensory-evoked response in autism.
J. Autism Dev. Disord. 45, 1176–1190 (2014).
50. Coskun, M. A. et al. Increased response variability in autistic brains?. NeuroReport 20, 1543–1548 (2009).
51. Milne, E. Increased intra-participant variability in children with autistic spectrum disorders: Evidence from single-trial analysis
of evoked EEG. Front. Psychol. 2, 51 (2011).
52. Farah, M. J., Wilson, K. D., Drain, H. M. & Tanaka, J. W. What is “special” about face processing?. Psychol. Rev. 105, 298–482 (1998).
53. Joseph, R. M. & Tanaka, J. Holistic and part-based face recognition in children with autism. J. Child Psychol. Psychiatry 44, 529–542
(2003).
54. Davies, S., Bishop, D., Manstead, A. S. & Tantam, D. Face perception in children with autism and Asperger’s syndrome. J. Child
Psychol. Psychiatry 35, 1033–1057 (1994).
55. Brambilla, P. et al. Brain anatomy and development in autism: review of structural MRI studies. Brain Res. Bull. 61, 557–569 (2003).
56. Uddin, L. Q., Supekar, K. & Menon, V. Reconceptualizing functional brain connectivity in autism from a developmental perspec-
tive. Front. Hum. Neurosci. 7, 458 (2013).
57. Villalobos, M. E., Mizuno, A., Dahl, B. C., Kemmotsu, N. & Müller, R.-A. Reduced functional connectivity between V1 and inferior
frontal cortex associated with visuomotor performance in autism. NeuroImage 25, 916–925 (2005).
58. Koshino, H. et al. Functional connectivity in an fMRI working memory task in high-functioning autism. NeuroImage 24, 810–821
(2005).
59. Koshino, H. et al. fMRI investigation of working memory for faces in autism: Visual coding and underconnectivity with frontal
areas. Cereb. Cortex 18, 289–300 (2007).
60. Stevenson, R. A. et al. The cascading influence of low-level multisensory processing on speech perception in autism. Autism 22,
609–624 (2018).
61. Baddeley, A. Working memory and language: An overview. J. Commun. Disord. 36, 189–208 (2003).
Acknowledgements
RS is funded by an NSERC Discovery Grant (RGPIN-2017-04656), a SSHRC Insight Grant (435-2017-0936), the
University of Western Ontario Faculty Development Research Fund, the province of Ontario Early Researcher
Award, and a Canadian Foundation for Innovation John R. Evans Leaders Fund (37497). SF is funded by an
NSERC Discovery Grant (RGPIN-2018-05829). This research was supported by BrainsCAN at Western Uni-
versity through the Canada First Research Excellence Fund (CFREF) as well as by Western University’s Brain
and Mind Institute.
Author contributions
The study was designed by R.S., J.R., M.B., and S.F. Data was collected by R.S., M.S., and B.Z. Data was analyzed
and interpreted by R.S., J.R., S.S., M.B., and S.F. The manuscript was drafted by R.S., and edited and approved
of by all authors.
Competing interests
The authors declare no competing interests.
Additional information
Correspondence and requests for materials should be addressed to R.A.S.
Reprints and permissions information is available at www.nature.com/reprints.
Publisher’s note Springer Nature remains neutral with regard to jurisdictional claims in published maps and
institutional affiliations.
Scientific Reports | (2021) 11:3648 | https://doi.org/10.1038/s41598-021-82777-1 8
Vol:.(1234567890)www.nature.com/scientificreports/
Open Access This article is licensed under a Creative Commons Attribution 4.0 International
License, which permits use, sharing, adaptation, distribution and reproduction in any medium or
format, as long as you give appropriate credit to the original author(s) and the source, provide a link to the
Creative Commons licence, and indicate if changes were made. The images or other third party material in this
article are included in the article’s Creative Commons licence, unless indicated otherwise in a credit line to the
material. If material is not included in the article’s Creative Commons licence and your intended use is not
permitted by statutory regulation or exceeds the permitted use, you will need to obtain permission directly from
the copyright holder. To view a copy of this licence, visit http://creativecommons.org/licenses/by/4.0/.
© The Author(s) 2021
Scientific Reports | (2021) 11:3648 | https://doi.org/10.1038/s41598-021-82777-1 9
Vol.:(0123456789)You can also read