Volatile and intermediate volatility organic compounds in suburban Paris: variability, origin and importance for SOA formation
←
→
Page content transcription
If your browser does not render page correctly, please read the page content below
Atmos. Chem. Phys., 14, 10439–10464, 2014
www.atmos-chem-phys.net/14/10439/2014/
doi:10.5194/acp-14-10439-2014
© Author(s) 2014. CC Attribution 3.0 License.

Volatile and intermediate volatility organic compounds in suburban
Paris: variability, origin and importance for SOA formation
W. Ait-Helal1,2,3 , A. Borbon3 , S. Sauvage1,2 , J. A. de Gouw4,5 , A. Colomb6 , V. Gros7 , F. Freutel8 , M. Crippa9,* ,
C. Afif3,10 , U. Baltensperger9 , M. Beekmann3 , J.-F. Doussin3 , R. Durand-Jolibois3 , I. Fronval1,2 , N. Grand3 ,
T. Leonardis1,2 , M. Lopez7 , V. Michoud3 , K. Miet3 , S. Perrier3,** , A. S. H. Prévôt9 , J. Schneider8 , G. Siour3 , P. Zapf3 ,
and N. Locoge1,2
1 Université Lille Nord de France, 59000, Lille, France
2 École des Mines de Douai, Département Chimie et Environnement, 59508 Douai CEDEX, France
3 LISA, UMR-CNRS 7583, Université Paris Est Créteil (UPEC), Université Paris Diderot (UPD), Institut Pierre Simon

Laplace (IPSL), Créteil, France
4 Chemical Sciences Division, Earth System Research Laboratory, NOAA, Boulder, Colorado, USA
5 Cooperative Institute for Research in Environmental Sciences, University of Colorado, Boulder, Colorado, USA
6 LaMP, UMR-CNRS 6016, Clermont Université, Université Blaise Pascal, Aubière, France
7 LSCE, CNRS 8212, CEA, Université de Versailles Saint-Quentin en Yvelines, Gif sur Yvette, France
8 Max Planck Institute for Chemistry, Mainz, Germany
9 Laboratory of Atmospheric Chemistry, Paul Scherrer Institute, Villigen, Switzerland
10 Centre d’Analyses et de Recherche, Faculty of sciences, Université Saint Joseph, Beirut, Lebanon
* now at: EC Joint Research Centre (JRC), Inst. Environment & Sustainability, Via Fermi, 2749, 21027 Ispra, Italy
** now at : ISA, UMR-CNRS 5280, Université Lyon 1, ENS-Lyon, Villeurbanne, France

Correspondence to: A. Borbon (agnes.borbon@lisa.u-pec.fr)

Received: 9 January 2014 – Published in Atmos. Chem. Phys. Discuss.: 21 February 2014
Revised: 17 July 2014 – Accepted: 7 August 2014 – Published: 1 October 2014

Abstract. Measurements of gaseous and particulate organic          VOCs (aromatics and alkanes), IVOCs showed lower con-
carbon were performed during the MEGAPOLI experiments,             centrations in winter (< 5 ppt) compared to summer (13–
in July 2009 and January–February 2010, at the SIRTA ob-           27 ppt), which cannot be explained by the gas-particle par-
servatory in suburban Paris. Measurements comprise primary         titioning theory. Higher concentrations of most oxygenated
and secondary volatile organic compounds (VOCs), of both           VOCs in winter (18–5984 ppt) suggest their dominant pri-
anthropogenic and biogenic origins, including C12 –C16 n-          mary anthropogenic origin. The respective role of primary
alkanes of intermediate volatility (IVOCs), suspected to be        anthropogenic gaseous compounds in regional SOA forma-
efficient precursors of secondary organic aerosol (SOA). The       tion was investigated by estimating the SOA mass concen-
time series of gaseous carbon are generally consistent with        tration expected from the anthropogenic VOCs and IVOCs
times series of particulate organic carbon at regional scale,      (I / VOCs) measured at SIRTA. From an integrated approach
and are clearly affected by meteorology and air mass ori-          based on emission ratios and SOA yields, 38 % of the SOA
gin. Concentration levels of anthropogenic VOCs in urban           measured at SIRTA is explained by the measured concen-
and suburban Paris were surprisingly low (2–963 ppt) com-          trations of I / VOCs, with a 2 % contribution by C12 –C16
pared to other megacities worldwide and to rural continen-         n-alkane IVOCs. From the results of an alternative time-
tal sites. Urban enhancement ratios of anthropogenic VOC           resolved approach, the average IVOC contribution to SOA
pairs agree well between the urban and suburban Paris sites,       formation is estimated to be 7 %, which is half of the average
showing the regional extent of anthropogenic sources of sim-       contribution of the traditional aromatic compounds (15 %).
ilar composition. Contrary to other primary anthropogenic          Both approaches, which are based on in situ observations

Published by Copernicus Publications on behalf of the European Geosciences Union.
10440                       W. Ait-Helal et al.: Volatile and intermediate volatility organic compounds in suburban Paris

of particular I / VOCs, emphasize the importance of the in-        these reactions (Kanakidou et al., 2005; Hallquist et al.,
termediate volatility compounds in the SOA formation, and          2009). Just like VOCs, organic aerosols can be directly emit-
support previous results from chamber experiments and mod-         ted into the atmosphere – they are then called primary or-
eling studies. They also support the need to make systematic       ganic aerosol particles (POA), or they can be formed from
the IVOCs’ speciated measurement during field campaigns.           VOC precursors, whose oxidation products are partitioned
                                                                   between the particulate and the gaseous phases; they are then
                                                                   defined as secondary organic aerosol particles (SOA) (Odum
                                                                   et al., 1997; Kanakidou et al., 2005). In either of the two
1   Introduction                                                   phases, some organic pollutants are known to be harmful to
                                                                   people, threatening their health (Magill, 1949; Dockery et al.,
Since 1950, the number of people living in urban areas has         1993; Finkelstein et al., 2004; Kappos et al., 2004; Anderson,
steadily increased. According to the United Nations, the ur-       2009). They also play a role in the climate change, impacting
ban population has risen from 30 to 50 % of the world pop-         the visibility and earth’s radiation balance (Park et al., 2003;
ulation within the last 50 years, and it will reach about 70 %     Kanakidou et al., 2005).
by 2050 (United Nations, 2012). This intensive urbanization           Important uncertainties concerning the sources, formation
has led to the development of numerous megacities, defined         and fate of the organic aerosol particles are still to be ad-
as urban centers with at least 10 million inhabitants. If a high   dressed. In order to fill gaps in the knowledge of aerosols, and
population density characterizes a megacity, they are also de-     especially of secondary aerosols, one needs to rely on cham-
fined by their anthropogenic activities, which are not differ-     ber experiments, field measurements and modeling. Cham-
ent from other urban centers but more intense; larger amounts      ber experiments allowed for the study of SOA yields, result-
of atmospheric pollutants are emitted in megacities. Among         ing from the oxidation of individual VOCs. Several classes
them, there are the volatile organic compounds (VOCs), the         of species have been identified as important SOA precur-
emissions of which are diverse and include both anthro-            sors, in particular terpenes and aromatic compounds (Sein-
pogenic and biogenic sources. In urban areas like megacities,      feld and Pandis, 1998; Lee et al., 2006a; Ng et al., 2007a,
where industrialization and traffic are important (Molina and      b). Combined with these SOA yields, field measurements of
Molina, 2004), VOCs are mainly emitted by primary anthro-          both VOCs and organic aerosols have permitted the evalua-
pogenic sources (Gros et al., 2007). Once emitted into the at-     tion of the effective contribution of the measured VOCs to
mosphere, primary VOCs can be photolyzed or/and oxidized           the observed SOA (de Gouw et al., 2005, 2008). Finally, pre-
by atmospheric oxidants like the hydroxyl radical (OH), the        dictive models have been developed from observations in the
nitrate radical (NO3 ) or ozone (O3 ), and then, other VOCs are    field and in the laboratory. In urban areas, estimations us-
produced (Atkinson and Arey, 2003). These newly produced           ing these models often led to a large underestimation of ob-
VOCs or secondary VOCs, generally oxygenated (OVOC),               served SOA: de Gouw et al. (2008) explained only 37 % of
can themselves undergo further reactions and produce dif-          the measured SOA in New England, USA, while Volkamer
ferent oxidants as by-products, including ozone (Jenkin and        et al. (2006) underestimated observed SOA by a factor of 10
Hayman, 1999; Tanaka et al., 2003), whose adverse effects          by using a gas-particle partitioning model. This discrepancy
on climate and people are well-known (Heiden et al., 1999;         increased downwind of the sources, and a factor of up to 100
Wildt et al., 2003; Filleul et al., 2006).                         could be reached in remote areas (Heald et al., 2005). De
   VOCs in megacities have been widely studied in the past.        Gouw et al. (2008) suggested a strong role of non-measured
Their ambient concentrations have been commonly explored           gaseous carbon, especially those of low volatility, as an ex-
(Barletta et al., 2002; Khoder, 2007), but numerous studies        planation of this discrepancy. Indeed, until recently, biogenic
mainly focused on traffic emissions (Baumbach et al., 1995;        VOCs were thought to be the main SOA precursors (Kanaki-
Colón et al., 2001; Barletta et al., 2002; Srivastava et al.,      dou et al., 2005). However, in urban areas, this assumption
2005; Martins et al., 2007; Khillare et al., 2008; Majum-          has since been refuted (Volkamer et al., 2006; Hodzic et al.,
dar et al., 2008). VOC emissions by other sources (solvent         2010) and has been found true only in clean atmospheres,
uses, gasoline evaporation, gas leakage, etc.) were also in-       where the prediction of SOA formation appears to be accu-
vestigated, especially through source apportionment studies        rate (Hodzic et al., 2009). Hodzic et al. (2010) recently im-
(Srivastava, 2004; Lanz et al., 2008; Bon et al., 2011; Gaimoz     proved the SOA prediction in urban areas by considering pri-
et al., 2011). As for biogenic VOCs, even though their emis-       mary gaseous organic compounds of lower volatility, which
sions are not as strong in urban areas, their study remains        could partition between the gas and the particulate phase
of great importance in such areas, since they can contribute       (Robinson et al., 2007; Epstein et al., 2010; Zhang et al.,
to the formation of secondary gaseous pollutants, including        2013). Recently, laboratory studies as well as field measure-
ozone (Chameides et al., 1988; Shao et al., 2000; Duan et al.,     ments have indeed highlighted the importance of VOCs of
2008; Ran et al., 2011).                                           lower volatility in the SOA formation in urban areas (Robin-
   Oxidation of VOCs leads to the formation of other gaseous       son et al., 2007; Coe, 2011; Li et al., 2013; Yuan et al., 2013)
compounds. Also, organic aerosols (OA) can result from             and downwind of a well-defined crude oil spill (de Gouw et

Atmos. Chem. Phys., 14, 10439–10464, 2014                                          www.atmos-chem-phys.net/14/10439/2014/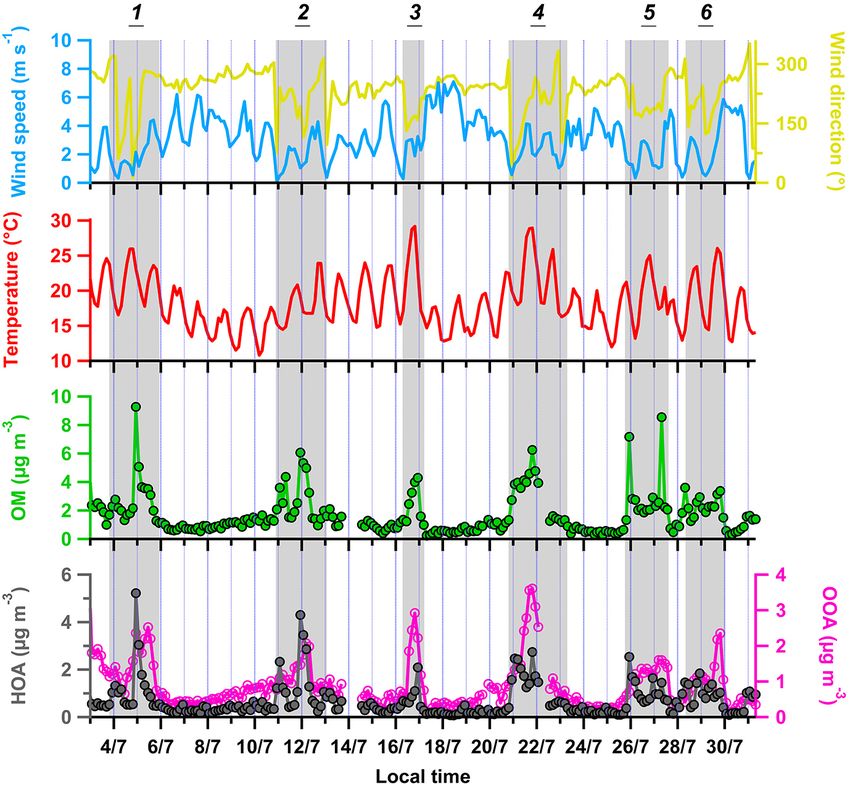
W. Ait-Helal et al.: Volatile and intermediate volatility organic compounds in suburban Paris                               10441

al., 2011), emphasizing the need to measure these species.
Even though major progress has been made in the under-
standing of SOA formation and the role of the IVOCs, the
studies rarely reproduce the conditions encountered in urban
areas. Indeed, laboratory studies for the determination of the
SOA yields only investigate SOA formed by the oxidation of
a single IVOC precursor (Lim and Ziemann, 2005, 2009a, b;
Chan et al., 2009; Presto et al., 2010). As for the in situ stud-
ies, they have only considered a single IVOC source (Robin-
son et al., 2007; de Gouw et al., 2011; Li et al., 2013).
   In this context, the FP7 MEGAPOLI project (Megacities:
Emissions, urban, regional and Global Atmospheric POLlu-
tion and climate effects, and Integrated tools for assessment       Figure 1. MEGAPOLI sampling sites (source: Google Earth).
and mitigation) aims to quantify sources of primary and sec-
ondary aerosols and the role of organic gas-phase precur-
sors in and around a large metropolitan area, and to describe       level), 14 km southwest of Paris. This site, surrounded by
their evolution in the megacity plume. Two intensive field          fields, wooded areas, houses and industries, has been qual-
campaigns were conducted in the Greater Paris region dur-           ified as suburban (Haeffelin et al., 2005). LHVP (“Labora-
ing summer 2009 and winter 2010, during which simultane-            toire d’Hygiène de la Ville de Paris”, 48.829◦ N, 2.207◦ E;
ous measurements of gaseous and particulate organic com-            62 m above sea level) is an urban background site located in
pounds were performed. A wide range of gaseous carbona-             the southern part of the French capital. The sampling site is
ceous compounds, from C1 to C16 , was measured at a sub-            located in a large public garden at approximately 150 m from
urban site of Paris (SIRTA), including important SOA pre-           a major street. Due to the low intensity of the surrounding
cursors such as the C6 –C8 aromatic compounds, monoter-             traffic and from measurements, it has been qualified as rep-
penes and the C12 –C16 n-alkanes of intermediate volatility,        resentative of Paris background pollution (Favez et al., 2007;
which are rarely measured in an ambient atmosphere. Mea-            Sciare et al., 2010; Gros et al., 2011).
surements of VOCs (C2 –C6 and C6 –C10 ) at an urban back-              This article focuses on the gaseous and particulate or-
ground site (LHVP) were also performed.                             ganic carbon measured at SIRTA. Measurements performed
   The first goal of this paper is to analyze the temporal and      at LHVP are used here to support the analysis of the organic
spatial variability and origin of gaseous organic carbon in         carbon at SIRTA.
suburban Paris. The respective role of chemical removal, pri-
mary and secondary emissions and meteorology is discussed           2.2   Measurements of organic carbon and ancillary data
(Sects. 3 and 4). The second goal of this paper is to estimate
the respective contribution of the anthropogenic VOC pre-           The organic carbon was intensively measured at the two sites,
cursors to the SOA formation in summertime, with a particu-         in both the gaseous and particulate phases, using numerous
lar focus on the importance of the n-alkanes of intermediate        offline and online instruments. All the instruments used in
volatility (Sect. 5). The method relies on two independent          the present analysis and their performances are presented in
approaches: an integrated approach and a time-resolved ap-          Tables 1 and 2.
proach.                                                                At SIRTA, gaseous organic carbon measurements included
                                                                    C1 –C16 organic compounds. These compounds can be clas-
                                                                    sified according to their saturation concentration, C ∗ , which
2     Methods                                                       is an indicator of their volatility (Robinson et al., 2007;
                                                                    Epstein et al., 2010). Thus, given their C ∗ , C12 –C16 n-
2.1    Sampling sites                                               alkanes are of intermediate volatility, as they are character-
                                                                    ized by 103 µg m−3 < C ∗ < 106 µg m−3 , while all other mea-
One summertime and one wintertime field campaign were               sured compounds were volatile (C ∗ > 106 µg m−3 ) (Robin-
conducted in Paris and its surrounding area in the frame of         son et al., 2007; de Gouw et al., 2011). It should be noted
the EU-MEGAPOLI project. The first experiment took place            that, in this paper, the acronyms IVOCs and VOCs will
during the whole month of July 2009; the second one started         be used to designate each family, while I / VOCs will in-
on 15 January 2010 and ended on 15 February 2010.                   clude both of them. C1 –C16 organic compounds were col-
   Measurements of the gaseous organic carbon were per-             lected by active sampling on sorbent cartridges, using a sam-
formed at two ground sites: SIRTA and LHVP, which are               pling module developed by TERA Environment – either a
presented in Fig. 1. SIRTA, which stands for “Site Instru-          SASS (Smart Automatic Sampling System) in summer or
mental de Recherche par Télédétection Atmosphérique”, is            an ACROSS (Automatic Clean ROom Sampling System) in
located in Palaiseau (48.713◦ N, 2.214◦ E; 156 m above sea          winter (Detournay et al., 2011). Gaseous compounds were

www.atmos-chem-phys.net/14/10439/2014/                                            Atmos. Chem. Phys., 14, 10439–10464, 2014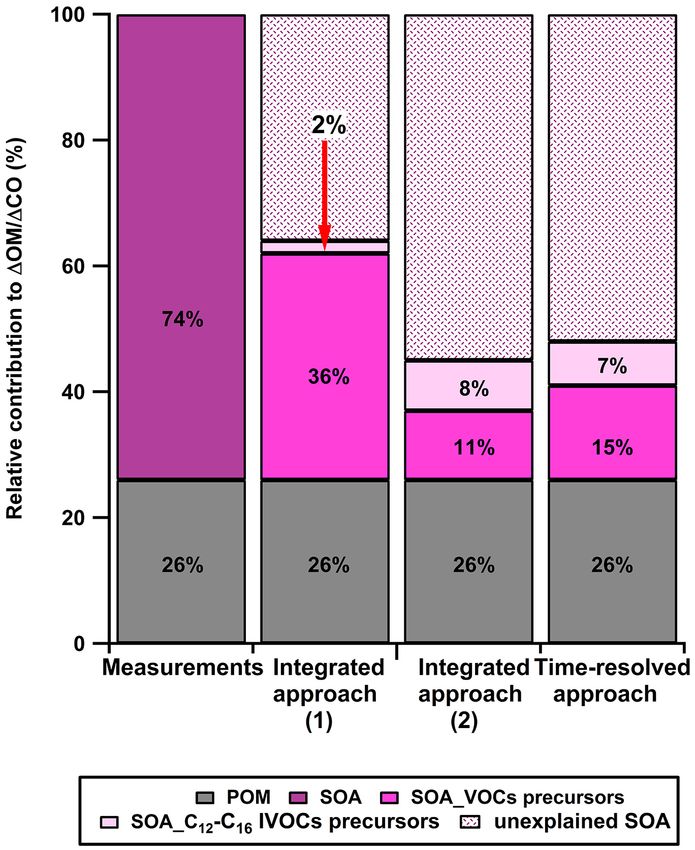
10442                                 W. Ait-Helal et al.: Volatile and intermediate volatility organic compounds in suburban Paris

Table 1. Offline measurements of the gaseous organic carbon during MEGAPOLI at SIRTA.

        Column compounds              Column sorbent          Institution     Analysis               LOD (ppt)   Uncertainty (%)     Reference
        Aromatics                     Activated charcoal      EMD/LISA        Adsorption/thermal     1–20        3–26                Detournay et
        C9 –C16 alkanes               (carbotrap B + car-                     desorption (ATD)                                       al. (2011)
        C9 –C10 aldehydes             botrap C)                               + GC-FID
        Terpenes
        C1 –C9 aldehydes Ke-          2,4-                  EMD/LISA          Chemical desorp-       10–60       11–37               Kleindienst
        tones                         dinitrophenylhydrazine                  tion (acetonitrile)                                    et al. (1998)
                                      (DNPH)                                  + HPLC/UV                                              Bates et al. (2000)
                                                                                                                                     Dettmer and Enge-
                                                                                                                                     wald (2003)

LOD: limit of detection

Table 2. Online measurements of organic carbon and ancillary data during MEGAPOLI at SIRTA and LHVP.

      Measurements             Site        Institution   Instrument                Time resolution   LOD         Uncertainty       Reference
                                                                                   (min)             (ppt)       ( %)
      C3 –C9 NMHCs             SIRTA       LISA          GC-FID AirmoVOC           30                100         20
                                                         (Chromatotec® )
      C2 –C6 NMHCs             LHVP        LSCE          2            GC-FIDs      30                37–93       15–20             Gros et al. (2011)
      C6 –C10 NMHCs                                      (Chromatotec® )
      CO                       SIRTA       LSCE          GC (hot mercuric oxide    15                1000        10                Gros et al. (1999)
                                                         detection)
      NO                       SIRTA       LISA          AC31M analyzer (En-       1                 500         5
                                                         vironnement S.A.)
      NO2                      SIRTA       LISA          NOx TOy (MetAir)          1                 500         5                 Dommen et al. (2000)
                                                                                                                                   Michoud et al. (2012)
      O3                       SIRTA       LISA          49C analyzer (Thermo      1                 1000        5
                                                         Environment     Instru-
                                                         ment)
      Meteorological           SIRTA       LISA          Wind sensor and multi-    1                 NA          NA
      parameters                                         plate radiation shield
      (T , RH, P, speed and                              (Young)
      direction of the wind)
      Mixing layer depth       SIRTA       LMD           ALS450 Lidar              60                NA          NA                Haeffelin et al. (2012)
      Non-refractory par-      SIRTA       PSI           HR-ToF-AMS                5                 NA          30–36             DeCarlo et al. (2006)
      ticulate matter (PM1 )                                                                                                       Crippa et al. (2013a)
                                                                                                                                   Freutel et al. (2013a)

LOD: limit of detection.

sampled at approximately 4 m above ground level (a.g.l.),                               MnO2 ozone scrubber was used for the cartridges filled with
and then trapped into one of the two types of cartridges: a                             carbotrap™ . Besides, stainless-steel particle filters of 2 µm
multi-sorbent cartridge, composed of carbopack C (200 mg)                               porosity (Swagelok® ) were used to prevent any sampling of
and carbopack B (200 mg) (carbotrap™ 202 from Perkin-                                   particles, which could block the sampling system. Cartridges
Elmer® ), and a Sep-Pak DNPH-Silica cartridge (Waters® ).                               were then analyzed by HPLC/UV (High-Performance Liquid
C6 –C8 aromatic compounds, C9 –C16 n-alkanes, monoter-                                  Chromatography with Ultra Violet detection; for the DNPH
penes and C6 –C10 n-aldehydes were sampled during 3 hours                               cartridges) or by GC-FID (Gas Chromatography coupled to
at a flow rate of 200 mL min−1 on the multi-sorbent car-                                a Flame Ionization Detector; for the carbotrap™ filled car-
tridges. Additional C1 to C9 OVOCs (oxygenated VOCs)                                    tridges) in the laboratory. The reproducibility of the analysis
were sampled onto the DNPH-cartridges, with a time reso-                                was checked by the daily analysis of a standard, leading to
lution of 3 hours too but at a flow rate of 1.5 L min−1 . Prior                         the plotting of a control chart for each compound, which al-
to sampling, carbotrap™ -filled cartridges were conditioned                             lowed the reproducibility of the instruments to be checked.
with purified air at 250 ◦ C, at a flow rate of 10 mL min−1 ,                              At SIRTA, online measurements of C3 –C9 NMHCs (non-
during 24 h. During the sampling, different ozone scrub-                                methane hydrocarbons) were also performed using an auto-
bers were used in order to prevent any ozonolysis of the                                sampling GC-FID, AirmoVOC (Chromatotec® ). Two other
measured compounds: a KI ozone scrubber was installed                                   auto-sampling GC-FIDs were installed at LHVP: Chroma-
upstream of the sampling onto DNPH cartridges, while a                                  Trap and AirmoBTX (both from Chromatotec® ) for the

Atmos. Chem. Phys., 14, 10439–10464, 2014                                                                  www.atmos-chem-phys.net/14/10439/2014/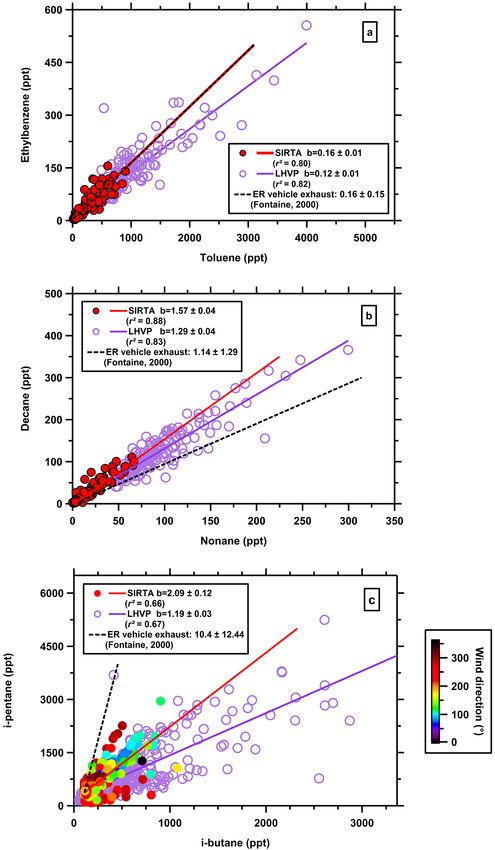
W. Ait-Helal et al.: Volatile and intermediate volatility organic compounds in suburban Paris                               10443

C2 –C6 and the C6 –C10 NMHCs measurements, respectively.           1994; Cheng et al., 1997; Na and Kim, 2001; Swanson et al.,
Details on the latter instruments can be found in Gros et          2003; Yang et al., 2005; Shirai et al., 2007): (i) a stronger
al. (2011). Inlet lines of the instruments were located at 4       temperature inversion in winter than in summer, leading to
and 15 m a.g.l. at SIRTA and LHVP stations, respectively.          a mean daytime boundary layer 3 times shallower in winter
   Carbon monoxide was measured at SIRTA by a Gas Chro-            than in summer at SIRTA (440 ± 220 m and 1340 ± 610 m,
matograph coupled to a Reduction Gas Analyzer (Trace An-           respectively, between 9 a.m. and 6 p.m.) (Filella and Peñue-
alytical, Menlo Park, CA, USA), following the method de-           las, 2006); (ii) lower OH radical concentrations in winter
scribed by Gros et al. (1999). Calibration was performed with      and thus less depletion by photochemistry (Michoud et al.,
a 40 L aluminum cylinder CO standard gas (187 ± 20 ppb)            2012, 2014); and finally (iii) sources of different nature, com-
in synthetic air, which was provided and calibrated by             position and/or strengths. Different primary anthropogenic
the Central Calibration Laboratories (CCL) of the National         sources are known to be subject to the seasonal variations de-
Oceanic and Atmospheric Administration (NOAA, Boulder,             tailed in the last assumption, among these is the fuel evapo-
CO, USA) (Novelli et al., 1994). CO measurements were              ration. Indeed, seasonal modifications in the fuel formulation
performed every 2.5 min, by alternating injection of a stan-       reduce the fraction of the light VOCs (butanes and pentanes)
dard and of a sample (atmospheric air). Each sample was            in summer to limit fuel evaporation (Borbon et al., 2003;
calibrated against the preceding standard and measurements         Lee et al., 2006b; Gentner et al., 2009). Engine cold-start
were averaged every 15 min.                                        emissions also vary seasonally: they are enhanced in winter
   The chemical composition of submicron particulate or-           as a consequence of low temperatures, which results in the
ganic carbon (PM1 ) was investigated with a High Resolution        stronger emission of aromatic compounds in vehicular ex-
Time-of-Flight Aerosol Mass Spectrometer (HR-ToF-AMS)              haust during winter (Heeb et al., 1999; Borbon et al., 2002;
at each site (Crippa et al., 2013a; Freutel et al., 2013a). A      Hoque et al., 2008; Roukos et al., 2009). Finally, the cold
positive matrix factorization (PMF) analysis was used for the      weather in winter leads to an intensive use of domestic heat-
organic fraction of the particulate matter in order to identify    ing and thus to increased emissions of toluene, benzene or
the different components of the organic matter (OM) (Crippa        even butane (e.g., Borbon et al., 2002; Badol et al., 2008;
et al., 2013a, b; Freutel et al., 2013a).                          Roukos et al., 2009).
   Complementary measurements of nitrogen oxide (NO)                  Similarly, the light C2 –C6 oxygenated VOCs
and nitrogen dioxide (NO2 ), as well as of ozone (O3 ) were        (methylvinylketone (MVK) and methylethylketone (MEK)
performed at SIRTA. Temperature, wind speed and direction,         excluded) also have higher mixing ratios in winter, indicat-
relative humidity, solar radiation and pressure were measured      ing that OVOC are dominated by primary anthropogenic
by a weather station (see details in Table 2).                     emissions such as traffic (Grosjean et al., 2001; Legreid et
   FLEXPART simulations were computed on a 3 h basis for           al., 2007) or wood burning (Schauer et al., 2001; Gaeggeler
the two campaigns. Based on a Lagrangian particle disper-          et al., 2008). These observations contrast with previous
sion model, FLEXPART simulations provide information on            studies that have found higher OVOC concentrations in
the probable origin of particles and trace gases sampled at        summer at urban and suburban sites (Sin et al., 2001; Ho et
the receptor site by looking at the dispersion of air pollutants   al., 2002; Bakeas et al., 2003; Legreid et al., 2007; Wang,
(Stohl et al., 2005).                                              2010) as a consequence of their enhanced photochemical
                                                                   secondary production in summer.
                                                                      On the contrary, VOCs of biogenic origin (isoprene
3     Overview of the VOCs measurements                            and pinenes) show higher levels in summer due to their
                                                                   temperature-dependent biogenic emissions. Isoprene emis-
3.1    Seasonal variations of VOCs                                 sions have the particularity to also be light dependent (Guen-
                                                                   ther et al., 1991). This is also observed for MVK for which
Table 3 summarizes the means and the standard deviations           isoprene is the precursor. Limonene and camphene exhibit
of the concentrations of the VOCs measured at SIRTA dur-           different behaviors compared to other terpenes. Limonene,
ing the summertime and wintertime MEGAPOLI campaigns               which does not vary seasonally, and camphene are still de-
and their properties. Data below the limit of detection (LOD)      tected in winter. Measurements of monoterpenes (pinenes,
were replaced by LOD/2. It can be seen that the VOC                camphene and limonene) in urban areas are not common, un-
mean concentrations exhibit high relative standard devia-          like for isoprene which is also known to be emitted by pri-
tions, ranging from 50 to 100 %, caused by the high variabil-      mary anthropogenic sources (Borbon et al., 2001). Monoter-
ity of the compounds during the two campaigns as a conse-          pene measurements are usually performed in remote ar-
quence of the changes in synoptic meteorology and air mass         eas, far from any anthropogenic influence (Kleindienst et
origin (Crippa et al., 2013a; Freutel et al., 2013a).              al., 2007; Detournay et al., 2013). To our knowledge, only
   VOCs of anthropogenic origin, including aromatics and           Yoshino et al. (2012) measured them individually in an
C4 –C6 alkanes, have higher mixing ratios in winter. This dif-     urban area, Tokyo (Japan), during the two seasons. They
ference can be explained by three factors (Boudries et al.,        found higher concentrations in winter than in summer for the

www.atmos-chem-phys.net/14/10439/2014/                                           Atmos. Chem. Phys., 14, 10439–10464, 2014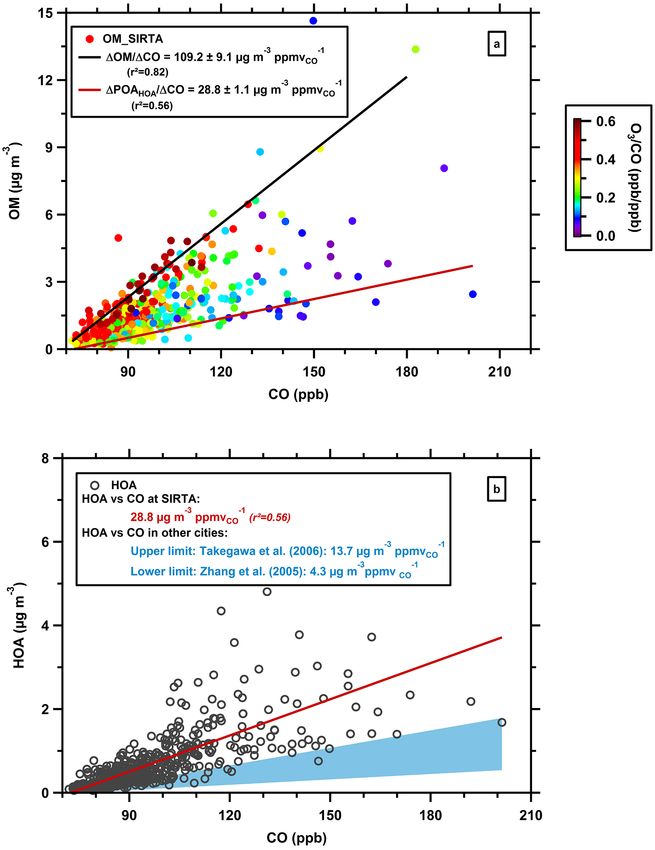
10444 W. Ait-Helal et al.: Volatile and intermediate volatility organic compounds in suburban Paris
Table 3. Summer and winter mean concentrations, standard deviation (SD), percentage of values below limit of detection ( % < LOD), rate
constant with OH (kOH; when not indicated: Atkinson and Arey, 2003) and SOA yield formation (when not indicated: Seinfeld and Pandis,
1998) of the VOCs measured in suburban Paris (SIRTA).
Compound Summer (ppt) Winter (ppt) 1012 kOH (298 K) SOA Yield
Mean SD ( % < LOD) Mean SD ( % < LOD) (cm3 molecule−1 s−1 ) (µg m−3 ppm−1 )
i-Butane 250 140 (0) 460 282 (0) 2.12 0
n-Butane 377 393 (0) 963 588 (0) 2.3 0
i-Pentane 334 354 (11) 416 213 (0) 3.6 –
n-Pentane 193 138 (27) nd nd 3.8 0
Hexane 94 50 (66) 85 50 (13) 5.2 –
Nonane 14 13 (0) 18 13 (0) 9.7 425d
Decane 24 22 (11) 24 19 (0) 11 850d
Undecane 19 16 (1) 16 11 (0) 12.3 1726d
Dodecane 22 21 (0) 7 4(5) 13.2 258e ; 1136f
Tridecane 13 12 (56) 2 1 (41) 15.1 754e ; 2896f
Tetradecane 27 23 (0) 2 2 (63) 17.9 (312 K) 1152e ; 3887f
Pentadecane 23 18 (0) 4 2 (8) 20.7 (312 K) 1416e ; 4622f
Hexadecane 22 19 (6) nd nd 23.2 (312 K) 1750e ; 5214f
Isoprene 357 280 (5) 69 39 (4) 100 64g
α-Pinene 48 45 (0) 20 52(25) 52.3 2338h
β−Pinene 10 6 (4) nd nd 74.3 1724i
Camphene nd nd 23 18 (1) 53 762
Limonene 16 16 (7) 15 19 (1) 164 3283i
Benzene NA NA 316 155 (0) 1.22 1181j ; 898j
Toluene 207 179 (0) 321 216 (0) 5.63 1145j ; 404j
Ethylbenzene 37 31 (0) 60 39 (0) 7 1145j, k ; 404j, k
m,p-Xylene 80 76 (0) 150 109 (0) 23.1; 14.3 1578j ; 276j
o-Xylene 40 31 (0) 53 39 (0) 13.6 1578j, k ; 276j, k
Formaldehyde 1 607 1031 (0) 5984 1892 (0) 9.37 0
Acetaldehyde 621 283 (0) 1199 528 (0) 15 –
Acetone 1 344 480 (0) 1705 677 (0) 0.17 0
Glyoxal 47 23 (1) 158 119 (5) 11 0
Methylglyoxal 55 38 (15) 207 153 (9) 15 0
Propanal 85 42 (3) 247 125 (0) 20 –
Methylvinylketone (MVK) 290 273 (3) 54 108 (12) 20 –
Butenal 8 4 (100) 860 593 (1) 36.0a –
Butan-2-one (MEK) 1639 1500 (0) 363 262 (6) 1.22 0
Methacrolein 60 63 (19) 121 178 (25) 29 –
i,n-Butanal 52 31 (24) 318 310 (3) 24–26 –
i-Pentanal 15 14 (85) 77 45 (26) 27 –
Benzaldehyde 26 16 (25) 638 301 (2) 12 –
Pentanal + o-tolualdehyde 29 12 (69) 84 60 (35) 28; 18 –
m,p-Tolualdehyde 8 4 (100) 25 22 (87) 17; 13 –
2,5-Dimethylbenzaldehyde 7.5 11 (93) 412 253 (6) 43.7b –
Hexanal 54 50 (7) 31 27 (2) 30 –
Heptanal 67 68 (2) 46 26 (0) 30 –
Octanal 82 66 (2) nd nd 28.6c –
Nonanal 58 45 (2) 18 14 (8) 30.0c –
Decanal 39 22 (2) nd nd 31.4c –
NA: not available; nd: not detected; a : Atkinson, 1986; b : Tse et al. (1997); c : Hellén et al. (2004); d : Lim and Ziemann (2009a); e : Presto et al. (2010), COA = 2 µg m−3 ; f :
Presto et al. (2010), COA = 40 µg m−3 ; g : Kroll et al., 2006; h : Ng et al. (2007b); i : Lee et al. (2006a); j : Ng et al. (2007a); k : Odum et al. (1997). For the C12 –C16
n-alkanes and the aromatics, the first SOA yield values is the one determined under relevant atmospheric conditions to our study, the second one is the one determined
under both high COA and high NOx .
Atmos. Chem. Phys., 14, 10439–10464, 2014 www.atmos-chem-phys.net/14/10439/2014/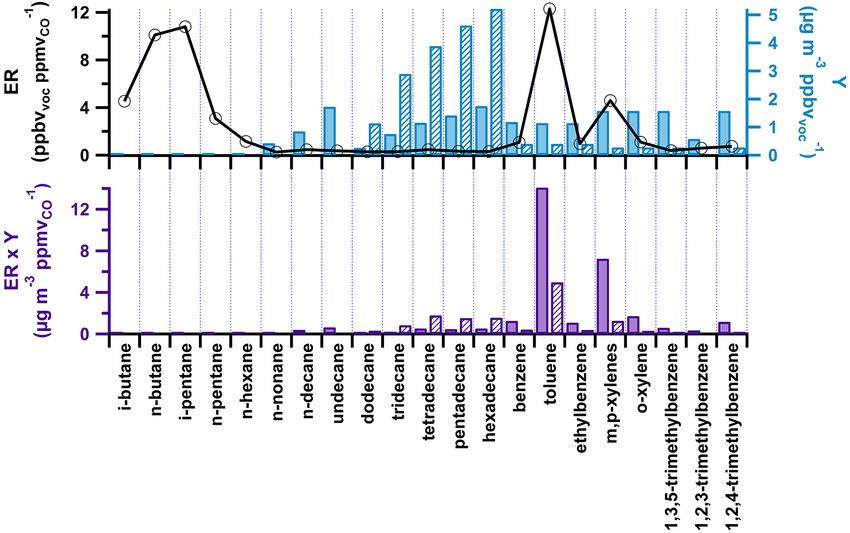
W. Ait-Helal et al.: Volatile and intermediate volatility organic compounds in suburban Paris 10445
pinenes, with concentrations of β-pinene lower than those
of α-pinene, which is in good agreement with our measure-
ments. Camphene concentrations were equal to zero during
the two seasons, while limonene concentrations were slightly
more important in winter than in summer. Finally, our re-
sults, supported by those of Yoshino et al. (2012), suggest
weaker sink processes in winter than in summer. Our results
also imply a small anthropogenic source in urban/suburban
areas of these compounds, in addition to their well-known
biogenic origin. This latter assumption has been recently put
forward by Hellén et al. (2012), who identified traffic and
wood combustion as potential emission sources of VOCs for-
merly thought to be only of biogenic origin.
The C12 –C16 IVOCs alkanes have higher mixing ratios in
summer than in winter, whereas the other compounds, the
C6 –C10 aldehydes and the C9 –C11 n-alkanes, do not show
any clear seasonality in their mixing ratios. The IVOCs alka-
nes, which can be emitted by traffic (Fraser et al., 1998;
Schauer et al., 1999a, 2002), cooking activities (Schauer et
al., 1999b) or biomass burning (Schauer et al., 2001), are
more likely to be subject to their partitioning between the Figure 2. Time series of meteorological parameters (wind speed
and direction, temperature), of the organic matter, and of the two
gas- and the particle-phase, which could explain the sea-
PMF factors HOA and OOA in suburban Paris (SIRTA) in summer
sonal differences. Indeed, measurements and characteriza- 2009. The grey-shaded areas highlight the “Atlantic Polluted” wind
tion of the chemical composition of ambient particles sam- regimes associated with stagnant conditions and increased OOA.
pled in urban/suburban sites showed that IVOC n-alkanes
were more abundant in the particle-phase in winter than in
summer (Kadowaki, 1994; Bi et al., 2003; Guo et al., 2009).
Estimation of the hexadecane partition coefficient Kp deter- sions, i.e., directly emitted organic aerosol (Zhang et al.,
mined from Pankow theory (Pankow, 1994) show no signif- 2005; Aiken et al., 2010; Hodzic et al., 2010). Here, HOA
icant difference between the summer and the winter cam- is assumed to represent the total primary organic aerosol, in-
paigns (2.16 × 10⁻⁴ and 8.61 × 10⁻⁴ , respectively) (see the cluding aerosol emitted from traffic and cooking activities
Supplement S1, for details of the Kp calculations). Changes (Freutel et al., 2013a). Further PMF analyses (Crippa et al.,
in the emission sources are more likely the cause of their 2013b) and single particle analysis (Freutel et al., 2013b)
seasonal variations. Regarding the C6 –C10 n-aldehydes, to have actually separated the HOA component into the two dif-
our knowledge, only Knobloch et al. (1997) and Cecinato et ferent components HOA-traffic and cooking organic aerosol
al. (2002) compared the seasonal measurements of all these (COA). As for OOA, it represents more aged organic aerosol,
compounds over an urban area. Both studies observed higher and therefore is thought to be mainly representative of sec-
concentrations of C6 –C10 n-aldehydes in winter than in sum- ondary organic aerosol. The OOA component has also been
mer. Conversely, Dutta et al. (2010) found lower concentra- separated into two different factors based on the PMF anal-
tions in winter than in summer for hexanal and nonanal. In yses of Crippa et al. (2013b): semi-volatile OOA (SV-OOA)
our study, C6 –C10 n-aldehydes concentrations were higher and low-volatile OOA (LV-OOA). SV-OOA is considered to
in summer than in winter, suggesting their predominant sec- be the freshest SOA, i.e., freshly formed, contrary to LV-
ondary origin. OOA (Jimenez et al., 2009). During the MEGAPOLI sum-
mer experiment, SV-OOA and LV-OOA represent on average
3.2 Temporal evolution of the particulate and gaseous 56 and 44 % of OOA, respectively. The temporal evolution of
organic compounds the OM and of HOA and OOA PMF components at SIRTA is
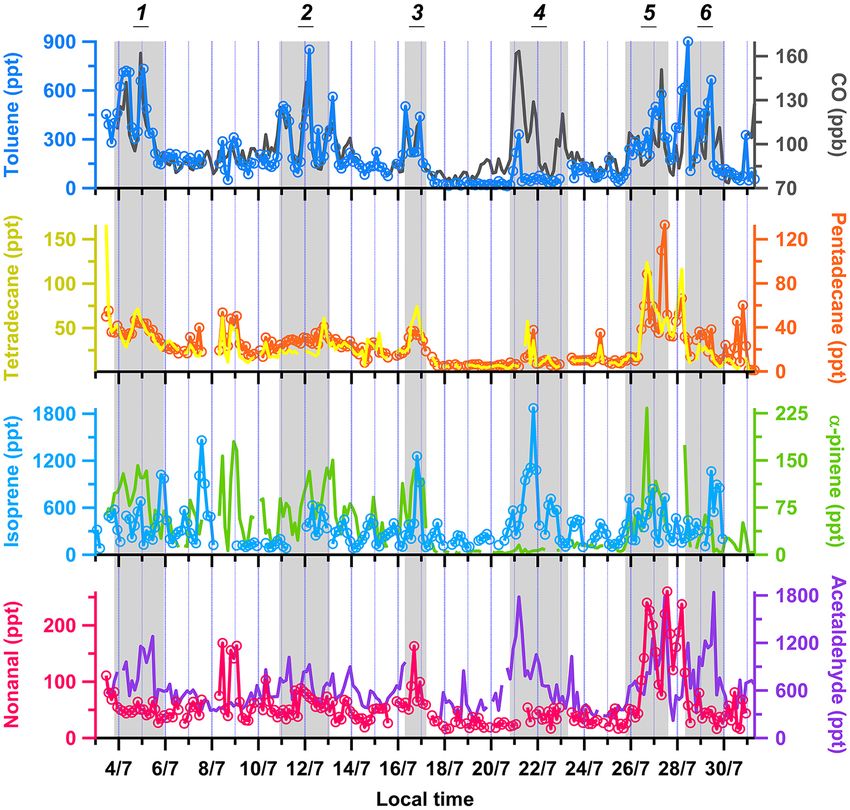
illustrated in Fig. 2. In addition, this figure depicts some me-
PMF analyses performed on the particulate organic matter, teorological parameters (wind speed and direction, tempera-
measured using a HR-TOF-AMS, was used for the char- ture). Time series of a tracer of primary combustion sources
acterization of the particulate organic carbon at the SIRTA (CO), anthropogenic and biogenic organic SOA precursors
site (Freutel et al., 2013a). Two PMF components were de- (toluene, tetradecane, pentadecane, α-pinene and isoprene),
termined: hydrocarbon-like organic aerosol (HOA) and oxy- and of oxygenated VOCs (nonanal and acetaldehyde), which
genated organic aerosol (OOA), respectively representing 40 are known to have secondary sources, are presented in Fig. 3.
and 60 % of the organic matter (OM) during the campaign. Cloudy conditions characterized the summertime cam-
The first PMF component is associated with primary emis- paign: between 3 and 31 July, only a few sunny
www.atmos-chem-phys.net/14/10439/2014/ Atmos. Chem. Phys., 14, 10439–10464, 2014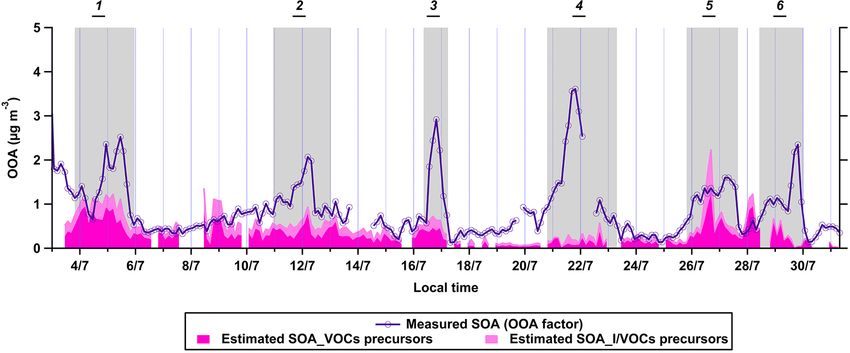
10446                        W. Ait-Helal et al.: Volatile and intermediate volatility organic compounds in suburban Paris

                                                                         As shown by Freutel et al. (2013a), OM showed the lowest
                                                                      levels under a westerly wind regime, with an average mass
                                                                      concentration of 0.9 µg m−3 . Under stagnant conditions, i.e.,
                                                                      during events 1 to 6, OM mass concentrations clearly in-
                                                                      creased, as well as the HOA and OOA mass concentrations.
                                                                      An increase in the concentrations was also observed for the
                                                                      VOCs during these periods (Fig. 3), but it appeared to be vari-
                                                                      able from one event to another, from one gaseous compound
                                                                      to another. Indeed, during event 3, all the VOCs showed a
                                                                      notable increase in their concentrations, regardless of their
                                                                      emission sources. For the primary anthropogenic VOCs, such
                                                                      as toluene, the biogenic VOCs, like isoprene or α-pinene, and
                                                                      for acetaldehyde and other oxygenated VOCs, mean concen-
                                                                      trations are about 1.5 times higher than the mean concen-
                                                                      trations measured during the previous period influenced by
                                                                      westerly winds (13–16 July). An increase in the VOC con-
                                                                      centrations was also observed during event 4. But, among
                                                                      all the SOA precursors, isoprene is the only one exhibiting
                                                                      a significant enhancement during the entire event; the other
                                                                      compounds, including primary anthropogenic I / VOCs, pre-
Figure 3. Summertime time series of carbon monoxide, toluene,         sented a sharp and short increase of their concentrations on
tetradecane, pentadecane, isoprene, α-pinene, nonanal and acetalde-   21 July. Remarkably, the increase in the isoprene concentra-
hyde. The grey-shaded areas highlight the “Atlantic Polluted” wind
                                                                      tions was accompanied by a notable increase in the level of
regimes associated with stagnant conditions and increased OOA.
                                                                      CO. CO is one of the primary anthropogenic emissions trac-
                                                                      ers, but it can also result from the photo-oxidation of VOCs,
days were encountered and the average temperature was                 including those of biogenic origin (Gros et al., 2002; Kanaki-
18.3 (± 3.8) ◦ C. Southwesterly to westerly winds (215–285◦ )         dou et al., 2005; de Gouw et al., 2008). Here, CO shows two
were dominant. They were associated with the highest wind             increases on 21 July. The first increase occurs during morn-
speed (0.3 m s−1 to 7.1 m s−1 ) and the lowest temperature:           ing hours with little dispersion, very low wind speed, with
the average wind speed was 3.7 (± 1.5) m s−1 associated with          varying wind direction. Since CO correlates with toluene
an average temperature of 16.8 (± 3.0) ◦ C (Fig. 2). Some pe-         during this first increase, CO is predominantly of primary
riods under influence of southeasterly to southwesterly winds         origin. The second increase is observed for the evening hours
were also encountered. They were characterized by the low-            and is much more pronounced than those observed for the
est wind speed (2.1 m s−1 on average, ranging from 0.1 m s−1          other primary anthropogenic VOCs. Hence, during event 4,
to 5.9 m s−1 ) and the highest temperature (from 13.2 ◦ C to          CO might be of both primary and secondary origin. Besides,
29.2 ◦ C, with an average value of 20.3 ◦ C). This last type of       since it exhibits a substantial atmospheric lifetime of about a
air mass is distinguished in Figs. 2 and 3 by a grey-shaded           month (Parrish et al., 1998), long-range transport of CO can-
area. These events under southeasterly/southwesterly influ-           not be discarded either. These assumptions are supported by
ence, lasting 24 h up to 68 h, are also numbered from 1 to 6          the evening rise in the concentration of light OVOCs, such as
in the following section.                                             acetaldehyde, propanal or MEK (not shown in Fig. 3) and, as
   Figure 2 indicates that 3 h averaged OM mass concen-               it can be seen in Fig. 2, of the oxygenated PMF component
trations ranged from 0.2 to 9.3 µg m−3 ; about 33 % of the            of OM, OOA, or of ozone (not shown here) during the same
data were above the average value of 1.66 µg m−3 . Like the           event (end of 21 July).
gaseous compounds, the mass concentration of particulate                 Finally, the evolution of the VOCs is consistent with the
organic matter is lower than in other megacities: concentra-          air mass classification of Freutel et al. for the MEGAPOLI
tions of organic matter (PM1 ) could reach up to 80 µg m−3            campaign period, which was carried out using the FLEX-
in March 2009 in Mexico City (Mexico) (Aiken et al., 2009)            PART simulations (Stohl et al., 2005; Freutel et al., 2013a).
and 60 µg m−3 in summer 2008 in Beijing (China) (Zhang                Hence, for consistency purposes, the same terms qualifying
et al., 2011), respectively, and never less than 10 µg m−3 .          the air masses, “Atlantic Clean” for plumes with high wind
Moreover, in Europe, OM mass concentrations (PM1 ) as                 speed and low temperature and “Atlantic Polluted” when air
low as those observed at SIRTA have been measured at the              masses are characterized by low wind speed and high tem-
Jungfraujoch remote site (Switzerland), where summertime              perature, will be used in the following section.
concentrations (August 2005) were ranging from about 0.5                 The different particulate and gaseous compounds appear to
to 3.5 µg m−3 (Cozic et al., 2008).                                   be strongly impacted by the origin of the air masses arriving
                                                                      at SIRTA during the MEGAPOLI summertime campaigns.

Atmos. Chem. Phys., 14, 10439–10464, 2014                                             www.atmos-chem-phys.net/14/10439/2014/
W. Ait-Helal et al.: Volatile and intermediate volatility organic compounds in suburban Paris 10447
Table 4. Toluene and i-pentane mean concentrations in different cities worldwide.
Location Period Site Toluene i-Pentane Reference
(ppb) (ppb)
Beijing (China) Sum. 2006 urban 19.44 17.70 Duan et al. (2008)
Karachi (Pakistan) Win. 1998 urban 7.10 12.10 Barletta et al. (2002)
Tokyo (Japan) Sum. 2007 urban 2.14 4.21 Yoshino et al. (2012)
Win. 2007 10.10 2.87
Mexico City (Mexico) February 2002 urban 13.45 17.02 Velasco et al. (2007)
and April–May 2003 rural 1.89 5.82
Pasadena (suburb of May–June 2010 suburban 0.58 1.56 CalNex framework
Los Angeles, USA)
London October 2006 urban 1.85 nm Langford et al. (2010)
(United Kingdom) 2008 urban, K. 1.00 nm von Schneidemesser
et al. (2010)
Zürich (Switzerland) Win. 2005/2006 urban, B. 1.25 nm Legreid et al. (2007)
Sum. 2005 1.43 nm
Paris (France) Sum. 2009 urban, B. 0.73 0.73 MEGAPOLI framework
Win. 2010 (LHVP) 0.79 0.77
Dunkerque (France) 2002–2003 urban, I. 1.06 0.94 Badol et al. (2008)
Donon (France) 1997–2006 rural 0.16 0.21 Sauvage et al. (2009)
Peyrusse-Vieille (France) 2000–2006 rural 0.11 0.14 Sauvage et al. (2009)
Tardière (France) 2002–2006 rural 0.27 0.21 Sauvage et al. (2009)
Paris (France) Sum. 2009 suburban 0.20 0.33 This work
Win. 2010 (SIRTA) 0.32 0.42
Sum.: summer; Win.: winter; K.: kerbside; B.: background; I.: industrial; nm: not measured.
The pollutant concentrations were low or high as the air mass lower than at other urban/suburban sites in Europe (Legreid
was characterized by either high or low wind speeds. et al., 2007; Langford et al., 2010; von Schneidemesser et
al., 2010). Even the French urban/urban background areas,
3.3 Concentration levels of VOCs: Paris vs. other including LHVP, have systematically higher VOC mean con-
areas centrations than SIRTA, by a factor of up to 15 (Badol et al.,
2008; Gros et al., 2011). Finally, the mean concentrations of
Table 4 compiles mean concentrations of toluene and i- anthropogenic VOCs (aromatic and alkanes) at SIRTA are
pentane, two markers of vehicular exhaust and evaporation as low as those measured at French remote sites (Sauvage
emission sources, measured at different locations, includ- et al., 2009) from the EMEP network (European Monitoring
ing megacities, European urban and suburban areas, and dif- and Evaluation Programme). The predominance of oceanic
ferent areas in France. As VOC emissions are rapidly de- air masses with the highest wind speed arriving at SIRTA,
creasing (Warneke et al., 2012), only observations performed both “Atlantic Clean” or “Atlantic Polluted”, favors the dis-
within the last 15 years have been reported in Table 4. Mean persion of pollutants in the Paris region (Sect. 3.2).
concentrations of these VOCs observed at LHVP are also
reported in Table 4. SIRTA exhibits the lowest VOC mean
concentrations among all these data sets. Toluene mean con- 4 Anthropogenic emissions of gaseous organic carbon
centrations in other megacities range from 0.58 to 19.44 ppb: present over suburban Paris
the highest value, measured in summer at an urban site
of Beijing (Duan et al., 2008), is a hundred times as high 4.1 Method
as the summertime toluene mean concentration at SIRTA
(0.20 ppb). Higher i-pentane levels in other megacities are The analysis of the correlations between pairs of trace gases
also observed. In winter, for instance, the i-pentane mean is a first step towards the identification of the different pro-
concentration at SIRTA (0.42 ppb) is 7 times lower than the cesses governing the evolution of the compounds, includ-
minimum mean concentration which was measured in Tokyo ing the emissions, while the effect of dilution is minimized
(2.87 ppb) (Yoshino et al., 2012). At the suburban site of (Roberts et al., 1984). The method relies on the hypothe-
Paris, the only European megacity with more than 10 mil- sis of absent or only little chemical loss processes of the
lion inhabitants listed by the United Nations (United Na- compounds. Information on the emission sources is given
tions, 2012), the concentrations of these two VOCs remain by the quality of the linear regression fit (R 2 ) between VOC
www.atmos-chem-phys.net/14/10439/2014/ Atmos. Chem. Phys., 14, 10439–10464, 201410448 W. Ait-Helal et al.: Volatile and intermediate volatility organic compounds in suburban Paris Figure 4. Scatterplots of ethylbenzene versus toluene (a), decane versus nonane (b) and i-pentane versus i-butane (c) in suburban (SIRTA) and urban (LHVP) Paris in summer. The fit of correlation of i-pentane versus i-butane at SIRTA (Fig. 5c) does not take into account the upper and lower part of the envelope; SIRTA data are color-coded by the wind direction. pairs with similar atmospheric lifetime and the value of the vides the value of the enhancement ratio (Borbon et al., 2003; slope of the linear regression fit. On the one hand, common Warneke et al., 2007). For each pair of VOCs, the enhance- sources are highlighted by a tight correlation (R 2 value close ment ratio is defined as the enhancement of a VOC rela- to 1) (Parrish et al., 1998). On the other hand, the slope pro- tively to the second one, which is considered as a reference Atmos. Chem. Phys., 14, 10439–10464, 2014 www.atmos-chem-phys.net/14/10439/2014/
W. Ait-Helal et al.: Volatile and intermediate volatility organic compounds in suburban Paris                             10449

Figure 5. Scatterplots of OM versus CO (a) and scatterplots of HOA versus CO (b) in suburban Paris in summer 2009. OM, CO and HOA
were averaged to 1 h.

compound (Hornbrook et al., 2011). Since most NMHCs in             lated following Eq. (1) defined by Borbon et al. (2003):
the Paris agglomeration are strongly impacted by vehicle ex-                        P
haust emissions (Borbon et al., 2013), the enhancement ra-                             j (EFVOC1 , j × fj )
                                                                   ERVOC1 , VOC2 = P                        ,               (1)
tios obtained at SIRTA are compared with the vehicle ex-                               j (EFVOC2 , j × fj )
haust emission ratio derived from emission factors accord-
ing to the method developed by Borbon et al. (2003). This          where ERVOC1 , VOC2 is the emission ratio of the given VOC1
will allow stating if observed enhancement ratios can be ex-       with respect to VOC2 (in ppt ppt−1 ), EFVOCi ,j the emission
plained by traffic emissions alone. Briefly, emission factors      factor of the VOCi for the engine type j (in mg km−1 ) and
(EF) of VOCs at the exhaust were determined in the late            fj the fraction in % of the urban mileage running by the
1990s in France, from vehicles imitating mean urban driving        motor type j . The standard deviation of the ratios is deter-
conditions and using different types of fuels: diesel, gaso-       mined from the standard deviations of the emission factors.
line with or without catalyst (Fontaine, 2000). The experi-        As demonstrated in the Supplement (Sect. S3, Fig. S1), the
mental conditions for the determination of the VOCs emis-          ER determined from Fontaine’s work (2000) are representa-
sion factors by Fontaine (2000) are detailed in the Supple-        tive of northern mid-latitude urban areas.
ment (Sect. S2); values of VOCs EF can be found in Bor-
bon et al. (2003). In 2009–2010, the fleet of vehicles in Paris    4.2   Spatial variability: evidence of regional influences
was composed of 60 % light-duty diesel vehicles and of 40 %              in suburban Paris
gasoline light-duty vehicles equipped with catalytic conver-
                                                                   Summertime correlations of commonly measured VOCs
tors (CCFA, 2011). Emission ratios (ER) were then calcu-
                                                                   with the same atmospheric lifetimes at SIRTA and LHVP

www.atmos-chem-phys.net/14/10439/2014/                                           Atmos. Chem. Phys., 14, 10439–10464, 2014
10450 W. Ait-Helal et al.: Volatile and intermediate volatility organic compounds in suburban Paris
are illustrated in Fig. 4. As expected, the comparison of the tribution is influenced by emissions from the whole Paris
scatterplots exhibits higher concentrations for anthropogenic area as well as from the advection of industrial emissions
VOCs in urban Paris than in suburban Paris as a result of the along the Seine River for light alkanes. Thus, the SIRTA site
emission density and dilution. However, the shape and the is representative of regional anthropogenic footprint emis-
slope of the scatterplots are fairly consistent between urban sions. Similar conclusions were obtained from the observa-
and suburban Paris in summer and in winter (not presented tions of the particulate matter: the different organic and in-
here). organic components of the PM1 particles exhibit the same
Aromatic compounds and heavy alkanes show a narrow trend at the different MEGAPOLI measuring sites (Crippa et
distribution with very good correlation (R 2 > 0.80, Fig. 4a al., 2013a; Freutel et al., 2013a).
and b). The emission enhancement ratios in urban and sub-
urban Paris, given by the value of the linear regression fit
slopes, agree well within ± 2 % and ± 18 % for aromat- 5 Estimation of the contribution of I / VOCs to SOA
ics and alkanes, respectively, regardless of the seasons and formation in summer
within the analytical uncertainties (Fig. 4a and b). The emis-
Two different approaches can be used to quantify and qual-
sion enhancement ratios determined during MEGAPOLI are
ify the contribution of VOC and IVOC precursors to the SOA
also very close to the emission ratio (reported on Fig. 4) in
formation: the integrated approach and the time-resolved ap-
vehicle exhaust determined from Eq. (1). These observations
proach. This chapter focuses on the description of these two
point to traffic emission as the dominant source of aromatics
approaches and a discussion of the obtained results.
and alkanes > C5 across the Paris basin in accordance with
Borbon et al. (2013). 5.1 Method
Scatterplots of light alkanes obtained at SIRTA and LHVP
are overlaid (Fig. 4c), indicating that sources of the same 5.1.1 Estimation of the SOA from its gaseous
composition affect their distribution at each site. These light precursors: the integrated approach
alkanes are known to be emitted from common sources,
i.e., vehicle fuel combustion and evaporation (Monod et al., The method developed by de Gouw et al. (2005, 2008), the
2001; So and Wang, 2004; Russo et al., 2010). However, the so-called integrated approach, is first applied to our data.
multi-shape distributions imply that sources with different This approach consists of the apportionment of 1OM / 1CO
iso-alkanes composition are driving their distribution in the enhancement into its primary component (1POA/1CO) and
Paris area. The scatterplot of SIRTA is color-coded as a func- its secondary component (1SOA/1CO). 1OM / 1CO is de-
tion of the wind direction. When SIRTA is downwind of the rived from the scatterplot of OM vs. CO. Experimentally,
225–330◦ sector, enrichment in either i-pentane (upper part the 1SOA/1CO enhancement is the difference between
of the envelope) or i-butane (lower part of the envelope) is 1OM / 1CO and 1POA/1CO, as illustrated by Eq. (2):
observed. Plumes arriving from the northwest at SIRTA flew
1SOA
1OM
1POA
over the Seine basin. In spring 2007, Gaimoz et al. (2011) = − . (2)
1CO experimental 1CO 1CO
also observed enrichment in i-butane concentrations in urban
Paris when sampling oceanic air masses which had crossed In addition, a theoretical 1SOA / 1CO enhancement is de-
this region. The Seine basin is an important industrialized rived from the product of the VOC emission ratios to CO and
area including different industries: chemistry, surface treat- the SOA yields of these VOCs, as described by Eq. (3):
ment and oil and gas production (iREP, 2012). When the
1SOA X
upper and lower part of the envelope, which correspond to = ERi × YSOA,i , (3)
1CO theoretical i
the data associated with the 225–330◦ wind sector, are not
taken into account, a good correlation is obtained at SIRTA with ERi and YSOA,i the emission ratio and the SOA yield
(R 2 = 0.66) with a slope of 2.09 (ppt ppt−1 ) for the Paris formation of the VOCi , respectively. The comparison of
wind sector. Contrary to the aromatic compounds and the these experimentally and theoretically derived SOA enhance-
heavy alkanes, the enhancement ratio of the light alkanes de- ments allows for the quantification of the effective contribu-
termined at SIRTA is very different from the vehicle exhaust tion of the measured VOCs to the secondary formation of the
emission ratio, namely by a factor of 4 to 5. This difference aerosol particles. Based on the emission ratio, this approach
may indicate either a difference in gasoline composition or considers that the amount of emitted I / VOC reacts entirely
emission sources other than vehicular exhaust. This assump- to form SOA. This approach leads then to an upper limit for
tion is supported by the low wintertime i-pentane/i-butane the estimation of SOA formation from a gaseous precursor.
ratio obtained at SIRTA from the VOCs’ scatterplot (0.70, Since CO is used as a primary anthropogenic tracer, the es-
R 2 = 0.65 – not shown here). timation of the SOA formation can be established by only
Finally, the analysis of VOC/VOC correlations highlights considering VOCs of primary anthropogenic origin. Here,
the similar distribution of anthropogenic VOCs across the the measured n-alkanes of intermediate volatility, measured
Greater Paris region, and so their common sources. This dis- at SIRTA, will be included for the first time.
Atmos. Chem. Phys., 14, 10439–10464, 2014 www.atmos-chem-phys.net/14/10439/2014/W. Ait-Helal et al.: Volatile and intermediate volatility organic compounds in suburban Paris 10451
5.1.2 Estimation of the SOA from its gaseous 1. The SOA yields. The SOA yields used here (provided in
precursors: the time-resolved approach Table 3) are the most recent ones determined in chamber
experiments, and the most relevant to the MEGAPOLI
A second method, the so-called time-resolved approach campaign conditions. SOA yields are known to be
adapted from Sjostedt et al. (2011), is applied to the data. highly influenced by the experimental conditions in the
Like the first approach, the aim of the time-resolved ap- chamber, especially by the NOx concentrations and the
proach is to quantify the contribution of the different anthro- organic mass concentrations (COA ) (Hildebrandt et al.,
pogenic SOA precursors. However, unlike the first approach, 2009; Presto et al., 2010; Aumont et al., 2012; Tkacik
the chemical atmospheric removal of the SOA precursors is et al., 2012). At SIRTA, on average, COA = 1.8 µg m−3
considered, rather than their emission ratio. In this approach, and the NOx concentration is 6.9 ± 4.8 ppb. These en-
it is assumed that the I / VOCs are removed from the atmo- vironmental conditions correspond to low-COA and
sphere only by reaction with the hydroxyl radical. Their reac- low-NOx conditions, regarding chamber experiments.
tion with ozone or the nitrate radical is slow enough (Atkin- While chamber experiment conditions under which
son and Arey, 2003) to be neglected in SOA formation, even SOA yields are determined are quite variable, they
though the SOA yields from their reaction with NO3 can be never meet both the low-NOx and low-COA criteria.
much higher, as observed for isoprene and the monoterpenes SOA yields of the aromatic compounds were either de-
(Fry et al., 2009, 2011). termined at low-NOx or high-NOx (Ng et al., 2007a)
Thus, in this approach, the I / VOCs are assumed to follow conditions but always at high COA = 40 µg m−3 (see
a pseudo first-order kinetic reaction, such as the Supplement, Sect. S4 for details). Conversely SOA
yields of the volatile and C13 –C16 intermediate volatile
d [VOCi ]
− = kVOCi [VOCi ] [OH] , (4) n-alkanes were determined at high or low COA but al-
dt ways under high-NOx conditions (Lim and Ziemann,
with kVOCi the rate constant of VOCi with the OH radi- 2009a; Presto et al., 2010). Therefore, the SOA forma-
cal (cm3 molecule−1 s−1 ), [OH] the concentration of the hy- tion will be studied using two sets of SOA yields for
droxyl radical (molecule cm−3 ), and [VOCi ] the concentra- the C12 –C16 n-alkanes and the aromatics, from the in-
tion of a given VOC. The initial concentration of a given tegrated approach only. The first SOA yield values re-
VOC, [VOCi ]t=0 , is then retrieved from Eq. (4), such as in ported in Table 3 are those determined under the most
Eq. (5): relevant atmospheric conditions for this study, i.e., low
COA = 2 µg m−3 (but high NOx ) for the IVOCs and low-
[VOCi ]t=0 = [VOCi ]SIRTA,t × ekVOCi ×[OH]×1t , (5) NOx (but high COA = 40 µg m−3 ) for the aromatics. The
second SOA yield values are those obtained from cham-
where [VOCi ]SIRTA,t is the VOCi concentration measured at ber experiments performed under similar COA and NOx
SIRTA (ppt) and 1t the time elapsed since the emission. The conditions, i.e., high NOx and high COA = 40 µg m−3 .
removal of a gaseous compound, 1[VOCi ], is therefore esti- The second set of SOA yields will be used to com-
mated from Eq. (7): pare the contribution to SOA formation of the C12 –
C16 n-alkanes against the contribution of the whole
1 [VOCi ] = [VOCi ]t=0 − [VOCi ]SI RT A,t (6) VOC set. C9 –C11 n-alkanes SOA yields are those de-
termined by Lim and Ziemann (2009a) under high NOx
k ×[OH×1t]
1 [VOCi ] = [VOCi ]SIRTA,t × e VOCi − 1 . (7) and high COA (400 µg m−3 < COA < 1600 µg m−3 ) con-
ditions. High-NOx SOA yields are much more impor-
Finally, for a given I / VOC, the result obtained in Eq. (7) tant than low-NOx SOA yields for the n-alkanes (Loza
is multiplied by the SOA yield (Table 3), resulting in the et al., 2014). Besides, the higher COA is, the higher the
amount of SOA produced by the given I / VOC at time t. SOA yield is (Hildebrandt et al., 2009; Presto et al.,
The total SOA mass concentration estimated on a temporal 2010; Aumont et al., 2012; Tkacik et al., 2012).
basis is obtained by adding the amount of SOA produced by
all the VOCs, as expressed by Eq. (8): 2. The VOC/CO emission ratios. The ER to CO are the
X ones determined for the Paris area based on the LHVP
SOAestimated = 1VOCi × YSOA,i . (8) ground site and airborne data by Borbon et al. (2013).
i
While the SIRTA site was rarely downwind of the Paris
5.1.3 Assumptions in the different approaches plume, Borbon et al. (2013) and Boynard et al. (2014)
showed that VOC/VOC ER were usually consistent
Both estimations of the SOA amount formed from the oxi- between northern mid-latitude urban areas. However,
dation of I / VOCs rely on different assumptions that are dis- the C11 –C16 alkanes were not measured at LHVP. For
cussed in the following section. Additional details on the as- this reason, their emission ratios have been estimated
sumptions can be found in the Supplement (Sect. S4). from the ER determined at vehicle exhaust by Fontaine
www.atmos-chem-phys.net/14/10439/2014/ Atmos. Chem. Phys., 14, 10439–10464, 2014You can also read