WASAGA BEACH ACCOMMODATION DEVELOPMENT PLAN - MARKET & FINANCIAL ANALYSIS - Town of Wasaga Beach
←
→
Page content transcription
If your browser does not render page correctly, please read the page content below

WASAGA BEACH
ACCOMMODATION
DEVELOPMENT PLAN -
MARKET & FINANCIAL
ANALYSIS
Downtown Development Master Plan for Wasaga
Beach, ON

CBRE File No.:16-APPRHOTELS-0085

January 2017
Prepared for:                                 Prepared by:
The Corporation of the Town of Wasaga Beach   CBRE Limited | Tourism & Leisure Group
30 Lewis Street                               145 King Street West, Suite 1100
Wasaga Beach, Ontario                         Toronto, Ontario
L9Z 1A1                                       M5H 1J8

Downtown Development Master Plan
                                                                                                       January 2017
 Wasaga Beach, ON

Table of Contents

Introduction .............................................................................................. 1
Economic and Tourism Overview ................................................................ 6
  Economic Overview                                                                            7
  Tourism Overview                                                                           14
Waterpark Hotel ...................................................................................... 25
 Introduction                                                                                          26
 Wasaga Beach Waterpark Hotel Concept and Capital Costs                                                31
 Market Analysis                                                                                       33
 Subject Waterpark Hotel Utilization Projections                                                       38
 Subject Operating Projections                                                                         40
 Investment and Implementation Considerations                                                          43
Boutique Hotel ........................................................................................ 44
  Introduction                                                                                          45
  Resort and Development Profile                                                                        46
  Boutique Hotel Concept and Capital Cost Estimate                                                      46
  Market Analysis                                                                                       48
  Subject Utilization Projections                                                                       54
  Subject Operating Projections                                                                         55
  Investment and Implementation Considerations                                                          58
APPENDIX A
  Assumptions and Limiting Conditions                                                                       i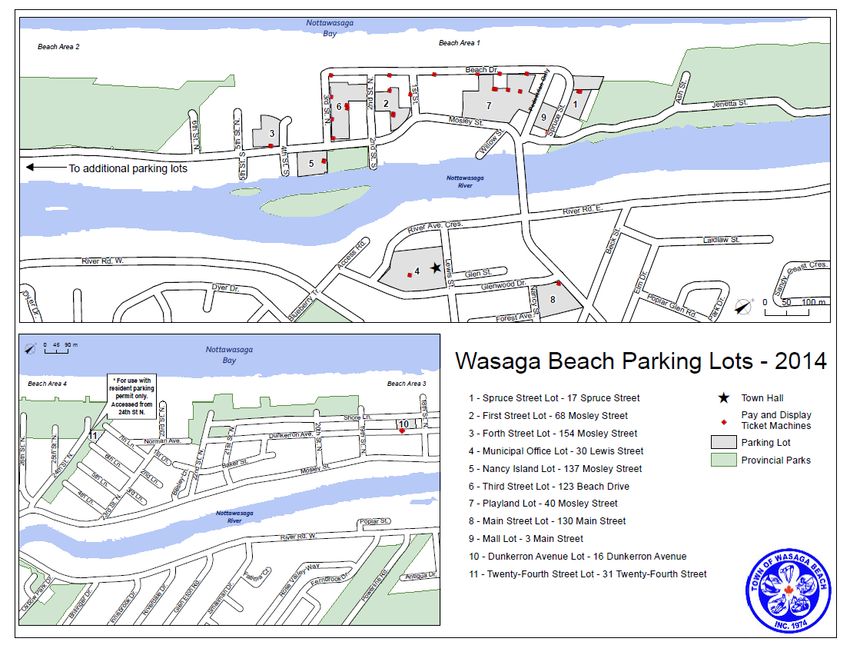

Introduction

Introduction: Wasaga Beach Accommodation Development Plan – Market & Financial Analysis

Downtown Development Master Plan
 2       INTRODUCTION                                                                Wasaga Beach, ON
                                                                                         January 2017

INTRODUCTION

Study Background
Over the past 10 years, there have been a number of development plans and studies which have examined
various levels of hospitality and tourism development initiatives for Wasaga Beach. These development
programs have ranged from an extensive mixed-use, four season resort development on Beach 1 & 2 to
stand-alone accommodation developments.

A fire destroyed much of the privately-owned properties along the Wasaga beachfront in 2007, and a
developer purchased many of the waterfront properties in 2008/09 with a plan for re-development.
Proposed in 2009, the Blue Beach Avenue Development called for a $500 Million, 15 year development
program, including a 250-unit four season Waterpark Hotel, a 200-unit full service resort hotel, a 70,000
square foot Family Entertainment Attraction, a 120,000 square foot retail and foodservice commercial
development and a 625-unit resort residential development. Proponents of the project purchased many of
the existing businesses along the waterfront for enterprise value in order to develop the lands, however, they
ran into financial difficulties and filed for bankruptcy in 2010. CBRE Hotels (formerly PKF Consulting) was
actively involved in the market and financial assessment of that project.

CBRE Hotels (formerly PKF Consulting) has also completed a number of studies on behalf of the Town of
Wasaga Beach and private sector interests over the past 5 years which have considered:

     •   A stand-alone branded hotel;
     •   A mid-scale extended stay hotel of between 65 to 80 units, located within the Upper Main or Lower
         Main area of Wasaga Beach; and
     •   A mixed-use Resort Development on Beach 2 with 80 units.

In each of these previous studies, the findings indicated that a stand-alone hotel or resort would not be able
to support its development costs off cashflow due to the highly seasonal nature of demand which is largely
comprised of summer-time leisure tourists. In order for any hotel/resort development to attract a developer,
the equity requirements for the project would need to be mitigated by other sources of revenue to meet the
return expectations on the project as a whole for the developer. Typical sources of additional revenue could
be realized through the development and sale of adjacent resort residential units, which in turn could
generate acceptable development profits to attract a developer to the project. Whether the resort setting is
one of sun and sand, or snow and ski, or an indoor waterpark, destination resorts commonly feature some
form of real-estate ownership programs.

Through CBRE’s previous work in the Town’s hospitality sector, the seasonality of Wasaga Beach as a
destination was a barrier to the long-term viability of stand-alone hotel development. This has had a strong
influence on the determination of the most appropriate “Tourist District” facility program for Wasaga Beach.

                                                         CBRE LIMITED | CBRE TOURISM & LEISURE GROUP
Downtown Development Master Plan
 Wasaga Beach, ON                                                                                        3
 January 2017

To date, the Town of Wasaga Beach has been unsuccessful in its efforts to attract a hotel developer to come
into the community. In 2015, the Town of Wasaga Beach took the bold initiative to purchase over 70% of
the commercial properties at Beach 1 and 2, and engaged in an extensive community consultation process
which has resulted in the subject Downtown Development Master Plan.
Hospitality and Tourism Development Options

For the subject Downtown Development Master Plan for Wasaga Beach, we looked at two different
accommodation-based commercial development opportunities for the Beach Tourist District:

        1. Waterpark Resort Attraction on Beach 2 – to generate new tourist and residential demand

        2. Boutique Hotel on Beach 1 – to support other commercial / residential components

For each of the two development options, we have undertaken the following analysis:

            •   Evaluated market potential
            •   Recommended a facility program
            •   Projected future occupancy, utilization, average daily room rate, per spends and operating
                performance over a five-year projection period, allowing for economic conditions as well as
                supply and demand growth prospects
            •   Provided an overview of the investment and implementation considerations

In meeting the study objectives the results and analysis within the preceding report has involved the following
steps:

    •   Discussions with key regional stakeholders;
    •   A review of strategic planning documents, tourism-related strategies and population and growth
        projections for Wasaga Beach;
    •   A review of the most recent Statistics Canada’s Travel Survey of Residents in Canada (TSRC) and
        International Travel Survey (ITS) for visitor volumes to Simcoe County (CD 43);
    •   A review of comparable facilities, attractions and accommodations in Ontario;
    •   A review of existing resort accommodation facilities located in Ontario, including an assessment of
        facilities offered and proposed, published room rates and market demand segmentation;
    •   An estimate of future growth in supply of, and demand for hotel accommodation in the competitive
        market area;
    •   Preparation of development programs for the proposed facilities; and
    •   Preparation of preliminary utilization and operating projections for the subject proposed hotels for
        the first five years of operation, based on identified sources of market demand and attraction
        generated demand.

CBRE LIMITED | CBRE TOURISM & LEISURE GROUP
Downtown Development Master Plan
4 INTRODUCTION Wasaga Beach, ON
January 2017
Preliminary Conclusions
Based on our market and financial analysis, presented herein, the following preliminary conclusions are
offered.
Waterpark Hotel
A 250-unit resort hotel featuring a 60,000 square foot indoor waterpark, restaurants, meeting
space, arcade and retail amenities has been proposed as part of the Resort District on Beach 2.
This development opportunity is seen as a major attraction for Wasaga Beach, which will
generate year-round demand for the community, inducing increased levels of visitation,
particularly from the family market, with young children as well as the meeting/conference
segment. However, capital costs for this type of development will be significant, at an estimated
$125 Million or $500,000 per room and as such, this development will likely have economic and
investment challenges. In order for a developer to generate an expected return on equity of at
least 15%, the developer would need to bring $50 Million in equity to the project; support $50
Million in debt from operating cash flow; and would still require another $25 Million in
unencumbered equity (with no expectations of return) for the project. Sources for the
unencumbered equity would likely be provided through the profits generated through adjacent
residential sales. Unless the waterpark hotel is a significant catalyst to sell additional residential
units in the Resort District, this development opportunity is not seen as a short term initiative, but
rather part of a Long Term development opportunity for the Town. Furthermore, the likelihood of
sourcing an interested developer to invest $50 Million in equity for this project will be difficult.
Boutique Hotel
An 80-room boutique hotel as part of a mixed-use development adjacent to the Event Plaza at
the Main End of the Beach is seen as a development opportunity which has more likelihood of
being realized in the short term. This development is seen as a part of an overall mixed use
resort residential development, which will include 245 to 400 residential units, as well as retail
and foodservice offerings. It is assumed that most of the purchasers of the residential units will
likely only use their units while vacationing in the area, and for the balance of the year, will
return the unit to the resort operator’s rental pool. The Boutique Hotel will in turn manage the
rental pool on behalf of the owners, in addition to operating an 80-room hotel for transient use.
With capital costs in the order to $15 Million ($180,000 per room), this development opportunity
has a stronger likelihood of attracting a private sector investor in the near term due to its
requirement for a much lower investment of approximately $5.5 Million in equity, as compared
to a Waterpark Hotel. With operating revenues derived from the hotel and a rental pool, the
project could support $9 Million in debt, while providing an adequate return on equity.
CBRE LIMITED | CBRE TOURISM & LEISURE GROUPDowntown Development Master Plan
Wasaga Beach, ON 5
January 2017
Entertainment Zone
A third component, an Entertainment Zone to complement accommodation / commercial /
residential components at Beach Areas 1 and 2, is not currently defined at a level in which we
could prepare a market or investment analysis, but should be considered as part of the overall
conceptual plan.
In order to bring back the “fun” of Wasaga Beach, an entertainment zone has been proposed for
the central core of the beachfront, between the Main End Event Plaza and the Resort District. This
area will offer seasonal outdoor rides and attractions, geared to all age groups, while also
providing a park-like setting with trails, water play areas, and pristine views of the beachfront
which can be utilized on a year-round basis. While the Town may choose to be the catalyst
developer of this opportunity in the short term, as the full Master Plan is realized, a private sector
developer may also be attracted to own and operate the attraction and/or partner with the Town
in its development. As noted, we have not prepared projections for this opportunity.
The following sections identify the market dynamics that justify the subject development programs, followed
by the full operating projections for each component.
CBRE LIMITED | CBRE TOURISM & LEISURE GROUPRegional Overview
Economic and Tourism Overview
Economic and Tourism Overview: Wasaga Beach Accommodation Development Plan – Market & Financial AnalysisDowntown Development Master Plan
ECONOMIC AND TOURISM OVERVIEW 7
Wasaga Beach
ECONOMIC OVERVIEW
Town of Wasaga Beach
Featuring the world’s longest freshwater beach at a length of 14 kilometres, Wasaga Beach has been
considered one of the premier tourist destinations in Ontario for over a century. The Town of Wasaga
Beach has a rich history as one of Ontario’s premier summer tourist destinations dating back to the early
1800’s. The area’s original settlement was a logging and fishing village settled along the shores of the
Nottawasaga River, a main waterway that runs through the Town today. In the early 1900’s the region
progressively transformed into a popular tourist destination for the military families at nearby Base Borden,
and GTA residents visiting the area to enjoy the white-sand, freshwater beach.
The Town of Wasaga Beach was incorporated in 1974 when the Wasaga Beach Provincial Park was
established. Wasaga Beach Provincial Park, covers a natural area of 6.8 hectares (731,950 sq.ft.) and
protecting wildlife habitat and nesting shorebirds.1 There are six public beach areas numbered from 1 to 6
(one long beach divided into numbered sections), as well as the New Wasaga and Allenwood beaches
which are cut off from the other beaches by the mouth of Nottawasaga River, however are frequented just
as much by seasonal residents and tourists. Specifically, Beach 1 offers all of the bars, beach-themed shops
and fast food restaurants, comfort stations and playground equipment, Beaches 2 to 4 feature shaded
trees, comfort stations and picnic areas and Beaches 5 and 6 are utilized by more seasonal and year-
round cottage owners. In addition Beach 3 and Allenwood also feature Ontario Kiteboarding Association
(OKA) Official Launch zones. The Town has established a positive relationship with Wasaga Beach
Provincial Park, partnering on a number of tourism related initiatives geared to improve both the quality of
the beach and its use by residents, seasonal cottagers and tourists.
Wasaga Beach is located 25 minutes east of the Blue Mountain Resort area, a four season destination
which has evolved from a winter alpine skiing resort, a 30 minute drive from Barrie and 1.5 hour drive
from Toronto.
Population
The Town has grown from a cottage community to a full-service urban municipality, with a current
population of over 19,645 permanent residents. This growth has been particularly strong since 1996, when
Wasaga Beach was seen as one of the fastest-growing municipalities in Canada. The Town also has
approximately 9,000 seasonal residents, who own cottages/seasonal homes in the area.
Continued population growth is expected for Wasaga Beach, with the total population projected to reach
21,000 persons by 2021 and 27,500 by 2031, as per the County of Simcoe Official Plan. Data relating to
Wasaga Beach’s local economy are included in the following table:
1
Source: Ontario Parks
CBRE LIMITED | CBRE TOURISM & LEISURE GROUPDowntown Development Master Plan
8 ECONOMIC AND TOURISM OVERVIEW
Wasaga Beach
WASAGA BEACH(CMA) ECONOMIC PROFILE
DEMOGRAPHICS
Average Annual Growth
Population % of Canadian % Change
Rate
2016 Estimate Total 2011-2016
2011-2016
19,645 0.1% 9.8% 2.0%
Household Income – 2016 Average
% Above/Below National Total Income % Canadian Per Hhlds.
Average 2016 Estimate Total Capita $100,000+
17.6% Below $705,939,000 0.1% $35,935 30.0%
Household Spending – 2016 Average
% Above/Below National Total Household Spending % Canadian Per Per
Average 2016 Estimate Total Capita Household
13.1% Below $847,952,231 0.1% $43,164 $97,142
Source: Sitewise, 2016
Economic data relating to Wasaga Beach is summarized below, with further detail in the infographic on the
following page.
• As one of Canada’s fastest growing communities situated on the world’s longest freshwater beach,
Wasaga’s population has grown by approximately 1,750 people in the past 5 years, specifically
expanding by 9.8% over 2011 levels to reach an estimated 19,650 persons in 2016.
• At $81,000 in 2016, the average household income in Wasaga Beach is estimated to be 18%
below the national average, with only 30% of households making more than $100,000 per year at
a per capita income of $35,900.
• In line with household income, household spending in Wasaga Beach is about 13% below the
national average; with a per capita spend of approximately $43,200.
• At an average of $17,620, shelter represents the highest level of household spending, with
recreation representing about $4,600 per household.
• The population of 19,645 residents in 2016 represented 8,900 households, at an estimated 2.23
persons per household.
• The median age in Wasaga Beach was 54.4 years in 2016, with a fairly equal distribution of men
to women.
CBRE LIMITED | CBRE TOURISM & LEISURE GROUPDowntown Development Master Plan
ECONOMIC AND TOURISM OVERVIEW 9
Wasaga Beach
CBRE LIMITED | CBRE TOURISM & LEISURE GROUPDowntown Development Master Plan
10 ECONOMIC AND TOURISM OVERVIEW
Wasaga Beach
The top PRIZM5 classifies Canadians into one of 68 categories, based on their demographics, marketplace
preferences and psychographic social values. Based on CBRE research and analysis, the top 5 lifestyle
types in Wasaga Beach by population include segments largely comprised of middle-aged and older
residents, many of whom are empty nesters. With a significant proportion of Wasaga’s population
comprised of retired individuals, the Town is also looking to attract a growing families, young couples,
resort recreational residents, as well as retirees.
WASAGA BEACH TOP 5 PRIZM5 LIFESTYLE TYPES BY POPULATION – 2016 ESTIMATES
PRIZM5 Lifestyle Population in Description
Segment(#) Wasaga Beach
Traditional Town 6,767 - Middle-aged and older middle-income homeowners
Living (47) - Enjoy the great outdoors, hunting, fishing, gardening and
cycling in their free time
- When in need of a change of scenery, they might head for the
low-key comforts of their favourite campground
Heartland 6,485 - Rural, older and mature lower-middle-income couples
Retirees (33) - Canada’s highest concentration of Baby Boomers
- Empty nester couples & retirees living in unpretentious single-
detached houses and mobile homes
- Enjoy camping and gardening, as well as almost anything with
a motor (pickups, power boats, RVs, snowmobiles etc.)
Country Acres 2,320 - Middle-aged and older rural couples and families
(35) - 9/10 are homeowners, typically living in modest single-family
houses
- Spend their leisure time outdoors, enjoying hunting, fishing,
boating and camping
- Typically have to leave town for their entertainment (ex.
exhibitions featuring cottages, boats, golfing and pets)
Emptying Nests 1,306 - Older, upper-middle-income suburban couples
(10) - Consist of married couples over 55 whose children have flown
the coop
- Tend to live in single-detached and row houses in
developments built over the last thirty years
- Enjoy cultural activities, going to the ballet and opera
performances, community theatres and film festivals, attend
exhibitions (craft, cottage, investment & travel shows)
- Many have the time and money to travel, allowing for long-
haul international trips
Serenity Springs 1,126 - Mature, lower-middle-income town singles and couples
(54) - Mostly a retirement lifestyle, with more than half the household
maintainers over 55 years old and a third are over 65
- Lower-middle-income seniors who are aging in place and
watching their wallets
- Traditional households where men fish and go boating, while
women garden and bake – both enjoy craft and home shows
- Often must travel distances for entertainment options
- Low rates for visiting other countries, vacation means driving to
a provincial park to go boating or bird watching
Source: Environics Analytics, Sitewise 2016
CBRE LIMITED | CBRE TOURISM & LEISURE GROUPDowntown Development Master Plan
ECONOMIC AND TOURISM OVERVIEW 11
Wasaga Beach
In line with the population clusters currently represented in the Top 5 Prizm categories for Wasaga
Beach, there are a number of residential developments currently under construction or recently
completed that are geared towards family, resort recreational residents and empty nesters. Some
specific examples follow:
o Villas of Upper Wasaga by Baycliffe Homes Inc. is a new single family home
development under construction at 26 Wasaga Sands Drive. The development has
367 units with prices ranging from $379,990 to $464,990. Phase 1 homes are
already sold out, with Phase 2 registration currently occurring.
o BEACH20 luxury 3-bedroom townhouses are currently under development by
Bremont Homes in Wasaga Beach, at 878 Mosley Street. The development will have
a total of 15 units and completion is scheduled for May 2017. Available units are
starting from the low $400,000’s.
o In 2016, the master-planned community of Georgian Sands by Elm Developments
was announced. This new four-season community will be located at 305 River Road
West beside a golf course and will feature landscaped parks and trails and new
cafes and retail shops within walking distance. This townhouse and single family
home development will have a total of 273 units and is currently in the
2
preconstruction phase.
Transportation
The Town of Wasaga Beach is serviced by the main north-south highways of HWY 400 and 27, which
direct travelers to the Town via County Road 92 and Highway 26. During the peak summer months, the
Town of Wasaga Beach has historically indicated that traffic congestion problems can occur. The
congestion issues are due in part to the increased visitation from cottagers and tourists and the lack of road
lanes, as the primary access routes within the town are two lane highways.
The nearest public airport to the Town of Wasaga Beach is the Town of Collingwood Municipal Airport. It is
equipped with a 5,000-foot jet runway capable of handling small jets. Additionally, the Town of Wasaga
Beach is approximately 125 km from Lester B. Pearson International Airport, which has daily flights to most
major national and international destinations.
Labour Force
The top five industries in Wasaga Beach by number of employees are outlined in the following table:
TOP 5 INDUSTRIES BY LABOUR FORCE – WASAGA BEACH - 2016 ESTIMATES
Industry Number of Employees % of Total Employees
Retail Trade 1,788 17%
Construction 1,115 11%
Accommodation and Food Services 1,021 10%
Health Care and Social Assistance 1,019 10%
Public Administration 873 8%
Total Labour Force 10,390
Source: Sitewise 2016
2
Source: ww.buzzbuzzhome.com, www.baycliffehomes.com, www.bremonthomes.com, http://elmdevelopments.com
CBRE LIMITED | CBRE TOURISM & LEISURE GROUPDowntown Development Master Plan
12 ECONOMIC AND TOURISM OVERVIEW
Wasaga Beach
Tourism is the main economic driver for the community. According to the County of Simcoe Economic
Development Office, from 2013 to 2015, the fastest growing industries in Wasaga Beach included
accommodation and food services, education services, utilities, and professional, scientific and technical
3
services. The Town of Wasaga Beach has an estimated labour force of 10,390 persons. Currently, the
most significant labour force industry is Retail Trade, employing about 17% of total employees (1,790
persons).
TOP 5 OCCUPATIONS BY LABOUR FORCE – WASAGA BEACH - 2016 ESTIMATES
Occupation Number of Employees % of Total Employees
Sales and Service 3,139 30%
Trades, Transport and Equipment Operators & Related 1,875 18%
Business, Finance and Administration 1,388 13%
Social Science, Education, Government Service & Religion 1,236 12%
Management 879 9%
Total Labour Force 10,390
Source: Sitewise 2016
Sales and Service positions, which include hospitality and tourism, comprise the largest number of jobs,
employing approximately 30% of the labour base. The majority of these positions are seasonal.
The following is a list of recently completed and proposed developments in Wasaga Beach:
• A new Main Street Market opened within the former Pedestrian Mall Area at Beach One in July
2016. The seasonal outdoor Market features local cuisine on a daily basis, free movies on
Wednesdays and live music on Friday and Saturday evenings, and represents a good starting point
to implementing the subject Downtown Master Plan for the Beach area. The programming is slated
to expand in 2017 to Tuesdays to Sundays during the summer months.
• In 2016, the Town of Wasaga Beach retained Altus Group Economic Consulting to review the need
for a secondary school in the Town. Currently, secondary students who live in Wasaga Beach
commute to high schools in Collingwood, Elmvale and Clearview Township. Study results stated
that growing population trends within Wasaga Beach demand the provision of a high school,
which would allow the Town to function as a complete community, enabling them to accommodate
the daily needs of all residents.
• In order to improve lighting quality and increase both energy efficiency and cost savings, new LED
Streetlight installation has taken place over the last two years in Wasaga Beach. A total of 2,112
cobra-head streetlights were upgraded in 2015, and an additional 900 decorative street lights
were upgraded in 2016.
• The Town has been in discussions with the Ontario Lottery and Gaming Corporation (OLG) since
2015, regarding the potential for a gaming facility to be developed in Wasaga Beach. Town
Council has indicated that there is support for a 300 slot casino as part of a mixed-use, larger
resort-style development. OLG anticipates to award the request-for-proposal to an operator by the
end of 2017, at which time the selected operator will be able to decide if/where a new casino
would be located (Wasaga Beach or Collingwood). If the facility were to be located in Wasaga
Beach, it could result in a significant influx in year-round demand for the Town.
3
Source: County of Simcoe Economic Development Office, Data Report: Town of Wasaga Beach, June 2016
CBRE LIMITED | CBRE TOURISM & LEISURE GROUPDowntown Development Master Plan
ECONOMIC AND TOURISM OVERVIEW 13
Wasaga Beach
Building Permit Values
Total building permit values in Wasaga Beach reached almost $59 million in 2014, which included 525
permits. In 2015, the number of permits increased slightly to 533, while the value declined by 8%. Led by
strong residential growth, 2016 permit activity showed an increase of 27% in the number permits issued
and 80% growth in the total value of permits issued when compared to 2015.
WASAGA BEACH PERMIT ACTIVITY
2015 – 2016 (VALUE IN $ MILLIONS)
2011 2012 2013 2014 2015 2016
Total Permits Issued 663 578 647 525 533 677
Estimated Value of Residential Construction $58.2 $41.7 $69.0 $52.8 $51.9 $95.1
Estimated Value of Non-residential Construction $5.3 $1.1 $1.9 $5.8 $1.9 $1.5
TOTAL Construction Value $63.4 $42.7 $70.9 $58.6 $53.7 $96.5
Source: Town of Wasaga Beach
CBRE LIMITED | CBRE TOURISM & LEISURE GROUPDowntown Development Master Plan
14 ECONOMIC AND TOURISM OVERVIEW
Wasaga Beach
TOURISM OVERVIEW
Simcoe County Visitor Market
The volume and value of tourism in Canada is measured by Statistics Canada through two primary
surveys: the Travel Survey of Residents of Canada (TSRC) and International Travel Survey (ITS). In turn, the
Ontario Ministry of Tourism, Culture and Sport (MTCS) customizes the data to reflect specific sub-regional
provincial regions and the formats required by MTCS’s Tourism Regional Economic Impact Model (TREIM).
In Canada, a domestic tourist is someone who takes an “out-of-town” trip for one or more nights, or a
same day out-of-town trip that takes them at least 40 km one-way from his/her home.
Regional Tourism Organization 7 (RTO7) consists of Bruce County, Grey County and Simcoe County. In
2014, RTO 7 attracted an estimated 12.8 million person visits, wherein 35% were overnight trips. Of total
RTO 7 visitation, Simcoe County (CD 43), which includes Barrie, Collingwood, and Wasaga Beach
accounted for approximately 70%, attracting 9.0 million visits.
Simcoe County Visits as a Proportion of Total
RTO 7 Visitation
Total RTO 7
(12.8 million)
Simcoe
County
70%
(9.0 million)
Source: TSRC/ITS 2013-14, Statistics Canada, MTCS
As shown below, same day visits comprised 66% of total trips to the County (6.0 million visits), while
overnight visits accounted for the remaining 34% (3.0 million visits).
CBRE LIMITED | CBRE TOURISM & LEISURE GROUPDowntown Development Master Plan
ECONOMIC AND TOURISM OVERVIEW 15
Wasaga Beach
Simcoe County Tourism Volumes by Length of Stay
- 2013
3.0 million
34%
6.0 million
66%
Overnight Person Visits Same-day Person Visits
Source: TSRC/ITS 2013, Statistics Canada, MTCS
The majority of trips to Simcoe County are made for pleasure purposes (47%), followed by trips to visit
friends and relatives (39%), and for the purpose of business (6%). The remaining trips are made for the
primary purposes of shopping (5%) or other personal reasons (3%).
Simcoe County Visitation by Purpose of Trip
- 2013
3%
5%
Pleasure
6%
VFR
47% Business
Shopping
39%
Other Personal
Source: TSRC/ITS 2013, Statistics Canada, MTCS
Simcoe County residents travelling within the County comprise 17% of overall visitation (1.5 million trips),
while other Ontario residents accounted for 80% (7.2 million trips) and residents from other Canadian
provinces constitute less than 1% (100,000 trips) of total visits. Visitation from U.S. and overseas generated
approximately 2% of the total, or 200,000 trips in 2013.
CBRE LIMITED | CBRE TOURISM & LEISURE GROUPDowntown Development Master Plan
16 ECONOMIC AND TOURISM OVERVIEW
Wasaga Beach
Tourism Volumes to Simcoe County by Place of Residence -
2013
Visits to Simcoe
Place of Residence County %
Total Person Visits 9,000,000 100%
Simcoe County 1,500,000 17%
Other Ontario 7,200,000 80%
Other Canada 100,000 1%
US & Overseas 200,000 2%
Source: TSRC/ITS 2013, Statistics Canada, MTCS
Residents from the Greater Toronto Area (RTO 5) comprise approximately one-in-every-three tourist visits to
Simcoe County in 2013 (3.1 million trips). With 1.8 million visits, RTO 7 (Bruce Peninsula, Southern
Georgian Bay and Lake Simcoe) residents also account for a significant proportion of visitation (20%),
followed by those residing in RTO 6 (York, Durham and Hills of Headwaters) who comprise 16% of visits
(1.4 million trips).
Tourism Volumes to Simcoe County by Key Markets - 2013
Visits to Simcoe
Place of Residence County %
Total Person Visits 9,000,000 100%
Region 5: Greater Toronto Area 3,100,000 34%
Region 7: Bruce Peninsula, Southern Georgian Bay, Lake Simcoe 1,800,000 20%
Region 6: York, Durham, Hills of Headwaters 1,400,000 16%
Region 3: Hamilton, Halton, Brant 800,000 9%
Region 4: Huron, Perth, Waterloo, Wellington 400,000 4%
Source: TSRC/ITS 2013, Statistics Canada, MTCS
From a seasonality perspective, visitation to Simcoe County was highest from July to September (Quarter 3)
with 33% of total visits, followed by April to June (Quarter 2) with 26%. Minimal fluctuations in visitation
were seen in the remaining periods, with January to March (Quarter 1) accounting for about 22% of
visitation and October to December (Quarter 4) slightly lower at 18%. These statistics are heavily
influenced by the four season nature of Collingwood and Barrie as destinations, with visitation to Wasaga
Beach largely remaining between Victoria Day and Labour Day.
CBRE LIMITED | CBRE TOURISM & LEISURE GROUPDowntown Development Master Plan
ECONOMIC AND TOURISM OVERVIEW 17
Wasaga Beach
Simcoe County Visitation by Quarter - 2013
1.6 million 2.0 milliion
18% 22% Q1 (Jan-Mar)
Q2 (Apr-Jun)
3.0 million 2.4 million
33% 26% Q3 (Jul-Sept)
Q4 (Oct-Dec)
Source: TSRC/ITS 2013, Statistics Canada, MTCS
Simcoe County visitors spent an estimated $952 million in the County during 2013. Overnight visitors
generated about 55% of total tourism spending ($527 million), for an average of $173 per overnight visit,
or $72 per person per night. Same-day visitors spent the remaining $425 million, at an average of $72
per person per day. An estimated $136 million (14% of visitor spending) was spent on accommodations
and a further $120 million was spent on attractions, events and recreation (13% of spending) in Simcoe
County.
Total Simcoe County Visitor Spending - 2013
Visitor Spending %
Total Visitor Spending $952,300,000 100%
Overnight Visitor Spending $527,200,000 55%
Same-Day Visitor Spending $425,100,000 45%
Avg Spend Per Person $106
Avg Per Person Per Overnight Visit $173
Avg Per Person Per Night $72
Avg Per Person Per Same-Day Visit $72
Visitor Spending Categories
Transportation $200,400,000 21%
Restaurant and Bars $237,100,000 25%
Grocery/Liquor Stores $113,600,000 12%
Accommodation $136,200,000 14%
Attractions/Events/Recreation $120,400,000 13%
Clothing/Retail $144,600,000 15%
Source: TSRC/ITS 2013, Statistics Canada, MTCS
CBRE LIMITED | CBRE TOURISM & LEISURE GROUPDowntown Development Master Plan
18 ECONOMIC AND TOURISM OVERVIEW
Wasaga Beach
Wasaga Beach Visitor Market
Despite a lack of tourism visitation and volume data at the granular level for the Town of Wasaga Beach,
available data on the number of visits made to Wasaga Beach Provincial Park provides an indicator of
visitation to the Town. Visitation has been calculated based on an analysis of Provincial Park parking
permits sold, which assumes that there are 4 persons within every vehicle parked. Based on aerial
photographs and counts, the Park assumes that for each person visiting the Provincial Park (4 per vehicle)
there are another 5 persons on the beach. As a result of these assumptions, visitation to Wasaga Beach is
expected to reach 1.8 million visitors in 2016, a 7% increase over prior year results and a growth of
665,000 visits since 2014. Visitation to the Park is heavily influenced by weather conditions, with the past 2
years enjoying excellent summer temperatures and modest rain. On a busy weekend during the summer,
Wasaga Beach attracts an estimated 30,000 to 40,000 visitors.
Estimated Visitation to Wasaga Beach Provincial Park 2013 to 2016
Additional
Wasaga Beach
Visitation, based
Provincial Park At 4 Persons Per on 5 persons per Total Wasaga
Year Daily Permits Sold Vehicle person parked Beach Visitation % Change
2013 45,658 182,632 948,851 1,131,483
2014 45,197 180,788 944,750 1,125,538 -1%
2015 68,958 275,832 1,401,216 1,677,048 49%
2016 74,600 298,400 1,492,000 1,790,400 7%
Source: Ministry of Natural Resources, Wasaga Beach Provincial Park
Estimated Historic Visitation to Wasaga Beach
2013-2016
2,000,000
1,800,000
1,600,000
1,400,000
1,200,000
Visitors
1,000,000
800,000
600,000
400,000
200,000
0
2013 2014 2015 2016
Source: Wasaga Beach Provincial Park Data & CBRE
CBRE LIMITED | CBRE TOURISM & LEISURE GROUPDowntown Development Master Plan
ECONOMIC AND TOURISM OVERVIEW 19
Wasaga Beach
The Existing Hospitality and Tourism Product
Accommodations
The accommodation inventory within the Town of Wasaga Beach is largely comprised of relatively dated
cottage cabin courts, motels and campgrounds. The newest property is the Riverside Docks, which opened
in 2014 with 22 rooms in a 3 storey-building. In 2016, there were 114 motel/cottage properties offering a
total of 1,047 rooms on a permanent and seasonal basis combined. With almost half of the properties
operating on a seasonal basis, only 61 motels/cottages with 579 rooms remain open year-round. During
non-peak periods, many seasonal properties convert into low-income rental housing units, in most cases
resulting in extensive wear which lowers the quality level of accommodations. Recent trends show a
decrease in accommodation supply as an estimated 50 units have fully converted into long-term rental
units to address cashflow issues, since this model enables them to collect a steady flow of rent on a year-
round basis. Occupancy rates for Wasaga Beach accommodations are in the 40 to 50% range, at an
average daily rate of $120 to $135 over the past 2 years. Assuming the average accommodation unit
attracts 4 persons for a 2 night stay, overnight visits to Wasaga Beach are estimated to be in the range of
115,000 to 145,000 person visits. With 1.8 million visitors to Wasaga Beach Provincial Park in 2016,
approximately 1-in-every-10 visitors stay overnight in the Town’s commercial accommodation units. Given
the limited appeal of the current dated accommodation inventory, the Town has difficulty attracting visitors
considering a stay longer than a day trip.
The Town also has 7 campgrounds (1 permanent) with a total of 1,194 sites, which attract seasonal
residents and a younger clientele with a reputation for rowdy behaviour. In addition, two local marinas
offer a total of 105 slips as well as public launch facilities.
WASAGA BEACH TOURISM INVENTORY - 2016
Number of Rooms / Sites /
Type
Properties Slips
Permanent Motels / Cottages 61 579
Seasonal Motels / Cottages 53 468
Total Motels / Cottages 114 1,047
Permanent Campgrounds 1 149
Seasonal Campgrounds 6 1,045
Total Campgrounds 7 1,194
Permanent Marinas 1 80
Seasonal Marinas 1 25
Total Marinas 2 105
Source: Town of Wasaga Beach
Attractions, Festivals and Events
Attractions
The core attraction in Wasaga Beach is the 14 km sand beach situated on the southern shores of
Nottawasaga Bay. Wasaga Beach is also the first provincial park in Canada to be awarded the “Blue Flag”
designation for its banks management efforts under the international environmental standards. It is the
central driver of visitation to the Town and the majority of visitors spend at least a portion of their time at
the beach. Due to its location within the Provincial Park, the beach has an increased level of credibility.
Specifically, the Park manages the beach through the provision and maintenance of the basic supporting
CBRE LIMITED | CBRE TOURISM & LEISURE GROUPDowntown Development Master Plan
20 ECONOMIC AND TOURISM OVERVIEW
Wasaga Beach
infrastructure components (parking, cleaning, washrooms, signage etc.) and ensures environmental
conservation. Other natural features in Wasaga include the Nottawasaga River, Nottawasaga Bay and the
dunes, which currently do not function as key attractions, however present potential for the future.
There are a variety of supporting attractions in Town, however many function on a seasonal basis and
present limited appeal for tourists. Attractions include Wasaga 500 Go-Karts, Skull Island Mini-Golf and
Hand Racing, an indoor remote control race track, with an outdoor track expected to open in Spring 2017.
Festivals and Events
From May to September 2016, Wasaga hosted approximately 32 events. Most Town events are held in the
Provincial Park and include the support and involvement of Park staff. For the last three years, one of the
largest Town events has been the Electric Elements Music Festival, which was expected to attract between
12,000 to 15,000 to the Playland Park Square in Beach Area 1 and 2 in 2016 and the Stonebridge
Wasaga Beach Blues held in September. Another large event is the Wasaga Beach Motorcycle Rally, which
is in its’ second year and was expected to see about 13,000 people in 2016, after having seen attendance
4
of 7,000 in 2015. A number of events also take place in the non-summer period, such as the Santa Claus
5
Parade in November. A complete listing of Wasaga’s 2016 Events/Festivals hosted from May to
September follows:
WASAGA BEACH EVENTS/FESTIVALS HOSTED
MAY TO SEPTEMBER 2016
Event/Festival Date Event/Festival Date
Wasaga’s Finest Citizen Awards May 14 Underground Series July 8-10
Electric Elements May 22 Wasaga Beach Motorcycle Rally July 15-17
Adopt-a-Road May 28 Wasaga Beach Ribfest July 22-24
Purina® Walk for Dog Guides May 29 Not So Pro Volleyball July 23-24
Scouts Soap Box Derby June 4 F-series Truck Rally July 30
Public Open House & BBQ June 4 Dunes & Discs – Ultimate Frisbee Beach July 30-31
Tournament
Heart & Stroke Big Bike June 8 Palaver International Literary Festival August 6-7
Kite Fest June 18 5K Foam Fest August 13
Wasaga Water Front Festival June 19 Wasaga under Siege August 13 & 14
Wasaga Cruiser’s Fun Run June 24 & 25 Mayors 2016 Golf Challenge August 26
Wasaga Beach Stand Up June 25 MultiSport Triathlon August 27-28
Paddleboard Fest
Georgian Triangle Music Festival June 30, July 1 Dinner and a Movie Wednesdays
September & October
Main Street Market Fridays July 1st- Inflate-A-Fest September 2-4
September 2
Canada Day July 1 Memories of Summer Fireworks September 4
Fire Fit Championships July 2 & 3 Terry Fox Run September 18
Jazz in the Park Tuesdays July & Stonebridge Wasaga Beach Blues September 16-18
August
Source: Town of Wasaga Beach
4
Source: www.theenterprisebulletin.com
5
Source: Town of Wasaga Beach
CBRE LIMITED | CBRE TOURISM & LEISURE GROUPDowntown Development Master Plan
ECONOMIC AND TOURISM OVERVIEW 21
Wasaga Beach
Supporting Infrastructure
Food and Beverage Outlets
Wasaga Beach has a limited inventory of food and beverage establishments. The only non-fast food
branded restaurants in Town are Sunset Grill, Swiss Chalet and Boston Pizza, however there are a number
of good quality independent establishments. Due to a lack of quiet adult or family focused restaurants, it is
likely that Wasaga Beach loses potential food and beverage business to restaurants in and around
Collingwood.
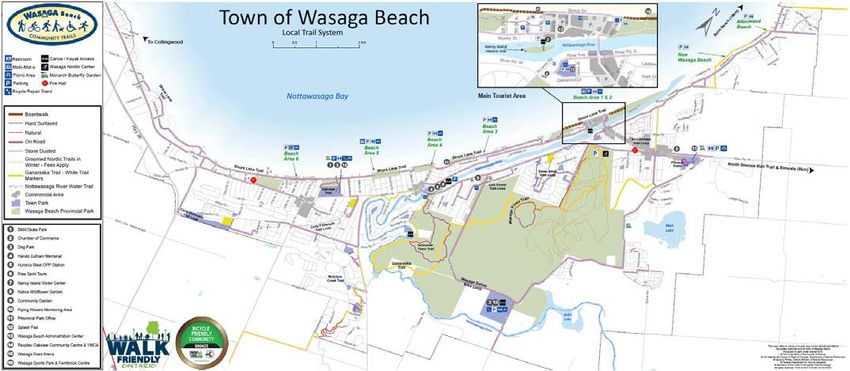
Recreation and Culture Facilities
Wasaga Beach also features a significant network of community trails, with 40 kilometres off road and 34
kilometres of paved shoulders used for hiking, cycling and other passive recreation activities. A new Trails
of Wasaga Beach map (see below) was recently developed and highlights the Town’s scenic biking, hiking,
snowshoeing and ski trails, as well as proposed trails for the future.
CBRE LIMITED | CBRE TOURISM & LEISURE GROUPDowntown Development Master Plan
22 ECONOMIC AND TOURISM OVERVIEW
Wasaga Beach
Recreation facilities in Wasaga Beach include the Sports Park & Fernbrook Centre (5 baseball diamonds
and 10 soccer fields, a fully accessible playground, 6 horseshoe pitches, a floating dock and canoe
launch), RecPlex and the Arena/Rec Hall. Although there is no concentrated strategy in place to attract
sports tourism to the area, the Town hosts a number of tournaments and camps that see visitation from the
broader region. Interviews with local accommodation operators indicated that they are losing overnight
demand related to sports tournaments to the newer branded hotels in the Collingwood market and Blue
Mountain accommodation supply.
Cultural facilities consist of a library, the Nancy Island Historic Site and Visitor Information Centre. Wasaga
Beach’s year-round Visitor Information Centre opened in 2012 to highlight the natural and cultural
offerings of the Wasaga Beach area and to commemorate the bicentennial of the War of 1812. The
“Welcome Centre” includes a gift shop, tourist information, staff offices, meeting space, washrooms and an
interpretative exhibit gallery that relates to the Nancy Island Historic Site and Wasaga Beach Provincial
6
Park. As part of the consultation process for the subject Downtown Master Plan, residents expressed an
interest in the development of a Culture Centre for Wasaga Beach.
Parking
Wasaga Beach has three types of parking lots: provincial, municipal and private. There are approximately
2,790 parking spaces within Beach 1 and 2, with 39% owned by the Provincial Park and the balance (61%)
comprised of municipal and privately-owned spaces. An additional 4,179 provincial and private parking
spaces are located in close proximity to Beaches 3 to 6 and the Allenwood and New Wasaga beaches.
6
Source: www.wasagabeach.com
CBRE LIMITED | CBRE TOURISM & LEISURE GROUPDowntown Development Master Plan
ECONOMIC AND TOURISM OVERVIEW 23
Wasaga Beach
Wasaga Beach Parking Space Inventory
Lot Area / Ownership Spaces
Beach 1 and 2 Parking lots
Provincial Lots 1,090
Other Municipal and Private Lots 1,700
Total 2,790
Remaining Parking Lots
Provincial Lots 1,089
Private Lots 300
Total 1,389
Total Parking Spaces 4,179
Source: Town of Wasaga Beach, Wasaga Beach
Provincial Park
Wasaga Beach Municipal Parking Lot Inventory – 2014 Map
Source: www.wasagabeach.com
Parking spaces at Beaches 1 and 2 typically fill up during weekends in the summer, with visitors also
utilizing other parking lots/spaces that are lower in demand due to their location slightly further away
(closer to Beaches 3-6 and the Allenwood and New Wasaga Beaches).
CBRE LIMITED | CBRE TOURISM & LEISURE GROUPDowntown Development Master Plan
24 ECONOMIC AND TOURISM OVERVIEW
Wasaga Beach
Conclusions
The Town of Wasaga Beach is a highly seasonal resort community with significant potential; however, the
average household income is over 17% below the national average, and the Town is currently perceived to
be an “economy destination” from a tourism standpoint. The majority of visitors derive from the GTA,
followed by central Ontario and the southwestern Ontario. Key challenges for the community from a
destination perspective include: seasonality, lack of alternative attractions over and above the beach,
transportation/traffic congestion, quality of accommodation and foodservice offerings, and minimal levels
of sustainable development.
Although the Town has seen recent growth in visitation levels due to excellent summer weather conditions,
beyond the natural offerings of the Beach and Provincial Park, tourism attractions are limited, seasonal and
provide limited appeal for visitors. With an aging accommodation inventory, a lack of branded foodservice
offerings, and limited attractions, the Town loses much of its potential overnight demand to nearby areas
like Collingwood and Blue Mountain.
CBRE LIMITED | CBRE TOURISM & LEISURE GROUPWaterpark Hotel: Wasaga Beach Accommodation Development Plan – Market & Financial Analysis Waterpark Hotel Introduction Concept and Capital Costs Market Analysis Subject Utilization Projections Subject Operating Projections Investment & Implementation Considerations
Downtown Development Master Plan
   26      WATERPARK HOTEL                                                                      Wasaga Beach, ON
                                                                                                    January 2017

 INTRODUCTION

 Waterpark Resort Trends – North America

 The development of indoor waterpark resorts and the addition of indoor waterparks to existing hotels have
 become a more widespread phenomena since 2000 in the North American hotel industry. This growth is
 due to their popularity with children and the interest by parents and grandparents in selecting lodging
 locations that will be fun for their kids. Indoor waterpark resorts are also increasing in popularity for short
 weekend and two or three day trips for families who may not have enough time for lengthier vacations.
 Historically, growth of indoor waterparks in resorts and hotels has primarily been in summer resort
 locations, however development has also taken place in suburban and urban locations.

 Hotel and Leisure Advisors (H&LA), a US company that deals in this sector, defines an Indoor Waterpark
 resort as a “Lodging establishment containing an aquatic facility with a minimum of 10,000 square feet of
 indoor waterpark space and inclusive of amenities such as slides, tubes, and a variety of indoor water play
 features.” H&LA has further classified indoor waterpark resorts into 2 categories:

        1. A resort which offers over 30,000 square feet of indoor waterpark space and is considered a true
           destination resort that is the primary motivator for families to visit on a year-round basis; or

        2. A hotel with an attached indoor waterpark with between 10,000 to 30,000 square feet of space,
           which serves as an amenity to the hotel versus a true destination.

 The below table details the three types of indoor waterparks that currently exist and are being developed in
 the US and Canada.

                                                TYPES OF INDOOR WATERPARKS
                                Hotel with Water         Hotel with Indoor           Indoor Waterpark Destination Resort
                                     Features                Waterpark
Size of Aquatic Area           1,000 to 10,000      10,000 to 30,000 sq.ft.     30,000+ sq.ft.
                               sq.ft.
Possible Amenities             Swimming pool,       Multiple slides, tree house Multiple slides, tree house with slides, spray
                               slide, toddler       with slides, spray guns,    guns, tipping buckets, Jacuzzi, various pools,
                               area, spray gun      tipping buckets, Jacuzzi,   lazy river, wave pool, water coaster, surfing,
                                                    various pools, lazy river   outdoor waterpark features
Capacity                       Up to 250            250 to 750                  750 to 5,000
Minimum # of Lifeguards        1                    3                           10
Arcade Size                    1 to 1,000 sq.ft.    1,000 to 3,000 sq.ft.       3,000 to 10,000 sq.ft.
Source: Hotel & Leisure Advisors

 When compared to a typical hotel that includes a waterpark, destination waterpark resorts differ in that
 they feature additional resort and leisure amenities. Ancillary amenities at waterpark destination resorts can
 include large arcades, retail shops, multiple food and beverage outlets, spas, fitness facilities, kids clubs,
 indoor playgrounds, bowling, and/or more. With regard to accommodation types offered, various room
 types typically exist, such as kid-centric themed rooms and suites.

                                                                 CBRE LIMITED | CBRE TOURISM & LEISURE GROUP
Downtown Development Master Plan
Wasaga Beach, ON WATERPARK HOTEL 27
January 2017
Growth in indoor waterpark development is occurring as a fundamental part of some destination resorts
(typically independent) and as an amenity in some existing hotels (usually franchised). Two trends are
currently taking place. The first is the development of franchised hotels with indoor waterparks, as well as
the addition of waterparks to existing properties, generally with smaller indoor waterparks being attached
to smaller hotel projects. In these developments, waterparks act as a guest amenity, and are not the all-
encompassing focus of a hotel. In general, these hotels have performed worse in terms of average daily
rate and occupancy and have produced more conflicts between corporate and family guests. The second
trend is that larger destination resorts, inclusive of more expansive waterpark areas and additional
amenities, are also under development and opening across North America (primarily in the US). The
primary target market for these resorts is leisure travelers that are attracted by the waterpark features.
These resorts have achieved better performance results, primarily due to offering an array of attractions
and amenities and focusing on attracting leisure guests.
There are a number of factors that contribute to the success of waterpark resorts. The following list includes
examples of some waterpark resort success factors:
• Typically they tend to feature a number of larger themed rooms where 4 or more guests can stay,
and their room rate includes entrance to the waterpark. As a result, guests are willing to pay higher
room rates for the waterpark amenity;
• They cater to families with children from 2 to 14 years of age, traveling with their parents and
grandparents;
• They typically achieve occupancies in the 50% to 60% range, which is higher than the typical resort
(more likely to achieve occupancies in the 50% range);
• Typically 180 non-school days in the year, that will generate higher occupancy levels;
• Access to major markets within 200 kilometres and easily accessible from major highways; and
7
• They are primarily constructed in historically summer resort locations, with strong leisure demand.
Key Waterpark Resort Brands – North America
Great Wolf Lodges – With 13 locations (soon-to-be 14 in late 2016) in North America, Great Wolf Resorts
is the largest family of indoor water parks with hotels. Resorts feature specialty themed entertainment
offerings including restaurants, spas, arcades, water park attractions and activities, which are designed to
extend the average length of stay and capture larger proportions of family vacation expenditures. The first
property opened in Wisconsin Dells in 1997, with the most recent resort development in Colorado Springs
expected to open in late 2016. Plans for future resort development in key North American and International
Markets are already underway.
Great Wolf Resorts’ mission is “to create family traditions, one family at a time.” The Great Wolf Lodge
model portrays rustic Northwoods-themed décor with spacious and functional all-suite rooms and timbered
grand lobbies. Specifically, hotels can accommodate between 250 to 600 guest suites, large indoor and
7
Source: CBRE Research
CBRE LIMITED | CBRE TOURISM & LEISURE GROUPDowntown Development Master Plan
28 WATERPARK HOTEL Wasaga Beach, ON
January 2017
outdoor water park facilities that are usually around 75,000 square feet, and overall indoor development
areas that typically cover 433,000 square feet.8
Great Wolf’s portfolio of properties can be divided into two types; Generation I and Generation II, which
classify properties by the specs shown below.
GREAT WOLF LODGE TYPES
Year Opened # of Rms Waterpark Sq.Ft. Amenities Meeting Space Sq.Ft.
Generation I Before 2004 IPO Avg. less Avg. less than Fewer amenities Less than 8,000
than 400 65,000 and F&B outlets
Generation II Since 2004 Avg. more Avg. more than Large offering of Properties built since
than 400 95,000 amenities and 2006 include larger
F&B outlets meeting space offerings
Source: CBRE Research
Kalahari Waterparks, Resorts & Conventions – Privately owned and operated by the Nelson family, these
resorts portray an authentic African theme and experience. Resorts feature an all-under-one-roof concept
and offer guests an array of amenities inclusive of award-winning restaurants, retail shops, fitness centres,
indoor theme parks, full-service spas, state-of-the-art meeting and convention facilities, and America’s
largest indoor waterparks. Three locations currently operate in the US:
Year Opened
Employees
Indoor Outdoor
# of Rooms & Waterpark Waterpark Convention
Properties Breakdown by Type Sq.Ft. Sq.Ft. Centre Sq.Ft. Other Amenities Development
756 rms, includes 110,000 sq. ft. ind. theme park, FS Dec.2011 opened multimillion
96 three-key spa, 3 dining facilities, retail shops, dollar waterpark renovation project
condos and 16 fitness centre, indoor playground, 15- with a new slide structure and an
Wisconsin stand-alone five screen cinema, Music Theatre and 27- African-themed children's water play
Dells, WI 2000 1,100 bedroom suites 125,000 77,000 100,000 hole Golf Club feature
115,000 sq. ft. Safari Outdoor
Adventure Park,FS spa, retail shops, Dec.2011 opened a $22 million
884 rms, including ind. mini-golf, indoor playground, convention centre expansion
Sandusky, 192 three-key arcade, fitness centre and three on-
OH 2005 1,300 condos 173,000 77,000 215,000 site dining outlets
Phase II construction underway and
once complete in Spring 2017, will
457 rms, including 30,000 sq. ft. family entertainment bring the resort to almost 1,000
one-, two- and centre, full-service spa, three dining guest rooms in total, a 200,000 sq.
Pocono three-bedroom facilities, 6,000 square feet of retail ft. indoor waterpark and an
Mtns., PA 2015 N/A suites 100,000 sq.ft. N/A 65,000 shops and a fitness centre expanded outdoor waterpark
Source: Kalahari Resorts & Conventions
In addition, Kalahari has announced that they intend to open their newest location in the city of Round
Rock, Texas. With creation of the land use plan and zoning changes slated to begin in Spring 2016,
9
expected timing for development completion is no later than December 2021.
CoCo Key Water Resorts – Inclusive of at least 8 locations, situated in the US (Orlando, Kansas City, Mount
Laurel, Newark, Cincinnati, Rockford, Omaha and Danvers). Properties feature a Key West theme and an
8
Source: Great Wolf Resorts, Inc.
9
Source: www.roundrocktexas.gov
CBRE LIMITED | CBRE TOURISM & LEISURE GROUPDowntown Development Master Plan
Wasaga Beach, ON WATERPARK HOTEL 29
January 2017
indoor water park (excluding Orlando, which offers an outdoor water park). When Coco Key Resorts first
opened they were owned by a single entity, however following financial problems the entity sold its
properties. Currently, each resort is owned and operated independently, however they maintain branding
and portray a similar style and feel. On average, the indoor waterparks at CoCo Key Resorts are
approximately 60,000 square feet and include body slides, tube slides, a lazy river, an activity pool, an
outdoor/indoor whirlpool spa and an interactive play centre (with small slides and a tipping bucket). Water
10
park access is included in hotel guest stays, however passes are also available for the general public.
Inventory of Waterpark Hotels/Resorts – Canada & Ontario
In Canada, there are two properties that would be considered destination waterpark resorts. The first
Canadian indoor waterpark destination resort was the Fantasyland Hotel/World Waterpark at the
Edmonton Mall, which opened in 1985. The resort offers 355 rooms and 218,000 square feet of indoor
waterpark space. The second destination waterpark resort is Great Wolf Lodge Resort, which opened in
Niagara Falls, Ontario in 2006 and is currently the only franchised waterpark in Canada. Great Wolf
Lodge features 406 rooms and an indoor waterpark that spans over 100,000 square feet.
As shown below, there is an inventory of 6 waterpark hotel/resort facilities in Ontario, comprised of
properties with waterparks spanning more than10,000 square feet. With 3 properties, the largest supply of
waterpark hotels is within Niagara Falls, specifically with the Fallsview Indoor Waterpark attached to 4
hotels. On average, Ontario waterpark hotels feature 425 rooms and waterparks that span approximately
60,000 square feet and include 7 waterslides. Typically, other waterpark amenities include wave pools,
water play structures, tipping buckets, whirlpools/Jacuzzis, activity pools, kiddy pools and/or private
cabana rentals. In addition, ancillary hotel/resort amenities include a variety of leisure offerings ranging
from spas, fitness centres and multiple food and beverage outlets to arcades, bowling alleys, mini-golf and
indoor tennis courts.
10
Source: themeparks.about.com
CBRE LIMITED | CBRE TOURISM & LEISURE GROUPYou can also read