Washington Consensus reforms and economic performance in sub-Saharan Africa - Lessons from the past four decades
←
→
Page content transcription
If your browser does not render page correctly, please read the page content below
Washington Consensus
reforms and economic
performance in
sub-Saharan Africa
Lessons from the past four decades

Belinda Archibong
Brahima Coulibaly
Ngozi Okonjo-Iweala

   AGI WORKING PAPER 27              FEBRUARY 2021

Belinda Archibong i is assistant professor of economics at Barnard College, Columbia University.
Brahima Coulibaly ii is vice president of the Global Economy and Development program at Brookings.
Ngozi Okonjo-Iweala is nonresident distinguished fellow with the Global Economy and Development
program at Brookings, chair of the Board of the Global Alliance for Vaccines and Immunization, and
former finance minister of Nigeria.

JEL classification: O10, O43, N37
Keywords: Washington Consensus, Structural Adjustment Programs, Policy Reform, Africa

i ba2207@columbia.edu
ii BCoulibaly@brookings.edu
Abstract

Over three decades after market-oriented structural reforms, termed “Washington consensus”
policies, were first implemented, we revisit the evidence on policy adoption and the effects of these
policies on socio-economic performance in sub-Saharan African countries. We focus on three key
ubiquitous reform policies around privatization, fiscal discipline, and trade openness and document
significant improvements in economic performance for reformers over the past two decades. Following
initial declines in per capita economic growth over the 1980s and 1990s, reform adopters experienced
notable increases in per capita real GDP growth in the post 2000 period. We complement aggregate
analysis with four country case studies that highlight important lessons for effective reform. Notably,
the ability to implement pro-poor policies alongside market oriented reforms played a central role in
successful policy performance.

                                                                       Africa Growth Initiative at Brookings   1
Washington Consensus reforms and economic performance in sub-Saharan Africa: Lessons from the past four decades 1. Introduction When economist John Williamson coined the term “Washington Consensus” in 1989, he was referring to a set of ten market-oriented policies that were popular among Washington-based policy institutions, particularly as policy prescriptions for improving economic performance in Latin-American countries (Williamson, 1993). These policies centered around fiscal discipline, market-oriented domestic reforms, and openness to trade and investment. In African countries, the Washington Consensus inspired market-based reforms prescribed by international financial institutions (IFIs) like the World Bank and the International Monetary Fund (IMF), under “structural adjustment programs” (SAP). These reforms were often prerequisites for financial assistance to indebted African countries during the global recession and debt crisis of the 1980s, when the external debt rose sharply to unsustainable levels (Onyekwena and Ekeruche, 2019; Naiman and Watkins, 1999; Mkandawire and Soludo, 1999). The story of how African countries got into a debt crisis that led to the introduction of structural adjustment programs is often told as follows: first, expansionary fiscal spending aimed at economic development spearheaded by newly independent African governments, struggling to recover from the ravages of European colonialism, increased government spending in the 1960s and 1970s. Governments also borrowed significantly to finance development expenditures over this time. Oil price shocks that significantly decreased the price of oil in 1980s led to declines in export revenue for many governments. This decline in export revenue, along with a collapse in world prices of primary agricultural commodities, which made up 88 percent of Africa’s exports, resulted in a shortfall in revenue that put enormous pressure on governments’ finances (Onyekwena and Ekeruche, 2019; Mkandawire and Soludo, 1999). Additionally, government featured largely in domestic financial institutions like the banking sector, with many African governments nationalizing foreign banks or creating new state-owned financial institutions (Mkandawire, 1999). The global recession in the early 1980s, along with an increase in interest rates in donor countries, also raised interest payments on previously contracted loans, markedly increasing the debt burden of African countries and leading to the debt crisis of the 1980s (Onyekwena and Ekeruche, 2019; Due and Gladwin, 1991). By the early 1980s, African governments were in severe financial straits and, with lowered incomes, increasing poverty, and declining welfare, turned to IFIs for debt relief. Among the conditions for relief, countries had to first agree to economic and financial reform policies along the lines of those outlined in the Washington Consensus to achieve macroeconomic stability and efficiency. The expectation was that market-oriented reforms would correct domestic policy-induced distortions in prices, such as overvalued exchange rates, subsidies that led to artificially low agricultural commodity prices, high wage rates, low interest rates and subsidized input prices, which introduced inefficiencies in resource allocation, with detrimental effects on the economy in the long-run (Due and Gladwin, 1991; Williamson, 1993; Easterly, 2019; Chari, Henry, and Reyes, 2020). The underlying assumption, as other scholars have pointed out, was that competitive markets would work well to efficiently allocate resources to residents in these African countries suffering under the burden of debt and illiberal fiscal and monetary policies (Easterly, 2019). Hence, market-based policies like privatizing public enterprises, removing or relaxing exchange rate controls that biased export trade towards certain commodities and fiscal adjustment to balance budgets by reducing 2 Africa Growth Initiative at Brookings
spending on subsidies would support stronger economic growth. Several African countries adopted
these market-oriented policies beginning in the 1980s. The number of reform adopters increased
further following the introduction of the Highly Indebted Poor Countries (HIPC) initiative by the World
Bank and IMF in the mid-1990s. The HIPC program provided debt relief to countries with
‘unsustainable’ debt provided they enacted many of the SAP policies (Onyekwena and Ekeruche,
2019). It has been over three decades since these policies were first adopted across Africa and other
developing countries, yet the evidence of their impact on economic outcomes has not been
conclusively established in the literature.
Most early literature finds that the policies failed to improve economic conditions in African countries
for several reasons centered on the failure to account for political economy within countries, and the
politics of conditionality and reforms that did not adequately emphasize the role of local ownership in
shaping domestic economic policy (Ekpo, 1992; Easterly, 2000; Due and Gladwin, 1991; Birdsall,
Caicedo, and De la Torre, 2010; Adedeji, 1999; Mkandawire and Olukoshi, 1995; Rodrik, 2006;
Stiglitz, 2005). Other studies attribute the failures of the reforms to increases in domestic inflation
and its adverse effect on real incomes and well-being post-reform (Due and Gladwin, 1991; Ekpo,
1992). The negative effects of the reforms were also disproportionately felt by rural farmers, especially
women working in food crop production. Ironically, while IFIs were advocating for the removal of
agricultural subsidies in Africa, the advanced economies, including the United States and OECD
countries, heavily subsidized agricultural production making it difficult for African farmers to compete
(Due and Gladwin, 1991; Mkandawire and Olukoshi, 1995). The outcome of these market-oriented
reforms was increased unemployment and socio-political unrest in several African countries in the
1980s and 1990s (Mkandawire and Olukoshi, 1995; Due and Gladwin, 1991; Ihonvbere, 1993; Elson,
1995).
A more recent literature has highlighted that the reforms were successful in improving economic
growth, particularly when policymakers had the state capacity to implement them (Prati, Onorato, and
Papageorgiou, 2013; Grier and Grier, 2020; Dollar and Svensson, 2000). Taken at face value, these
studies suggest that the de facto reductions in state capacity required by some reforms may have
contributed to their failure in some countries. For instance, the ratio of civil servants to the population
in all sub-Sahara Africa (SSA) fell to 1 percent in 1996, lower than the 3 percent for other developing
countries and much lower than the OECD average of 7 percent (Sender, 1999). Without a motivated,
well-equipped, civil service, proper implementation and regulation of these reforms was often
incredibly difficult.
Over 30 years after the initial adoption of reforms in African countries, we re-examine the relationship
between reform adoption and economic performance. The predictions of the Washington Consensus
policies amount to the following testable hypotheses: (i) First, countries that implemented the market-
oriented reforms will experience better economic outcomes in the following years compared to the
years preceding the reforms; and (ii) second, countries that implemented reforms will perform better
than the countries that did not. Since the early 2000s, African economies have experienced
remarkable improvement in economic growth, with median country real GDP per capita growth rising
from 0.2 percent per year on average in the 1980s and 1990s, when many of the reforms were first
implemented, to 1.6 percent over 2000 to 2019 as shown in Figure 1. The reforms also aimed to
achieve lower and more stable inflation rates, partly through improved fiscal discipline. The rate of
inflation in the region declined from double digits in the 1980s and 1990s to stabilize at around 5
percent in the past two decades (Figure 2), suggesting that inflation stabilization has been relatively
successful in many African countries. These observations raise the question of whether the reforms of

                                                                         Africa Growth Initiative at Brookings   3
Washington Consensus reforms and economic performance in sub-Saharan Africa: Lessons from the past four decades the 1980s and 1990s could have played a role in the region’s improved economic performance of the past two decades. With the benefit of more recent data, we revisit whether market-oriented reforms of the 1980s and 1990s may have contributed to the positive economic outcomes for sub-Saharan Africa over the past decades, considering plausible alternative explanations. We refer to the economic literature on key Washington consensus policy reforms and classify them into three broad categories namely: (i) Reforms aimed at achieving fiscal discipline (fiscal reforms); (ii) reforms aimed at reducing the role of government in the local economy (domestic market-oriented reforms), and (iii) reforms aimed at achieving greater economic openness to trade and investment (openness reforms). Our results indicate that during the initial reform years, economic performance was worse for reform adopters, with average per capita real GDP growth declining in the 1980s and 1990s. In contrast, non- reform adopters experienced positive growth over this period, consistent with the earlier literature showing that the reforms failed to bring about short-run economic growth. Between 2000 and 2019, average per capita GDP growth was higher than during the 1980s and 1990s for both reformers and non-reformers. However, the increase in growth was even higher for reform adopters. When we examine these comparative statistics by reform category, the difference in performance between reformers and non-reforms is largely driven by adoption of fiscal and domestic market-oriented reforms. We explore the role of alternative explanations, specifically, the increase in commodity prices and the effect of debt relief on economic performance for several countries in the 2000s. We find that the post-2000 per capita GDP growth was higher for non-commodity dependent countries compared with commodity dependent countries. Additionally, among the commodity-dependent countries, the per capita GDP growth was higher for reformers compared with non-reformers. For debt relief, countries that benefited from debt forgiveness experienced higher per capita GDP growth compared with countries that did not. Among the countries that benefited from debt relief, reformers generally experienced a higher per capita GDP growth. While it is difficult to draw definitive conclusions from the simple analyses in this study, the result point to a reversal of the economic fortunes of reform adopters in the last two decades following their initial dismal economic performance during the 1980s and 1990s. To enrich the aggregate analysis, we conduct four case studies for Ethiopia, Nigeria, Uganda, and Senegal, which allow for a more granular and nuanced assessment of the effect of the reforms. Overall, the case studies support the aggregate findings and reveal some useful lessons on the correlates of successful reform implementation. A stable government and socio-political environment with a focus on pro-poor policies was an essential ingredient in implementing successful reforms. Crucially, concurrent efforts to minimize the potential negative welfare impacts of macroeconomic reforms on domestic populations are important to increase needed public support for reforms. The rest of the paper is organized as follows. Section 2 provides a detailed review of Washington Consensus reform policies. Section 3 presents a comprehensive assessment of the reforms including their adoption trends across sub-Saharan Africa and conducts a comparative analysis of the economic growth patterns between reform adopters and non-adopters. Section 4 explores alternative explanations for the improved growth performance of the past two decades. Section 5 examines the reform experiences of four different countries. Section 6 concludes. 4 Africa Growth Initiative at Brookings
2. Washington consensus policies and structural
   adjustment programs
A first step to understand the economic effects of Washington Consensus policy adoption is to examine
the proposed reforms and the drivers of policy adoption across African countries. Washington
Consensus reforms, as outlined in Serra and Stiglitz (2008), included the following 10 policy
recommendations:

    •   “Fiscal discipline” focused on ensuring countries had relatively low primary fiscal deficits to
        avoid balance of payment crises and high inflation;

    •   “Reordering public expenditure priorities” encouraged elimination of subsidies and increased
        expenditure on pro-poor programs, including health care, education and infrastructure;

    •   “Tax reforms” emphasized the need for a broad-based tax base with moderate marginal tax
        rates;

    •   “Interest rate liberalization” aimed at promoting market-determined interest rates and
        achieving positive real interest rates;

    •   “Competitive exchange rates” to correct overvalued exchange rates;

    •   “Trade liberalization” to allow more openness to trade with varying views on the pace at which
        to proceed;

    •   “Liberalization of Inward Foreign Direct Investment” to attract foreign capital but not including
        capital account liberalization;

    •   “Privatization” highlighted the potential benefits of privatizing state-owned enter-prises by
        either selling assets into a competitive market or regulating them properly;
    •   “Deregulation” aimed at easing barriers to entry and exit, but not abolishing regulations
        designed for safety or environmental reasons or to govern prices in a non-competitive industry;

    •   “Legal security for property rights” to facilitate the acquisition of property rights, notably in the
        informal sector.
For the purpose of this study, we classify the Washington Consensus policies in three main categories:
Fiscal policy reforms (fiscal discipline, reordering of public expenditure priorities, tax reforms);
domestic market-oriented reforms (interest rate liberalization, privatization, deregulation, legal
security for property rights), and openness reforms (liberalization of inward FDI, trade liberalization,
competitive exchange rates). To differentiate between re-formers and non-reformers, we adopt the
following rules: A country is a fiscal reformer if the average primary fiscal balance in 1995 to 1999 is
higher than -0.7, which is the median for the region; a country is a domestic market reformer if the
cumulative number of privatizations deals from 1988 to 1999 is greater than or equal to 6, which is
the median for the region; a country is an openness reformer if it was open to trade, as defined in
Sachs and Warner (1995), for at least five years from 1980 to 1999. There is, admittedly, some
subjectivity in these rules. In practice, because the approach to reforms is not binary, by construction,
the classification mostly distinguishes between those who enacted the most reforms and those who
reformed the least.

                                                                           Africa Growth Initiative at Brookings   5
Washington Consensus reforms and economic performance in sub-Saharan Africa: Lessons from the past four decades Table 1 shows the classification of countries by reform categories. Of the 32 sub-Saharan African countries for which we have data, 59 percent are fiscal reformers. Of the 36 countries for which we have data, 42 percent are domestic market reformers and 47 percent are openness reformers. Six countries (Benin, Cote d’Ivoire, Kenya, Mozambique, Tanzania, and Uganda) are reformers in all three categories. 3. Reform adoption and economic performance The premise of the Washington Consensus policies reforms rested on two interdependent and testable hypotheses: first, in the years following the reforms, economies that adopted reforms would perform better than they did in the preceding years and, second, reform adopters would outperform non- reformers. In the following sections, we examine the links between reform adoption and the region’s economic performance, as measured by per capita GDP growth. 3.1 Fiscal policy reforms Figure 3 shows the evolution of the primary fiscal balance in the region. The median deficit declined from -2 percent in the early 1980s to -0.7 in the late 1990s, suggesting an increase in fiscal discipline across the region. The reduction in the deficit continued through 2010 but widened afterwards due partly to the effects of the Global Financial Crisis of 2008 09 and the 2014 terms of trade shock. Table 2 summarizes the results showing the trends in per capita GDP growth rates for reformers and non-reformers for all countries and by reform category. Overall, the median GDP per capita growth was slightly positive (0.2 percent) across the region between 1980 and 1999. Between 2000-2019, the growth rate rose by 1.4 percentage points to 1.6 percent. However, performance varied by reform categories. Fiscal reformers in the 1980 1999 period experienced negative growth rates, with the trends reversing sharply in the post-2000s era. Comparing the two sets of countries, per capita GDP growth rate was slightly higher for non-reformers than for reformers over the past two decades. However, the per capita GDP growth rate increased by more for reformers compared with non- reformers between 1980-1999 and 2000-2019, consistent with, but not conclusive confirmation of, the positive long-run predictions of reform adoption for economic performance. 3.2 Market-oriented reforms and economic performance No comprehensive and reliable measures were available for deregulation, legal security for property rights and interest rate liberalization. Given the paucity of data and previous literature highlighting privatization as a key policy under Washington Consensus reforms, we use privatization as a proxy for domestic market-oriented reforms (Parker and Kirkpatrick, 2005). The share of countries with one least one privatization deal rose from 5 percent in 1988 to reach 40 percent in the late 1990s as shown in Figure 4. Similarly, the number of enterprises privatized increased significantly from just three in 1988 to 160 in 1996 as shown in Figure 5. This acceleration in the pace of privatization was consistent with the push to privatize several state-owned enterprises (SOEs) as a strategy to consolidate fiscal balances in some cases. Previous scholars have highlighted the serious challenges faced by African countries in the planning and implementation of privatization policies under conditionality and in environments of incomplete markets and weak enforcement capacity (Bayliss and Cramer, 2003; Ariyo and 6 Africa Growth Initiative at Brookings
Jerome, 1999). Although the Washington Consensus framework recognized the importance of
complete markets and proper regulation as preconditions for successful privatization, these
caveats were often overlooked in policy design at IFIs. Many IFIs failed to adequately highlight the
importance of anti-trust legislation in promoting competitive markets along with privatization
reforms. They also underestimated the effects of rapid privatization on the morale of public sector
employees, who were essential for proper regulation of the process (Bayliss and Cramer, 2003;
Ariyo and Jerome, 1999). Many of these issues may have contributed to the poor economic
performance for reformers between 1980 and 1999.
The pace of privatization varied across the region. While some countries, including Cote d’Ivoire,
Uganda, Nigeria, Ghana, Kenya, Mozambique, Zambia and Tanzania, privatized more than 50
SOEs between 1988 and 1999, others, including Gabon, Mauritius, Rwanda, Equatorial Guinea,
Gabon, and Central African Republic, did not privatize any SOEs over this period. Table 2 shows
the average performance between reformers and non-reformers. Similar to the results of the fiscal
reforms, market reformers experienced declines in per capita GDP growth over the reform period
from 1980-1999, followed by a sharp reversal post 2000. Over 2000-2019, growth rates for
reformers and non-reformers looked very similar at 1.5 percent and 1.6 percent on average,
respectively. However, the set of countries that privatized the most in the late 1980s and in the
1990s, experienced a much higher increase in average real GDP per capita growth in the last two
decades: 2.1 percentage points compared with 1.4 percentage points for the non-reformers.
3.3 Openness and economic performance
Openness to trade and investment, notably Foreign Direct Investment (FDI), are key policy
recommendations under the Washington Consensus framework. To assess Africa’s experience with
trade liberalization, we define trade openness following Sachs and Warner (1995). 1 Figure 6 indicates
that sub-Saharan Africa increasingly opened to trade in the 1980s and 1990s. In the early 1980s, only
5 percent of the countries were classified as open to trade. That share rose to reach almost 60 percent
by 2000. Around the same period, African countries accelerated the adoption of more competitive
exchange rates. This was reflected in the increase in the share of countries with floating or semi-
floating exchange rates from 45 percent in 1980 to 60 percent in the early 1990s. While trade-
openness increased, previous scholars have highlighted that this did not translate to immediate
increases in investment in sub-Saharan Africa as shown in Figure 7 (Sender, 1999). Cuts in public
investment to adhere to fiscal reforms contributed to the decline in investment (Sender, 1999).
In addition, many trade liberalization policy reforms undertaken over this period underestimated
the role of incentives facing producers in incomplete markets. Liberalization in the agricultural
sector, hastily implemented, negatively impacted terms of trade for farmers who were sometimes
unable to compete with international prices (Sender, 1999). Higher prices for agricultural
commodities in the 1980s and 1990s worsened food shortages and led to protests in African
1 A country is classified as “open” to trade if does not have any of the following: 1) average tariff rates in excess
40 percent; 2) Non-tariff barriers cover more than 40 percent of imports; 3) It has a socialist economic system;
4) The state has a monopoly on major exports; 5) The black market currency-trading premium exceeds 20
percent
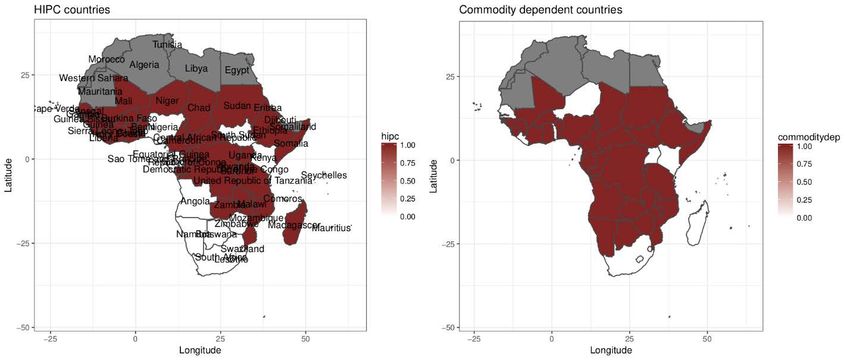
Africa Growth Initiative at Brookings 7Washington Consensus reforms and economic performance in sub-Saharan Africa: Lessons from the past four decades countries (Herbst, 1990). These events, in concert, may have also contributed to the steep reductions in aggregate investment in the 1980s. Despite initial reductions in total investments across the continent in the early part of the reform years, countries that adopted trade openness reforms experienced small positive growth rates over 1980 to 1999. Real GDP growth per capita increased for both reformers and non-reformers between 1980-1999 and 2000-2019. The increase was roughly comparable for reformers and non-reformers, although reform countries ended up with higher growth rates of 1.9 percent in the 2000 to 2019 period. 4. Discussion of alternative explanations for post-2000s economic performance Our analysis compared the economic performance during the initial reform period to the post-2000 years, and between reformers and non-reformers, providing suggestive evidence of differential trends both for reform countries over time and across reform and non-reform countries as well. In this section, we assess plausible alternative, but not necessarily mutually exclusive, explanations for the region’s improved economic performance over the past two decades. One such explanation is that African countries benefited from debt relief and the resulting additional fiscal space allowed governments to increase public expenditures to boost economic growth. A second alternative explanation is that African countries benefited from the sustained increase in commodity prices in the early 2000s, driven, in part, by the high demand from China, and known as the commodity super-cycle (Fernández, Schmitt-Grohé, and Uribe, 2020). 4.1 Debt forgiveness Beginning in the 1990s, officials from major creditor countries (a group known as the Paris Club) and multilateral organizations adopted the ambitious Multilateral Debt Relief Initiative (MDRI) for outright forgiveness of debt owed by a group of 36 low-income countries. Most of these countries, 29 of the 36, were African. The MDRI was the logical advancement of a variety of initiatives for debt relief, the most prominent of which was the Heavily Indebted Poor Countries (HIPC) initiative instituted by the IMF and World Bank in 1996 to address debt overhang in the poorest countries of the world. A snapshot of HIPC countries is shown in Figure 8. African countries had been borrowing into the 1980s, which led to an increasing accumulation of debt that became unsustainable following the recession over this period. The debt relief initiatives, including MDRI, were expected to improve economic per-formance in countries. Unloading of the debt overhang, infusion of new loans, improved policies, along with enhanced investment incentives were expected to increase economic and social development outcomes. Some previous evidence has shown positive correlations be-tween reduced debt burdens and economic upturns (Coulibaly, Gandhi, and Senbet, 2019). The average public debt level (as a percentage of GDP) for sub-Saharan Africa declined to about 36 percent in 2012, significantly below the levels leading up to the HIPC initiative. To explore the economic performance for countries that experienced debt forgiveness and Washington consensus policy reform adopters, we can compare the economic performance of countries that benefited from the debt relief to that of the countries that did not. 8 Africa Growth Initiative at Brookings
As shown in Table 3, countries that benefited from debt relief experienced higher in-creases in
per capita economic growth over the last two decades, 2.3 percentage points, compared with 0.3
percentage points for the countries that did not receive debt relief. Coun-tries that received debt
relief had lower average growth rates between 1980 and 1999 than non-debt relief recipients,
with growth rates similar between debt relief and non-debt relief countries at 2 percent over 2000-
2019. Debt relief through programs like HIPC was often conditioned on strict adoption of market
liberalization reforms like those outlined in Wash-ington Consensus policies. Indeed, many of the
reforms undertaken by African countries in the 1990s were often initiated with an objective to
reach certain debt relief eligibility targets (Ekpo, 1992; Sender, 1999). Disentangling patterns and
trends between reform adopters and the debt relief recipients is diffcult to do with summary
statistics. A simple analysis of patterns and trends over this period shows that, among the beneficiaries
of debt relief, the countries that adopted fiscal and market-oriented reforms posted higher economic
growth than non-adopters. There do not appear to be significant differences in growth rates between
the 1980-1999 reform period and the post-2000s era for debt relief recipients that adopted more
trade-openness reforms.

4.2     The commodity super-cycle
In the 2000s, commodity prices surged in response to higher demand from emerging market
economies, notably China, as well as from concerns over long-term supply. The commodity super
cycle was disrupted during the 2008 to 2009 crisis and, subsequently, the late 2014 adverse
terms of trade shock. Despite these shocks, higher commodity prices over much of the past two
decades benefited several commodity dependent countries (Figure 8). As shown in Table 4, both
commodity dependent and non-commodity dependent countries experienced higher GDP per
capita growth between 2000 and 2019 compared to the previous two decades. In fact, the
increase in per capita GDP growth rate was higher for non-commodity dependent countries, 1.9
percentage point compared with 1.4 percentage point for commodity dependent countries. 2
Finally, per capita GDP growth averaged 2 percent between 2000 and 2004 before the commodity
prices began their rapid ascent (Coulibaly, 2017), suggesting that the increase in commodity prices
was not the sole driver of the post 2000 economic performance. An examination of the trends in
growth rates among commodity dependent countries between reformers and non-reformers shows
that countries that adopted market reforms like privati-zation and trade openness posted higher
increases in average growth rates between 1980 to 1999 and 2000 to 2019. For fiscal reformers, in
contrast, there appears to be no discernible difference in growth rates.
The results suggest that both the debt relief and commodity prices may have also contributed to the
higher per capita economic growth of the last two decades. Within the beneficiaries of debt relief and
commodity dependent, reformers generally posted larger growth gains between the reform period and
the post-2000s era, suggesting that reforms may have played a role in improving economic
performance, independently of the commodity price boom and debt relief.

2 We define commodity dependence according the International Monetary Fund (2016)’s definition of resource-
intensive countries

                                                                         Africa Growth Initiative at Brookings   9
Washington Consensus reforms and economic performance in sub-Saharan Africa: Lessons from the past four decades 5. Washington Consensus and select country experiences The analysis so far has taken a broad-brush approach to examining the links between Washington consensus policy adoption and economic performance in Africa. To complement and enrich the discussion on the regional experience, we explore the reform experience in four countries with very different implementation approaches: Ethiopia, Nigeria, Uganda, and Senegal. 5.1 Ethiopia’s experience Following the account in Devarajan, Dollar, and Holmgren (2002), Ethiopia’s reform experience was largely a story of poor outcomes. In the 1980s, the country was immersed in a civil war and struggled to implement reform during significant political and economic crises. It adopted a few financial liberalization and stabilization policies from 1990 to 1995, including infrastructure investment as well. It also engaged in several privatization deals around land, reformed the banking system and granted autonomy to the National Bank of Ethiopia, and attempted to create a more competitive private sector. With weak state capacity, promoting development and financial stabilization amidst a civil war made attempts at reform an arduous process in Ethiopia. The lack of significant adoption of reforms is captured in the classification provided in Table 1; Ethiopia does not feature among the reform countries on any of the three measures. Nonetheless, Ethiopia has consistently ranked among the top economic performers in the region for much of the past decade and a half, with an average growth rate of real GDP of 8.9 percent between 2000 and 2019. Much of this growth has been attributed to public investment in key infrastructure along with interventions in the agricultural sector to improve productivity and facilitate structural transformation. There has also been a reallocation of labor from low productivity agriculture to more productive industrial and service sectors in the country. 5.2 Nigeria’s experience Of the three key reforms described in Section 3, Nigeria scored highly on two: domestic market oriented reforms around privatization and fiscal reforms aimed at improving the fiscal balance over the 1980 to 1999 period as shown in Figure 3. Previous work has described the Nigerian economic experience post policy adoption in the 1980s as dismal by citing decreases in GDP growth rates from 6.9 percent pre-adjustment to -1.7 percent in the post-period (Ekpo, 1992). In Nigeria, the main determinant of adoption of World Bank-funded reforms was the pressure to reach agreements on debt rescheduling (Ekpo, 1992; Devarajan, Dollar, and Holmgren, 2002). The second main determinant was the nature of leadership in power at the time and its commitment to the reform process. Nigeria has been a heavily oil commodity dependent country since the 1970s, with over 70 percent of government revenue from petroleum and petroleum exports as a share of total exports growing to over 90 percent in the 2000s (Archi-bong, 2018). The heavy dependence on oil exports has made the country very vulnerable to external price shocks, with deleterious implications for the ability to finance public spending and debt (Okonjo-Iweala, 2014). Following a drop in oil prices to between $8 and $10 per barrel in 1985-1987, and subsequent steep increases in the country’s debt to GDP ratio, Nigeria implemented policy reform in the form of structural adjustment programs with the support of the IMF and World Bank under then military president General Ibrahim Babangida. 10 Africa Growth Initiative at Brookings
A key driver of reform adoption was pressure to reach agreements on debt rescheduling as
mentioned earlier. The reform focused on fiscal tightening and privatization but also induced
severe cuts in social spending on education and health which reduced the wellbeing of Nigerian
citizens and increased hostility for the reforms in the 1980s and 1990s, contrary to the
Washington Consensus which emphasize reorientation of spending toward pro-poor programs.
The reforms were subsequently abandoned by the Babangida regime and the country continued
to be beset by poor macroeconomic policy over the following decades of military rule. As an
illustration, Nigeria continued to borrow and accumulated up to $30 billion in debt to the Paris
Club of Creditors even though the country earned more than $300 billion in crude oil revenues
over the 1970s-2001 period (Okonjo-Iweala, 2014). The debt became incredibly difficult to service
during periods of low oil prices in the mid-1980s. And while some of the oil revenue and borrowed
money was invested in needed infrastructure, education and health, lack of monitoring of
spending and opaque ad-hoc budgets meant there was a significant amount of spending on “white
elephant” projects like unproductive steel mills.
Following the transition to democracy in 1999 and under the helm of then President Olusegun
Obasanjo, Nigeria was faced with an unstable macroeconomic environment characterized by volatile
exchange rates, double digit inflation (23 percent per year in 2003), a relatively high fiscal deficit (3.5
percent of GDP in 2003) and low GDP growth (2.3 percent on average for the previous decade).
The country embarked on macroeconomic reforms under then finance minister Ngozi Okonjo-Iweala
aimed at stabilizing the macroeconomic environment and improving social in-dicators and general
economic performance. The focus of the reforms was on privatization, budget monitoring and,
crucially, investment in education and health under the National Economic Empowerment and
Development Strategy (NEEDS). As part of the NEEDS pol-icy and to reduce volatility in public finances,
Nigeria adopted an oil price-based fiscal rule (OPFT) that used the long-run (10 year) average oil price
to set government budgets and targets for spending. Based on the rule, the government would set
aside some excess revenues from oil in the form of a savings account called the Excess Crude Oil
Account (ECA) headquartered at the central bank. The fiscal rule, which was institutionalized in
national law in the Fiscal Responsibility Act signed in 2007, linked savings to fiscal discipline around
government spending, aiming for a fiscal deficit of 3 percent of GDP. The policy was successful both
in building fiscal discipline and helping Nigeria weather shocks like the financial crisis of 2008-2010
when oil prices fell from over $140 to $40 per barrel.
Over this period, Nigeria was able to draw on savings from the ECA to implement a fiscal stimulus of
around 0.5 percent of GDP and maintain public spending. Increased public savings between 2004
and 2006 as a result of policy reform had real positive effects on macroeconomic performance- leading
to fiscal surpluses of 7.7 percent of GDP in 2004 and 10 percent of GDP in 2005. The increased public
spending enabled Nigeria to pay off its external debt arrears of about $6 billion, increase its foreign
reserves from $7 billion in 2003 to $46 billion by the end of 2006, and implement tighter monetary
policy to reduce inflation from 21.8 percent in 2003 to 10 percent in 2004. The $6 billion in arrears
was paid as part of debt relief of a $30 billion debt, of which $18 billion was completely written off by
the Paris Club. This also helped to spur private sector investment. Growth averaged 8.1 percent a year
from 2003 to 2006 and the share of spending on health and education rose to 5 percent and almost
10 percent, for health and education in 2007, respectively.
Reforms also targeted sectors that were large drains on public finances for privatization in the
telecommunications sector, the downstream petroleum sector and the power sector, to name a few,

                                                                        Africa Growth Initiative at Brookings   11
Washington Consensus reforms and economic performance in sub-Saharan Africa: Lessons from the past four decades with varying degrees of success. Nigeria also benefited from the increase in oil prices in the post 2000 period, and both the reforms and increases in prices combined to create an attractive environment for private investors in the country. 5.3 Uganda’s experience Uganda, unlike its Nigerian counterpart, is often touted by IFIs as an example of successful application of reforms, although the details of reform present a mixed picture (Devarajan, Dollar, and Holmgren, 2002). Of the three key reforms described in Section 3, Uganda was one of a handful of countries that scored highly on all three: domestic market-oriented re-forms around privatization, fiscal reforms aimed at improving the fiscal balance and increased trade openness over the 1980 to 1999 period. Between 1971 and 1986, Uganda experienced economic decline, but GDP per capita rose by almost 40 percent between 1986 and 1996. In 1987, the country attained an IMF loan, with loan renewals occurring from 1989-1992 and again from 1992 to 1997. Real GDP per capita grew on average 4.2 percent per year between 1992 and 1997. The two main reforms mandated by the IMF in Uganda were trade liberalization and the progressive reduction of export taxation. The benefits of liberalized cash crop exports were large but limited and unequally distributed, with only a small number of rural coffee farmers experiencing increases in rural per capita incomes over the period of policy reform from 1988 to 1995. Uganda also privatized its public enterprises in a move that was highly criticized within the country. The main critique was that the privatization had proceeded too rapidly, with relatively little oversight. As a result, the privatizations benefited government and corporate interests of advanced economies rather than the Ugandan population. While public spending on healthcare increased along with government spending, the share of health in the budget did not. In fact, it declined slightly between 1989 and 1994. In 1998, Uganda was also the first country to receive debt relief under the HIPC initiative, some $650 million reduction in Uganda’s multilateral debt stock, although the reduction was delayed by a year which amounted to $193 million in lost relief benefits. With the delay, public funds were diverted from spending on health care provision toward debt repayments. A key difference between the Nigerian and Ugandan cases was the relatively higher commitment and spearheading of reform policies in Uganda. The strong commitment from Uganda could have been due to the country’s external financing/HIPC status as well. Between 2000 and 2019, Uganda, a non-commodity dependent country, experienced stable growth rates of around 6.3 percent per year on average. Reforms in the agricultural sector have been credited with halving between 1992 and 2013 the share of households in poverty. Even so, the country still faces challenges in translating recorded growth rates into improvements in human capital like reductions in child stunting and increases in educational attainment for most of its population. 5.4 Senegal’s experience Senegal is another country where reforms have been judged to be largely unsuccessful (Kingston, 2011). Of the three key reforms described in Section 3, Senegal scored highly on two: domestic market-oriented reforms around privatization and fiscal reforms. The country has a mostly agricultural economy and first received IMF loans in 1984. It completed further transactions with the IMF between 1984 and 2002 under structural adjustment programs. As 12 Africa Growth Initiative at Brookings
part of the SAP, Senegal implemented policies to stabilize the financial sector stabilization and cut
public spending by 40 percent. Subsidies for staple foods like cooking oil, rice and sugar were reduced
or eliminated, resulting in sharp increases

in domestic prices. Privatization of state-owned enterprises followed in the 1980s. Increased
unemployment among public sector workers was one consequence of these reforms. The country
reduced debt from 86.2 percent of GDP in 1994 to 71.3 percent in 2000, though some critics
pushed back against the benefit of lower debt amidst rising unemployment and declining human
capital (Kingston, 2011). Senegal also experienced significant declines in its agricultural sector’s
contribution to GDP from an average of 18.8 percent in the 1980s to 8.5 percent in 1999. Food
production per capita experienced significant declines along with a reduction of the share of
primary commodities and food produced domestically.
Since the 2000s, the country has experienced notable increases in economic growth, with GDP growth
averaging 4.6 percent between 2000 and 2019. Senegal is not a commodity dependent country, and
the services sector was the largest contributor to GDP growth in recent years. The country’s stable
political climate and attractive macroeconomic environment have been cited as drivers of significant
increases in investment over the last few decades.

6. Discussion and concluding remarks
The speed with which many of the reforms were carried out initially, especially domestic reforms like
privatization of SOEs, without careful consideration of the environment of in-complete markets and
the institutional challenges faced by African governments, affected the initial effectiveness of policy
implementation and contributed to lower growth rates during the 1980 to 1999 reform period. Over
time, countries and their partners learned from past experiences and improved design and
implementation of reforms. While total investment as a share of GDP fell through the 1980s period,
investment shares stabilized as governments invested in public infrastructure and shoring up security
within countries following the democratization wave in the 1990s. By the late 1990s, inflation was
significantly reduced.
The improved macroeconomic environment, in addition to the commodity super cycle of the 2000s
and debt reductions, helped to attract more private investment in key sectors like retail, wholesale,
telecommunications and manufacturing that accounted for a significant share of the growth increases
in the 2000 to 2019 period.

Although the patterns explored here are informative, the empirical evidence presented in this
paper do not establish causal effects of Washington Consensus policy adoption on economic
performance in African countries. Per capita economic growth was low for reform-ers over much
of the reform period from 1980-1999. The low economic performance may have been a motivator
for the reforms, or the lower economic performance may have resulted from the short-term
negative effect of the reforms. Both factors were likely at play.
The Washington Consensus framework contained some caveats that were subsequently lost in
policy design, creating wedges between the theory of policy reform and the realities of
implementation. It cautioned against capital account liberalization and, importantly, warned that
privatization should occur with strict regulation only in competitive markets. They also advocated

                                                                     Africa Growth Initiative at Brookings   13
Washington Consensus reforms and economic performance in sub-Saharan Africa: Lessons from the past four decades for pro-poor fiscal expenditures and advised against abolishing deregulation designed for safety or environmental reasons. In practice, African governments seeking immediate debt relief were often under significant pressure to quickly meet IFI policy measures under debt conditionality. The weakening of state apparatuses essential in implementing effective reform further reduced the ability of African governments to effectively regulate the pace of policy adoption, with sometimes detrimental consequences for their populations in the initial reform period. As illustrated through the country case studies, reform experience and outcome differed across countries depending on the particular policy and macroeconomic environments, along with the specific policy objectives of governments in different countries. Policy adoption itself was a political affair, a fact that has largely been ignored in previous analyses of Washington consensus policy reforms (Mkandawire and Olukoshi, 1995; Mkandawire and Soludo, 1999; Mkandawire, 1999; Herbst, 1990). While international financial institutions often attributed the lack of success with the reform agenda to weak state capacity, the focus on market orientation and limiting state intervention in development activities led to market failures. State intervention was actually important to implement successful market-oriented reforms in some cases (Mkandawire, 1999). The criticism of pre-reform policies in Africa is contradicted by the success of de-velopment policies in the period immediately post-independence in the 1960s and 1970s (Mkandawire, 1999). Some of the policies that were abandoned in favor of market-oriented reforms had rational, development-motivated justifications. For example, states promoting low interest rates sought to boost investment and capital accumulation. Weaker financial systems with limited competition hindered the achievement of this objective. Subsidies to the agricultural sector, although theoretically inefficient, kept prices low to facilitate access to food for many who lived in poverty, and to reduce the risk of social unrest. Protests against food prices erupted following the removal of subsidies in the 1980s and 1990s. The reforms were often viewed as an infringement on the national sovereignty of countries, which spurred deep resentment among many governments and populations. The irony of effective market oriented reforms is that their implementation requires stable and committed government with a high level of social and political capital. The overwhelming focus of the reforms on macroeconomic stability without the adequate provision of the social safety nets contributed to weaken governments and undermine the reform agenda. The skeptics of these market oriented reforms in the African context point to the ex-ample of countries in Asia where governments played a dominant role for much of the critical phase of their economic development. Even though many Asian countries and African countries were at similar levels of economic development in the 1960s, the former generally enjoy a much higher level of development today. Similarly, many of today’s developed economies did not embrace widespread free market economies in the earlier phases of their economic development. Their development experience was characterized by state involvement in and control of many sectors. They embraced industrial policies and infant industry protection, heavily subsidized sectors of economies etc. 3 Many of these same practices were frowned upon in Africa by proponents of market-oriented policies. Even though there is no panacea when it comes to economic reforms, the following lessons provide a useful general guide going forward: First, while market-oriented reforms can be beneficial for growth, each reform policy needs to be carefully considered in the institutional contexts, initial conditions of 3 See for example Chang (2002), for a historical perspective on the development experience of today’s advanced economies. 14 Africa Growth Initiative at Brookings
development and socio-political environment, among others. Second, ownership of the reform agenda
by local government with stakeholder buy-in is important to encourage support for the reforms and
increase the likelihood of success. Third, the negative spillovers of reform policies need to be
minimized. Investment in social safety nets is a crucial part of reforms to protect the most vulnerable
populations within the countries. Fourth, where reforms aim to achieve macroeconomic stability, they
should not trade away social investment in human capital like education and health. Finally, reforms
should be a process of continuous reevaluation, adjustment, and recalibration over the reform period.
There is not and will never be a one-size-fits all approach when it comes to economic development,
and the reform agenda should be approached carefully and with flexibility.

                                                                     Africa Growth Initiative at Brookings   15
Washington Consensus reforms and economic performance in sub-Saharan Africa: Lessons from the past four decades 7. Figures and tables Figure 1: Median real GDP per capita growth rates in SSA, 1980-2019 Figure 2: Median consumer price index, inflation in SSA, 1980-2019 16 Africa Growth Initiative at Brookings
Figure 3: Median primary fiscal balance as a percentage of GDP in SSA, 1980-2019

Figure 4: Share of countries with at least one privatization deal in SSA, 1988-2008

                                                                  Africa Growth Initiative at Brookings   17
Washington Consensus reforms and economic performance in sub-Saharan Africa: Lessons from the past four decades Figure 5: Total number of privatization deals in SSA, 1988-2008 Figure 6: Share of countries open to international trade in SSA, 1980-2005 18 Africa Growth Initiative at Brookings
Figure 7: Total investment as a percentage of GDP in SSA, 1980-2019

Figure 8: African countries by HIPC and Commodity dependent status

                                                              Africa Growth Initiative at Brookings   19
Washington Consensus reforms and economic performance in sub-Saharan Africa: Lessons from the past four decades
Table 1: Reform countries in Sub-Saharan Africa (SSA)
Domestic Market-Oriented
Reforms Trade Openness Fiscal Reforms
Burundi Benin Angola
Benin Botswana Benin
Cote d’Ivoire Cote d’Ivoire Central African Republic
Ghana Cameroon Cote d’Ivoire
Kenya Cabo Verde Congo, Dem. Rep.
Mozambique Ghana Congo, Rep.
Malawi Guinea Gabon
Nigeria Gambia, The Guinea
Senegal Guinea-Bissau Guinea-Bissau
Togo Kenya Kenya
Tanzania Mali Madagascar
Uganda Mozambique Mozambique
South Africa Mauritius Nigeria
Zambia Niger Rwanda
Zimbabwe Tanzania Senegal
Uganda Eswatini
South Africa Seychelles
Tanzania
Uganda
Table 2: Reforms and average per capita real GDP growth (%)
Reforms Type 1980-1999 2000-2019 Difference
All countries 0.2 1.6 +1.4
Fiscal reforms Reformers -0.3 1.5 +1.8
Non-reformers 1 1.8 +0.8
Domestic market-oriented reforms Reformers -0.6 1.5 +2.1
Non-reformers 0.2 1.6 +1.4
Trade-openness Reformers 0.8 1.9 +1.1
Non-reformers -0.2 1.1 +1.3
20 Africa Growth Initiative at BrookingsTable 3: Reforms and average per capita real GDP growth (%) by debt relief recipient status
Type Reforms 1980-1999 2000-2019 Difference
All countries 0.2 1.6 +1.4
Non debt relief 1.7 2 +0.3
Debt relief All beneficiaries of debt relief -0.3 2 +2.3
Fiscal reformer -0.4 2.2 +2.6
Fiscal non-reformer 0.4 1.6 +1.2
Market reformer -0.1 2.5 +2.5
Market non-reformer -0.3 1.8 +2.1
Openness reformer -0.2 2.2 +2.3
Openness non-reformer -0.7 1.8 +2.6
Table 4: Reforms and average per capita real GDP growth (%) by commodity dependent status
Type Reforms 1980-1999 2000-2019 Difference
All countries 0.2 1.6 +1.4
Non commodity dependent 0.4 2.2 +1.9
Commodity dependent All dependent countries 0.4 1.8 +1.4
Fiscal reformer -0.1 1.5 +1.6
Fiscal non-reformer 0 1.6 +1.7
Market reformer 0 2.5 +2.5
Market non-reformer 0.1 1.5 +1.4
Openness reformer 0.5 1.9 +1.4
Openness non-reformer 0.2 1.3 +1.1
Africa Growth Initiative at Brookings 21Washington Consensus reforms and economic performance in sub-Saharan Africa: Lessons from the past four decades
References
Adedeji, Adebayo. 1999. “Structural adjustment policies in Africa.” International Social Science
Journal 51 (162): 521–528.
Archibong, Belinda. 2018. “Historical origins of persistent inequality in Nigeria.” Oxford Development
Studies 46 (3): 325–347.
Ariyo, Ademola, and Afeikhena Jerome. 1999. “Privatization in Africa: an appraisal.” World
Development 27 (1): 201–213.
Bayliss, Kate, and Christopher Cramer. 2003. “3 Privatisation and the post-Washington con-sensus.”
Development Policy in the Twenty-First Century: Beyond the Post-Washington Consensus p.
52.
Birdsall, Nancy, Felipe Valencia Caicedo, and Augusto De la Torre. 2010. The Washington consensus:
assessing a damaged brand. The World Bank.
Chang, Ha-Joon. 2002. “Breaking the mould: an institutionalist political economy alterna-tive to the
neo-liberal theory of the market and the state.” Cambridge Journal of Economics 26 (5): 539–
559.
Chari, Anusha, Peter Blair Henry, and Hector D Reyes. 2020. “The Baker Hypothesis.” National Bureau
of Economic Research Working Paper .
Coulibaly, Brahima S. 2017. “In Defense of the ‘Africa Rising’ Narrative.” Africa in Focus. https://www.
brookings. edu/blog/africa-in-focus/2017/06/27/in-defense-of-the-africa-rising-narrative/.
Accessed August 7: 2019.
Coulibaly, Brahima S, Dhruv Gandhi, and Lemma W Senbet. 2019. “Is sub-Saharan Africa facing
another systemic sovereign debt crisis?”.
Devarajan, Shantayan, David R Dollar, and Torgny Holmgren. 2002. Aid and reform in Africa. The World
Bank.
Dollar, David, and Jakob Svensson. 2000. “What explains the success or failure of structural
adjustment programmes?” The Economic Journal 110 (466): 894–917.
Due, Jean M, and Christina H Gladwin. 1991. “Impacts of structural adjustment programs on African
women farmers and female-headed households.” American Journal of Agricultural Economics
73 (5): 1431–1439.
Easterly, William. 2000. “The effect of IMF and World Bank programs on poverty.” Available at SSRN
256883 .
Easterly, William. 2019. In search of reforms for growth: New stylized facts on policy and growth
outcomes. Technical report National Bureau of Economic Research.
Ekpo, Akpan H. 1992. “Economic development under structural adjustment: evidence from
selected West African countries.” Journal of Social Development in Africa 7 (1): 25–43.
22 Africa Growth Initiative at BrookingsYou can also read