Water Footprint Assessment of Carbon in Pulp Gold Processing in Turkey - MDPI

Page created by Tracy Lewis
 
CONTINUE READING
Water Footprint Assessment of Carbon in Pulp Gold Processing in Turkey - MDPI
sustainability

Article
Water Footprint Assessment of Carbon in Pulp Gold Processing
in Turkey
Emre Güney *              and Nuray Demirel

                                          Mining Engineering Department, Middle East Technical University, 06800 Ankara, Turkey; ndemirel@metu.edu.tr
                                          * Correspondence: emre.guney@metu.edu.tr

                                          Abstract: This paper presents water the footprint assessment (WFA) of carbon in pulp (CIP) gold
                                          processing. The main objectives of the study are determining grey and blue water footprints and
                                          identifying the hotspots of the process. Results revealed that the total blue water footprint, including
                                          the extraction and processing of the gold, was found to be 452.40 m3 /kg Au, and the grey WF to
                                          be 2300.69 m3 /kg Au. According to the results, the lost return flow on the direct blue WF side has
                                          the largest contribution, with a value of 260.61 m3 /kg Au, and the only source of the lost return
                                          flow is the tailing pond. On the indirect side, it is seen that the oxygen consumption used for the
                                          leaching process has the highest value, with 37.38 m3 /kg. Among the nine contaminants in the
                                          mine tailings, the critical component responsible for the grey water footprint is by far arsenic, with
                                          a value of 1777 m3 /kg Au. The results will be used to make recommendations for reducing water
                                          consumption in mining operations, for a better design for the environment. The study is a pioneering
                                          study, being the first implementation of water footprint assessment in a gold mine in Turkey.

                                          Keywords: sustainability; water footprint; water footprint assessment; gold processing; sustainable
         
                                   water use; Turkey; water resource management

Citation: Güney, E.; Demirel, N.
Water Footprint Assessment of
Carbon in Pulp Gold Processing in
                                          1. Introduction
Turkey. Sustainability 2021, 13, 8497.
https://doi.org/10.3390/su13158497               Water resource management is one of the greatest global challenges of the 21st cen-
                                          tury [1]. In Global Risk Reports (2019), while water crisis risk was not even listed in the top
Academic Editors:                         10 risks in terms of impact in the world in 2009, after that year it has always been among
Kwame Awuah-Offei and Que Sisi            the top 5, although its location has been constantly changing. Water crisis risk ranks 4th in
                                          2019. Its supply and accessibility are vital for all sectors, including the mining industry, as
Received: 30 June 2021                    it is one of the key water consumers [2].
Accepted: 24 July 2021                           The mining industry, relying on water as an industrial input during operations, needs
Published: 29 July 2021                   to adopt better water management strategies to sustain its viability and growth. Gold
                                          mining also results in water consumption and may cause severe water pollution [3,4]. In
Publisher’s Note: MDPI stays neutral      mining operations, water is used for mineral processing, material handling of ore and
with regard to jurisdictional claims in   waste in the form of slurry, dust control, drilling, cooling systems, cleaning machinery
published maps and institutional affil-
                                          and equipment, remediation of mine sites, and to support the workforce (for drinking
iations.
                                          water and sanitation). Moreover, water drainage, when water table is exceeded, further
                                          contributes to the reduction of the available water sources.
                                                 Research studies revealed that about 70 percent of the mining activities under the largest
                                          global mining companies are in water-stressed countries. Water issues have emerged in 58 per-
Copyright: © 2021 by the authors.         cent of the mining cases filed by IFC’s Compliance Offer Ombudsman (CAO), an independent
Licensee MDPI, Basel, Switzerland.        referral mechanism that responds to the complaints of the proposed communities [5].
This article is an open access article           When this is issue examined specifically in the mining sector in Turkey, it is a fact
distributed under the terms and
                                          that Turkey shares the same fate as the world. Studies show that with the impact of
conditions of the Creative Commons
                                          population growth and climate change, water availability is expected to decrease from
Attribution (CC BY) license (https://
                                          1500 m3 /person/year to 1000 m3 /person/year by 2050. Turkey is among the countries
creativecommons.org/licenses/by/
                                          that will experience water scarcity in the coming years [6,7]. From the mining point of view,
4.0/).

Sustainability 2021, 13, 8497. https://doi.org/10.3390/su13158497                                     https://www.mdpi.com/journal/sustainability
Sustainability 2021, 13, 8497                                                                                           2 of 16

                                the Turkish Statistical Institute (TUIK) has produced data on mining, water, wastewater,
                                and waste Statistics, considering the OECD/EUROSTAT’s definition, scope, classifications,
                                and international regulations, every 2 years since 2010. According to the report published
                                by the TUIK, mining operations drew a total of 55 million m3 of water from wells, the
                                sea, pit lakes, rivers, lakes, and other sources in 2010 [8]. This number was found to be
                                116 million m3 in 2012 [9], 220 million m3 in 2014 [10], 241 million m3 in 2016 [11], and
                                219 million m3 in 2018 [12]. The problems caused by water scarcity in the mining sector
                                will continue to grow steadily, since the amount of high-grade ore is decreasing. Therefore,
                                the industry will begin to produce lower-grade ores that require an increasing amount of
                                water [13]. Considering the increasing water demand due to the growth in production and
                                the upcoming water scarcity crisis, it is inevitable that mines should quantify and assess
                                their water footprints through adapting effective water management strategies.
                                      Over the last two decades, the pressure of the water management challenge has
                                led to the improvement of approaches to measuring the water consumption and water
                                pollution of regions, products, and processes. One of the new approaches is the water
                                footprint (WF) concept. The WF concept is an indicator of freshwater appropriation,
                                with the aim to quantify and map the direct and indirect volumetric water use and show
                                the relevance of involving consumers and producers along the supply chains in water
                                resources management [14]. The Water Footprint Assessment (WFA) developed a means of
                                quantifying and locating the WF of a process, a product, a consumer, a consumer group, a
                                geographically determined area, a nation, a business, a municipality or another government
                                agency, a catchment, or a river basin, to evaluate the environmental, social, and economic
                                sustainability of the calculated WF and to produce a solution to lower the calculated WF
                                and achieve a more sustainable process [15].
                                      Despite the developments in the WF, the global interest in the mining has remained
                                limited. These studies are concentrated in South America and South Africa, and there has
                                been no previous study on this subject in Turkey. Moreover, most of the studies are on
                                copper and platinum mining, and there is no study in the literature in a process facility
                                operating with the Carbon in pulp (CIP) processing method in detail. Considering the
                                limited understanding of the variability and size of water resource use between regions
                                where mining is actively carried out, this study is expected to contribute significantly to
                                the literature in one more region and one more processing method.
                                      One of the studies on this topic measured the consumption of only blue WF for the
                                extraction of copper from both copper sulphide ore and copper oxide ore in the Atacama
                                Desert, Chile [16]. Green and grey water footprints were not included in the study. The
                                results obtained belong to the copper cathode produced from copper sulphide, with the
                                largest blue WF value of 96 m3 /t. For the copper cathode produced from copper oxide
                                ore, the value was 40 m3 /t. At the end of the study, it was emphasized that the water
                                consumption of the processing plants could be reduced by 50–70% by using sea water in
                                the facilities, reducing evaporation and using more water from the waste dam. The study
                                voiced uncertainties regarding the water footprint and the weak controls of operations
                                over the amount of water evaporated or lost.
                                      Another study was conducted by Haggard et al. (2013) in a platinum mine in South
                                Africa [17]. In this study, two different water footprint calculation tools were used, and the
                                results were compared. The first tool used is the WFA, and the second tool is the Water
                                Miner software. In the study conducted for the tailing roof of two concentrate plants, the
                                total of WF was found to be 11,811 ML/a, and the biggest contribution was the inflow
                                water footprint. The results obtained with the Water Miner tool also show that the volume
                                of water imported is equal to 5719 ML/a, while the water exported amounts to 5253 ML/a.
                                      The study by Harding et al. (2014) was conducted in South Africa, and only the blue WF
                                value of a platinum mine was calculated [18]. In this study, grey and green water footprints
                                were not calculated. According to the results of the study, the total blue water footprint,
                                including direct and indirect consumption, was calculated to be 2229 × 103 m3 /ton of refined
                                platinum. Uncertainties about the weak controls of operations over the amount of water
Sustainability 2021, 13, 8497                                                                                            3 of 16

                                evaporated or lost were articulated in the study. It was also stated that the information
                                detailing the water flows within the mineral processing plant is limited.
                                      Pardavé and Delvasto (2017) conducted a water footprint assessment study in Colom-
                                bia [19]. The aim of the study was to calculate the water footprint and to evaluate the water
                                usage of the Reina de Oro gold plant in Vetan, Colombia (Santander), which is a small-scale
                                mine using mercury. In this study, blue and grey water footprints were examined separately.
                                However, these calculations were made by taking instant data from the field instead of
                                formulas of the water footprint concept.
                                      Another study was conducted by Osman et al. (2013) in South Africa for a base metal
                                refinery (BMR) [20]. In this study, the data were taken directly from the field via flow
                                meters. With the data collected in the study, a water balance diagram was obtained by
                                using the Water Accounting Framework. In the study, blue, grey, and green WF values
                                were calculated. The values obtained were, respectively, 33.4 m3 /tonne of base metal
                                product for blue WF, 10.5 m3 /tonne of base metal product for green WF, and 0 m3 /tonne
                                of base metal product for grey water, since BMR did not have waste water discharge.
                                      In the study by Islam and Murakam (2020), a blue, green, and grey WF study was
                                conducted for an open pit copper mine in Laos. According to the results obtained from
                                the study, blue, green, and grey WF was found as 988.83 m3 /tonne, 52.04 m3 /tonne, and
                                69.78 m3 /tonne of copper concentrate, respectively. In this study, the results also show
                                that the grey water footprint was reduced five times as a result of the treatment plant
                                established. In the study, it is stated that the biggest source of blue WF is the electricity
                                obtained from the hydroelectric power plant. The Mn concentration was found to be the
                                first among the chemicals contributing to the grey water footprint. With this study, it has
                                been revealed that the grey water footprint can be reduced with treatment in mining [21].
                                      Another study in which the direct and indirect WF calculation model was developed
                                for the iron and steel industry, by Gu et al. (2015), focused on an iron factory in Eastern
                                China. The study found that the blue WF amounted to 2.24 × 10⁷ m3 for 2011, while the
                                grey WF amounted to 6.5 × 10⁸ m3 . In general, the grey water footprint was found to be
                                high, and it was stated that this was a great risk. In addition, the contribution of the iron
                                and steel industry sector to China’s total footprint was calculated as 0.4% in the study [22].
                                      The application of this methodology in different mines has been a guide for this study.
                                Where and how the methodology will be applied in the mining sector, the points to be
                                considered for direct and indirect WF calculation, and the units that will be caused by the
                                grey water footprint are examples for this study. However, it should be noted that there is
                                no study that directly examines gold mining and the CIP method alone. At the same time,
                                the WFA methodology has not been applied to the mining industry in Turkey before.
                                      The main purpose of this research study is to determine the direct blue WF, indirect
                                WF, and grey WF values for both the extraction and processing facility sides of a mine
                                using Carbon in Pulp (CIP) with the WFA methodology and to identify the hotspots. The
                                results may be used to formulate a response to the water consumed in mining activities
                                and, therefore, to the negative impact on the environment, and as a means of ensuring a
                                sustainable production. This study was carried out on a mine in Turkey. In this sense, this
                                study will be the first in this field, considering that there is no previous no study on a gold
                                mine in Turkey. At the same time, there is no detailed study of the water footprint of CIP
                                management. In this study, all operations of the process plant are examined separately for
                                both direct and indirect blue WF.

                                2. Materials and Methods
                                2.1. Data
                                     For the implementation of the water footprint assessment of gold processing, the
                                mines operating in Turkey that process gold ore using the CIP method were taken as
                                reference. Technical reports, sustainability studies, and a literature review for these mines
                                were examined in detail. Water balance calculation was made in the facility created by
                                blending these water footprints, and was obtained separately for each of the upstream
Sustainability 2021, 13, x FOR PEER REVIEW                                                                                                         4 of 17

                                               For the implementation of the water footprint assessment of gold processing, the
Sustainability 2021, 13, 8497                                                                                                        4 of 16
                                         mines operating in Turkey that process gold ore using the CIP method were taken as ref-
                                         erence. Technical reports, sustainability studies, and a literature review for these mines
                                         were examined in detail. Water balance calculation was made in the facility created by
                                      andblending   these water
                                           downstream            footprints,
                                                          processes.         anddata
                                                                       All the    wascollected
                                                                                       obtained and
                                                                                                separately for each
                                                                                                    processed       of theprocessing
                                                                                                                for gold   upstream were
                                         and downstream processes. All the data collected and processed for gold processing were
                                      justified through publicly available data and references. The process flow sheet belonging
                                         justified through publicly available data and references. The process flow sheet belonging
                                      to the CIP process is illustrated in Figure 1.
                                         to the CIP process is illustrated in Figure 1.

                                                       Figure1.1.Flow
                                                     Figure       Flow diagram
                                                                       diagram of
                                                                               ofgold
                                                                                  goldprocessing.
                                                                                       processing.

                                             TheThegrade
                                                      gradeof of the
                                                                 the ore
                                                                      ore isis4.36
                                                                                 4.36g/ton.
                                                                                       g/ton.  In order
                                                                                                     In orderto find tothe
                                                                                                                         findwater
                                                                                                                                 the consumption
                                                                                                                                       water consumption  in the de- in the
                                          signed   facility, the  solids  by   mass   ratio   (pulp     ratio)   used   in
                                      designed facility, the solids by mass ratio (pulp ratio) used in the processes, the   the  processes,      the  surface    areas
                                                                                                                                                                     surface
                                          of the tanks, the thickener, and the tailing pond were also determined on the basis of re-
                                      areas of the tanks, the thickener, and the tailing pond were also determined on the basis
                                          alistic data [23–28]. Water is supplied from water wells to the processing plant. The do-
                                      of realistic data [23–28]. Water is supplied from                          water wells to the processing plant. The
                                          mestic wastewater discharge amounts to 30 m3/day                         [29]. The value provided by Northey
                                                                                                               3 /day
                                      domestic     wastewater       discharge       amounts       to   30
                                          and Haque (2013), 0.15 m /ton, was used for the pit dewatering
                                                                           3                                m            [29]. The      value
                                                                                                                                    value         provided
                                                                                                                                             in the   mine [34  by30].
                                                                                                                                                                    Northey
                                      and Haque        (2013),   0.15   m 3 /ton, was used for the pit dewatering value in the mine [30].
                                                As illustrated in Figure 1, the facility consists of a 3-stage crusher unit to reduce size.
                                             As illustrated
                                          Water   is sprayed on  in the
                                                                     Figure     1, the
                                                                         relevant         facility
                                                                                     points           consists
                                                                                               in order              of a 3-stage
                                                                                                             to suppress      the dust.crusher
                                                                                                                                            In orderunit   to reduce size.
                                                                                                                                                        to calculate
                                      Water    is sprayed     on   the  relevant      points     in  order      to   suppress
                                          this amount of water, it was considered that there was a water spray for each crusher     the   dust.    In order     to calculate
                                                                                                                                                                    in
                                      thisthe
                                            amount
                                               unit as of  water, it was considered
                                                        a representative,      and the water     that    there was avalue
                                                                                                    consumption            water  forspray     for each
                                                                                                                                      these sprays       was crusher
                                                                                                                                                                deter- in the
                                      unitmined    as 10 lpm [31]. The
                                             as a representative,       andoutput      of theconsumption
                                                                               the water         crushing circuit         is fed
                                                                                                                      value    fortothese
                                                                                                                                       the grinding
                                                                                                                                              sprays was  circuit  via
                                                                                                                                                                determined
                                          the  fine ore  bin.  Here,   lime   is added      to the   grinding       circuit  at
                                      as 10 lpm [31]. The output of the crushing circuit is fed to the grinding circuit via the  the  same     time   to  adjust   the
                                      finerequired
                                             ore bin.pHHere,
                                                          value. lime
                                                                   The grinding
                                                                          is added   circuit
                                                                                          to theconsists
                                                                                                     grindingof a rod    mill with
                                                                                                                      circuit   at the75%same solidstime
                                                                                                                                                       by mass    and the
                                                                                                                                                              to adjust
                                          a ball  mill  with  72%    solids   by   mass    [28,32].   Water      is  added
                                      required pH value. The grinding circuit consists of a rod mill with 75% solids by mass  to  the   grinding     unit   from   the and
                                          process water tank. At the end of the circuit, the grinded material is fed to the hydrocy-
                                      a ball mill with 72% solids by mass [28,32]. Water is added to the grinding unit from the
                                          clone from the slurry box. The upper flow of the hydrocyclone is reported to the thickener.
                                      process water tank. At the end of the circuit, the grinded material is fed to the hydrocyclone
                                          The thickener’s overflow gravitates to the process water tank, while the thickener’s un-
                                      from    the slurry
                                          derflow    has 50%box.    Thepumped
                                                                solids    upper flow  to the ofleach
                                                                                                 the hydrocyclone
                                                                                                         circuit [33]. Theispulp   reported
                                                                                                                                          fed fromto the
                                                                                                                                                       thethickener.
                                                                                                                                                            leaching The
                                      thickener’s
                                          tanks to theoverflow
                                                          adsorptiongravitates      to the
                                                                         unit is then         process
                                                                                           sent   to the water
                                                                                                            eluation   tank,   while
                                                                                                                         circuit          the thickener’s
                                                                                                                                    to separate     the gold fromunderflow
                                      hasthe50%   solids pumped
                                               activated   carbons. The to the
                                                                             pulp,leach
                                                                                     which circuit
                                                                                               is free[33].
                                                                                                          from The    pulp fed
                                                                                                                  activated         from the
                                                                                                                               carbons,           leaching
                                                                                                                                             is sent            tanks to the
                                                                                                                                                       to the chem-
                                      adsorption      unit(Detox)
                                          ical treatment     is thencircuit.
                                                                        sent toAfter
                                                                                   the eluation
                                                                                          this process, circuit
                                                                                                              it is to  separatetothe
                                                                                                                    transferred          thegold
                                                                                                                                              tailingfrom
                                                                                                                                                        pond. the activated
                                      carbons.  AsThe    pulp,
                                                    a result   of which     is freeconducted
                                                                  the research        from activated for thiscarbons,
                                                                                                                  study, pan  is sent     to the chemical
                                                                                                                                  evaporation       data weretreatment
                                                                                                                                                                   ob-
                                          tainedcircuit.
                                      (Detox)     from theAfter
                                                              EIA Application
                                                                    this process,    Fileitof
                                                                                            isthe  Ovacık Gold
                                                                                               transferred              Mine
                                                                                                                    to the      Third pond.
                                                                                                                             tailing     Waste Storage Facility
                                           As a result of the research conducted for this study, pan evaporation data were
                                      obtained from the EIA Application File of the Ovacık Gold Mine Third Waste Storage
                                      Facility Project to calculate the blue WF. The data from this report are taken from the
                                      Turkish State Meteorological Service’s Bergama Station. Evaporation data were formed
                                      by taking the average of the data collected between 1960 and 2012 [26]. When calculating
                                      the blue WF, if rainwater is also collected and used for consumption, it is necessary to
                                      distinguish this value from the green WF. Here, according to the methodology, if rainwater
                                      was not collected, it would come in a run-off state. However, since this water was collected
                                      and used for consumption, it was taken from the run-off. Therefore, this water can also
Project to calculate the blue WF. The data from this report are taken from the Turkish State
                                  Meteorological Service’s Bergama Station. Evaporation data were formed by taking the
                                  average of the data collected between 1960 and 2012 [26]. When calculating the blue WF,
Sustainability 2021, 13, 8497     if rainwater is also collected and used for consumption, it is necessary to distinguish
                                                                                                                       5 of this
                                                                                                                            16
                                  value from the green WF. Here, according to the methodology, if rainwater was not col-
                                  lected, it would come in a run-off state. However, since this water was collected and used
                                  for consumption, it was taken from the run-off. Therefore, this water can also be counted
                                be counted as the blue WF according to the situation specified in the methodology [14].
                                  as the blue WF according to the situation specified in the methodology [14]. As in the case
                                As in the case of evaporation, the amount of rain per square meter has been taken from
                                  of evaporation, the amount of rain per square meter has been taken from the Ovacık Gold
                                the Ovacık Gold Mine Third Waste Storage Facility Project EIA Implementation File. The
                                  Mine Third Waste Storage Facility Project EIA Implementation File. The monthly evapo-
                                monthly evaporation amount (mm) and precipitation amount (mm) are shared in Figure 2.
                                  ration amount (mm) and precipitation amount (mm) are shared in Figure 2.

                                                                         300
                                    Month Pan Evaporation and Rainfall
                                                                         250

                                                                         200

                                                                         150
                                                 (mm)

                                                                         100

                                                                         50

                                                                          0

                                                                                    Evaporation   Rainfall

                                  Figure 2. Monthly evaporation amount (mm) and precipitation amount (mm) [26].
                                Figure 2. Monthly evaporation amount (mm) and precipitation amount (mm) [26].

                                     InInaddition,
                                           addition,the
                                                      thegroundwater
                                                           groundwatermixed
                                                                          mixedwith withthe
                                                                                          theore
                                                                                               ore
                                                                                                 is is also
                                                                                                     also   used
                                                                                                          used  inin
                                                                                                                   thethe calculations.
                                                                                                                        calculations. InIn
                                  addition,a adata
                                addition,       dataanalysis
                                                     analysisbased
                                                                basedononthe
                                                                           theliterature
                                                                                 literaturewas
                                                                                             wasmade
                                                                                                   madetotocalculate
                                                                                                              calculatethe
                                                                                                                         thevalue
                                                                                                                             valueofof
                                                                                                                                     thethe
                                  embedded      virtual blue  WF  calculated     for  the amount      of diesel used
                                embedded virtual blue WF calculated for the amount of diesel used in the production    in the  production
                                  stagesininthe
                                stages        themine,
                                                  mine,the
                                                         theamount
                                                              amountofofelectricity
                                                                          electricityused
                                                                                        usedininthe
                                                                                                  the    mine,
                                                                                                      mine,    the
                                                                                                             the    chemicals
                                                                                                                 chemicals      used,
                                                                                                                              used, andand
                                  other  sources.  The  results are shown    in
                                other sources. The results are shown in Table 1. Table  1.

                                  Table
                                Table    Unit
                                      1. 1.   WF
                                            Unit  values
                                                 WF      of of
                                                    values  thethe
                                                                 materials used
                                                                   materials    in in
                                                                             used  thethe
                                                                                        mine.
                                                                                          mine.

                                                               SourceSource             WF per Unit
                                                                               WF per Unit                Unit
                                                                                                         Unit               Reference
                                                                                                                        Reference
                                    SodiumSodium
                                             Cyanide  Cyanide        0.1956       0.1956       m3 /kg m /kg
                                                                                                           3
                                                                                                                            [30][30]
                                          Lime    Lime                 0.02         0.02         3
                                                                                               m /kg     m 3/kg
                                                                                                                            [30][30]
                                   Hydrochloric    Acid              0.0254                    m 3 /kg                      [30][30]
                                         Hydrochloric Acid                        0.0254                 m /kg
                                                                                                           3

                                       Explosives                    0.0338                    m 3 /kg                      [30][30]
                                              Explosives                          0.0338                 m /kg
                                                                                                           3
                                        Electricity                   0.021                   m3 /kWh 3                   [30,34]
                                              Electricity                          0.021                m /kWh                [30,34]
                                         Oxygen                      0.0042                    m3 /kg                       [30]
                                                Oxygen
                                    Activated Carbon                  0.012       0.0042       m3 /kg m /kg
                                                                                                           3
                                                                                                                            [35][30]
                                         Activated
                                          Diesel        Carbon       0.0013        0.012         3
                                                                                               m /kg     m 3/kg
                                                                                                                            [30][35]
                                                 Diesel                           0.0013                 m /kg
                                                                                                           3                     [30]
                                     To calculate the grey WF, the pollutant load is obtained from a weekly tailing pond
                                metal analysis
                                       To calculateof Ovacık    Gold
                                                         the grey WF,Mine     for 9 contaminants:
                                                                         the pollutant                 arsenic,
                                                                                         load is obtained   fromcadmium,
                                                                                                                   a weekly chromium,
                                                                                                                               tailing pond
                                copper,
                                  metal iron,   lead,
                                         analysis     ofmercury,  nickel,
                                                          Ovacık Gold       selenium,
                                                                          Mine           and uranium (Table
                                                                                for 9 contaminants:             2) cadmium,
                                                                                                         arsenic,  [24,29]. In chromium,
                                                                                                                                  the table,
                                the value iron,
                                  copper,   indicated
                                                   lead, by  L (mass/time)
                                                           mercury,            is the pollutant
                                                                    nickel, selenium,             load, the
                                                                                           and uranium       value
                                                                                                          (Table  2) indicated
                                                                                                                      [24,29]. Inby theCtable,
                                                                                                                                        max
                                (mass/volume)       is the maximum     acceptable   concentration   of pollutant  in the
                                  the value indicated by L (mass/time) is the pollutant load, the value indicated by Cmaxreceiving    fresh-
                                water  body, and the
                                  (mass/volume)        is value indicated acceptable
                                                          the maximum       by Cnat (mass/volume)
                                                                                          concentrationis of
                                                                                                          thepollutant
                                                                                                              natural concentration
                                                                                                                          in the receivingin
                                a receiving water body.
                                     For all of the contaminants in this dataset, the weekly average was found by averaging
                                the 83 week-data after eliminating outliers. The maximum acceptable concentration value
                                was determined according to the Water Pollution Control Regulation (Table 7.1) and
                                the former IFC General Environmental Guidelines (published on 1998) [29]. A natural
                                concentration in the receiving water body is achieved with the Water Quality Classification
Sustainability 2021, 13, 8497                                                                                            6 of 16

                                (II) values, including the stream in which the water is discharged [29]. The next section
                                presents the methodology followed in this study.

                                Table 2. Values of contaminants causing grey WF [24,29].

                                     Contaminant              Cmax (mg/L)              Cnat (mg/L)            L (mg/L)
                                     Arsenic (As)                  0.1                      0.02                  0.1
                                    Cadmium (Cd)                  0.1                      0.002                 0.01
                                    Chromium (Cr)                 0.5                       0.02                 0.01
                                     Copper (Cu)                   0.5                      0.02                 0.44
                                       Iron (Fe)                   3.0                       0.3                0.047
                                      Lead (Pb)                   0.1                       0.01                 0.05
                                     Mercury (Hg)                 0.01                     0.0001              0.00121
                                      Nickel (Ni)                 0.5                       0.02                 0.05
                                      Zinc (Zn)                    2.0                       0.2               0.00687

                                2.2. Method
                                      In the WFA, the water footprint of a process, product, manufacturer, consumer, or a
                                certain geographical area in a certain time interval is calculated. This calculation is made
                                for the limits and purposes specified in the goal and scope definition [14]. In this study, the
                                WFA methodology was used to calculate the WF of the gold mine. Water footprint assess-
                                ment consists of four different stages: goal and scope setting, water footprint accounting,
                                water footprint sustainability assessment, and water footprint response formulation. The
                                research methodology followed in this study is presented in Figure 3. In the first stage,
                                the purpose of the WFA process and the goal and scope of the process in the mine are
                                determined. In the “Goal and Scope setting” stage, the reasons for doing the study are
                                presented in general terms, and information is given about the limitations of the study.
                                Reference is made to what is included in the calculations and what is excluded for the
                                boundaries of the study. These limits are shaped according to the purpose of the study [14].
                                      The main goal of this study is to estimate the direct and indirect WF of a mine where
                                gold is obtained using the CIP method in the processing plant, using the WFA methodology.
                                With this information, hotspots will be detected and the responses that can be taken to
                                reduce WF will be determined.
                                      The scope of this study is to calculate the blue and grey WF of the studied mine both
                                for the extraction and processing of the gold ore. In the study, direct and indirect WF
                                were examined. In the indirect WF, the WF of the electricity, fuel, and chemicals used to
                                produce the gold are included. In addition, the water used by the employees in the field to
                                meet their daily needs was also added. While the calculations were made, a twelve-month
                                period, from January to December, was selected for a representative case study, and the
                                amount of water used to produce 1 kg of gold was determined as the functional unit.
                                      Then, a comprehensive literature review was conducted for the data collection and
                                the information required for computations and process plant design in accordance with
                                the goal and scope definition. After the facility was designed, the blue and grey water
                                footprints were calculated separately, and hotspots through the process were identified.
                                These calculations have been applied to all the structures within the mine where the water
                                footprint can be calculated. Finally, by evaluating the water footprint suggestions were
                                made to reduce the water footprint and the environmental impact of the mine.
                                      There are three types of WF in WFA. Blue WF is an indicator that shows how much
                                water is consumed from underground and surface resources (blue WF resources). Green
                                WF shows how much water is consumed from rain water (green WF source). However,
                                the critical point to be considered here is that this resource should not be mixed (become
                                run-off) with surface or groundwater in any way. The grey WF is the amount of water
                                spent to bring the contaminated water to its natural concentration and to the existing
                                water quality standard [14]. In the next section, water footprint accounting is explained
                                comprehensively, including the relevant formulations to be utilized.
Sustainability 2021, 13, x FOR PEER REVIEW                                                                               7 of 17

Sustainability 2021, 13, 8497                                                                                                            7 of 16

                                        footprint can be calculated. Finally, by evaluating the water footprint suggestions were
                                        made to reduce the water footprint and the environmental impact of the mine.

                                                           Goal and Scope Definition

                                                                Data Collection

                                                     Drawing flow diagram of the process

                                                                WF Accounting

                                Blue WF Accounting                                        Grey WF Accounting

          Indirect WF Accounting               Direct WF Accounting

                                                              Identifying Hotspots

                                                             Response Formulation

                                                     Figure    Flowdiagram
                                                            3.Flow
                                                     Figure 3.      diagramof of
                                                                              thethe study.
                                                                                  study.

                                       2.3. Water
                                             ThereFootprint
                                                   are threeAccounting
                                                            types of WF in WFA. Blue WF is an indicator that shows how much
                                        water
                                            In isthis
                                                   consumed   fromblue
                                                      study, the   underground
                                                                       and greyand WFs surface
                                                                                         of theresources
                                                                                                 mine were (blue WF resources).
                                                                                                               calculated.      Green
                                                                                                                            Green  WF is not
                                        WF   shows    how much   water  is consumed   from rain  water  (green  WF source). However,
                                      included in the study because this type of WF is mostly used for agriculture and forestry
                                        the critical point to be considered here is that this resource should not be mixed (become
                                      activities, and, according to its definition, there is no information that can cause a green
                                        run-off) with surface or groundwater in any way. The grey WF is the amount of water
                                      WF in the field.
                                        spent to bring the contaminated water to its natural concentration and to the existing wa-
                                            Blue WF is an indicator of consumptive water use. Consumptive water use, on the
                                        ter quality standard [14]. In the next section, water footprint accounting is explained com-
                                      other  hand, represents
                                        prehensively,   including3the
                                                                   states,  and formulations
                                                                      relevant  the blue WF tois the sum of these 3 states. These states are,
                                                                                                 be utilized.
                                      as seen in Equation (1), evaporated water (Blue Water Evap.), water that is incorporated
                                      into
                                        2.3. the
                                             Waterproduct
                                                    Footprint(Blue Water Incorp.), which is known as the virtual-water content or
                                                              Accounting
                                      embedded      water,  and   water that
                                              In this study, the blue and    does
                                                                           grey   notofreturn
                                                                                WFs           to the
                                                                                        the mine     same
                                                                                                  were     catchment
                                                                                                       calculated.    area
                                                                                                                   Green WForisinnot
                                                                                                                                  the same
                                      period    (Lost  Return   Flow) [14]
                                        included in the study because this type of WF is mostly used for agriculture and forestry
                                        activities, and, according to its definition, there is no information that can cause a green
                                        WF in theWF   proc,blue = Blue Water Evap. + Blue Water Incorp. + Lost Return Flow
                                                    field.                                                                                  (1)
                                             Blue WF is an indicator of consumptive water use. Consumptive water use, on the
                                            Equation
                                        other            (2) was 3used
                                               hand, represents          to and
                                                                    states, calculate and
                                                                                the blue WFmeasure    theofevaporation
                                                                                             is the sum     these 3 states.from
                                                                                                                            Thesethe tanks and
                                                                                                                                  states
                                      tailing dam in the facility. This formula is taken from the Water Accounting Framework
                                      (WAF) methodology developed by The Minerals Council of Australia. In the equation,
                                      VEvap (ML) indicates evaporation losses, SEvap represents the average surface area covered
                                      by water (ha) during the calculation period, PanEvap is the value of the evaporation rates
                                      (mm) measured during the reporting period, and f is the correction factor to be converted.
Sustainability 2021, 13, 8497                                                                                            8 of 16

                                The correction factor for pan evaporation rates measured with a Class A pan is usually
                                around 0.75 [36].
                                                          VEvap = 0.01 × SEvap × PanEvap × f                       (2)
                                     Rainwater rains directly on open water surfaces in the facility, and measures are not
                                taken to increase the water holding capacity of the soil at the facility. Therefore, the amount
                                of rain falling on the tanks was considered as rain harvest. It is suggested that this type of
                                water use should be evaluated as a blue water footprint.
                                     Equation (3) was used to calculate the rainwater collected in the field [36]:
                                     In Equation (3), VRainfal (ML) is the volume of rainfall, R (mm) is the precipitation
                                measured during the calculation period, and SAR,M (ha) is the open surface area.

                                                                VRainfall = 0.01 × R × SAR,M                                (3)

                                    The entrained water, Vent (ML), is also considered blue water in the ore. To find the
                                amount of water for this, Equation (4) is used, where P is the incoming ore processed
                                during the reporting period (Mt) and m is the moisture content as a fraction [36].

                                                                    Vent = 1000 × P × m                                     (4)

                                       To include the entire supply chain in the study, many indirect water sources have been
                                considered. The amount of water required for employees to meet their daily needs is also
                                included in the blue water footprint. In addition, the amount of water used to suppress the
                                dust generated as a result of the process in the crusher unit in the facility is another source
                                included in the blue water footprint. In addition, the blue WF obtained for the chemicals,
                                the electricity and fuel, and the amounts of explosives used to extract gold from the mine
                                are included in the study.
                                       When calculating the annual indirect water footprint (WFInd ), the amount of resources
                                (Ri ) required to produce 1 kg of gold is found by multiplying the embodied water amount
                                estimates (Wi ) in these resources with the annual production amount (P), and the formula
                                for this is the following:
                                                                                 n
                                                                     WFInd =     ∑ Ri Wi P                                  (5)
                                                                               i =1

                                     After the chemical destruction cycle to reduce the concentration of cyanide and heavy
                                metals remaining in the waste to certain limits, wastes are sent to the tailing dam. Some of
                                the water accumulated in the tailing dam is reused in the process and some is discharged.
                                Therefore, the facility has a grey WF. Equation (6) is used to calculate the grey water
                                footprint in a process step [14]:

                                                                                      L
                                                                 WFproc,grey =                                              (6)
                                                                                 Cmax − Cnat

                                    In Equation (6), WFproc,grey (volume/time) shows total grey water footprint of a
                                product, where L (mass/time) is the pollutant load, Cmax (mass/volume) is the maxi-
                                mum acceptable concentration of the pollutant in the receiving freshwater body, and Cnat
                                (mass/volume) indicates natural concentration in a receiving water body [14].

                                3. Results
                                     The study was carried out to find the blue and grey WF of a gold mine in Turkey that
                                produces gold using the CIP method in its process facility. For all calculations, 1 kg of
                                gold is taken as a functional unit. This section of the paper comprehensively presents the
                                obtained results and research findings in three subsequent sections as direct and indirect
                                blue WF and grey WF values, the contribution of blue WF and grey WF to the total WF,
                                and the distribution of total blue WF to the process steps.
Sustainability 2021, 13, 8497                                                                                          9 of 16

                                3.1. Direct and Indirect Blue WF and Grey WF
                                     As a result of the study, both direct and indirect WF calculations were made for the
                                blue WF. The grey WF was calculated for nine contaminants. It should be noted that the
                                only place that causes a grey WF in the facility is the tailing pond. Detailed information on
                                each contributor of the mine’s direct and indirect blue WF and grey WF values is presented
                                in Table 3.

                                Table 3. Direct and indirect blue WF and grey WF values.

                                     WF Category             Sub-Category             Contributor       Value (m3 /kg Au)
                                                                                    Pit Dewatering            39.09
                                                                                   Lost Return Flow           260.61
                                                                                     Human Use                 3.28
                                                               Direct WF           Moisture Content            12.93
                                                                                   Dust Suppression            3.72
                                                                                        Rainfall               3.38
                                                                                     Evaporation               7.95
                                       Blue WF                                      Sodium Cyanide            25.49
                                                                                         Lime                  0.02
                                                                                          HCL                  0.81
                                                                                      Explosives              22.24
                                                              Indirect WF
                                                                                       Electricity            32.55
                                                                                        Oxygen                37.38
                                                                                        Carbon                 0.11
                                                                                         Diesel                2.73
                                     Total Blue WF                                                            452.40
                                       Grey WF                                        Tailing Pond           2300.69

                                      This table can be considered as a summary of the results obtained in the study. As
                                mentioned, while there are seven contributors that directly cause the blue WF of the mine,
                                there are eight contributors that cause an indirect blue WF. Among all the values, the lost
                                return flow value has the highest blue WF, while the blue WF value due to the use of lime
                                has the lowest value. On the indirect side, it is seen that the oxygen consumption used for
                                the leaching process has the highest value. When an evaluation is made by considering the
                                unit WF values in Table 1, it is seen that oxygen has the second lowest value. On the other
                                hand, it has the largest indirect WF value. The reason for this is that oxygen consumption
                                is used much more in the mine than other indirect contributors. It is also seen in the table
                                that the grey WF value originates only from the tailing pond.

                                3.2. The Contribution of Blue WF and Grey WF to the Total WF
                                     The results show that 84% of the total water footprint of the mine, which is the subject
                                of the study, is grey WF, while 16% is blue water footprint. When this result is compared
                                with the studies in the mining sector where grey and blue WF measurements were made at
                                the same time, it is seen that the same situation is reached. The contribution of blue WF
                                and grey WF to the total WF can be seen in the Figure 4.
                                     In these previous studies, the grey WF value has a higher percentage than the blue
                                WF value [17,20,22,37]. Another graph for the results obtained is presented in Figure 5.
                                This graph shows the amount of rain water held by open surfaces and the amount of water
                                evaporated from these surfaces on a monthly basis. In addition to these values, the monthly
                                blue WF value is also included in the chart.
3.2. The results
                                          Contribution   of84%
                                                  show that BlueofWF   and water
                                                                  the total Grey footprint
                                                                                 WF to the of Total WFwhich is the subject
                                                                                              the mine,
                                 of the study, is grey WF, while 16% is blue water footprint. When this result is compared
                                        The results show that 84% of the total water footprint of the mine, which is th
                                 with the studies in the mining sector where grey and blue WF measurements were made
                                 of  thesame
                                 at the  study,
                                             time,isitgrey   WF,
                                                       is seen thatwhile  16%
                                                                   the same    is blueis water
                                                                            situation    reached.footprint. Whenofthis
                                                                                                  The contribution  blueresult
                                                                                                                           WF is c
                                 with   theWF
                                 and grey   studies     in the
                                                to the total WFmining    sector
                                                                 can be seen     where
                                                                             in the Figuregrey
                                                                                           4. and blue WF measurements          we
Sustainability 2021, 13, 8497                                                                                        10 of 16
                                 at the same time, it is seen that the same situation is reached. The contribution of
                                 and grey WF to the total     WF
                                                           Blue WF canGrey
                                                                       beWFseen in the Figure 4.
                                                                                  90                                                      Grey WF, 84
                                                                                  80                                    Blue WF       Grey WF
                                                                                  70
                                                                                              90                                                     Grey WF, 84

                                                 Percentage Value
                                                                                  60
                                                                                  5080
                                                                                  4070

                                     Percentage Value                             3060
                                                                                  20                      Blue WF, 16
                                                                                              50
                                                                                  10
                                                                                              40
                                                                                              0
                                                                                              30            Blue WF                        Grey WF

                                                                                              20              Blue WF, 16
                                 Figure 4. Contribution of blue WF and grey WF to the total WF.
                                                                                              10
                                       In these
                                           0    previous studies, the grey WF value has a higher percentage than the blue
                                 WF value. [17,20,22,37]. Another graph for the results obtained is presented in Figure 5.
                                                               Blue WF                                Grey WF
                                 This graph shows the amount of rain water held by open surfaces and the amount of water
                                 evaporated from these surfaces on a monthly basis. In addition to these values, the
                                 Figure
                                Figure    4.blue
                                             Contribution
                                       4. Contribution
                                 monthly                     isofWF
                                                       of blue
                                                 WF value         blue
                                                                 alsoandWF
                                                                         greyand
                                                                      includedWF grey
                                                                               into     WF
                                                                                        total to
                                                                                    thechart.
                                                                                  the         WF.the total WF.

                                      In  these previous studies, the grey WF value has a higher
                                       6000                                                 38.60 percentage than
                                 WF value. [17,20,22,37]. Another graph for the results obtained
                                                                                            38.40
                                                                                                  is presented in
                                 This graph
                                       5000 shows the amount of rain water held by open surfaces and the amount

                                                                                                                                                                           Monthly Blue WF (m3/kg gold)
                                                                          and Rainfall (m )

                                                                                            38.20
                                     3

                                 evaporated from these surfaces on a monthly basis. In addition to these va
                                                                                            38.00
                                 monthly
                                       4000 blue WF value is also included in the chart.
                                                                                                                                                                   37.80
                                                                                      3000                                                                         37.60
                                                                                              6000                                                                                                        38.60
                                                              Evaporation

                                                                                                                                                                   37.40
                                                                                      2000                                                                                                                38.40
                                                                                                                                                                   37.20
                                                                                              5000

                                                                                                                                                                                                                  Monthly Blue WF (m3/kg gold)
                                                                 3)

                                                                                                                                                                                                          38.20
                                     Evaporation and Rainfall (m

                                                                                                                                                                   37.00
                                                                                      1000
                                                                                                                                                                   36.80                                  38.00
                                                                                              4000
                                                                                                  0                                                                36.60                                  37.80
                                                                                              3000                                                                                                        37.60
                                                                                                                                                                                                          37.40
                                                                                              2000Monthly Evaporation       Monthly Precipitation       Monthly Total WF
                                                                                                                                                                                                          37.20
                                 Figure5.5.The
                                Figure      Therelationship
                                                  relationshipbetween
                                                               betweenthe
                                                                        themonthly
                                                                            monthlyprecipitation
                                                                                    precipitationamount,
                                                                                                  amount,the
                                                                                                           theevaporation
                                                                                                               evaporation amount,
                                                                                                                          amount,  37.00
                                                                                                                                    and
                                                                                                                                  and
                                 blue WF1000[26].
                                blue WF [26].
                                                                                                                                                                                                          36.80
                                      As can be
                                              0 seen, the month with the highest blue WF of the mine is July, with approxi-36.60
                                mately 38.40 m3 /kg Au. This month is also the month with the highest evaporation and the
                                least precipitation. The month with the lowest blue WF value is February, with 37.23 m3 /kg
                                Au. Contrary to July, this month has the lowest evaporation amount. At the same time, the
                                linear relationship between the total WF and the evaporation rate is remarkable. When
                                all these comments are evaluated, it is obvious that the blue WF in this mine is caused by
                                                 Monthly
                                evaporation rather   than Evaporation         MonthlyThis
                                                          the amount of precipitation. Precipitation
                                                                                            is the main reasonMonthly
                                                                                                                why theTotal
                                                                                                                         blue WF
                                WF is the highest in July, because the evaporation rate is the highest in this month, as seen
                                 Figure 5. The relationship between the monthly precipitation amount, the evaporation am
                                 blue WF [26].
As can be seen, the month with the highest blue WF of the mine is July, with approx-
                                 imately 38.40 m3/kg Au. This month is also the month with the highest evaporation and
                                 the least precipitation. The month with the lowest blue WF value is February, with 37.23
                                 m3/kg Au. Contrary to July, this month has the lowest evaporation amount. At the same
                                 time, the linear relationship between the total WF and the evaporation rate is remarkable.
Sustainability 2021, 13, 8497                                                                                                       11 of 16
                                 When all these comments are evaluated, it is obvious that the blue WF in this mine is
                                 caused by evaporation rather than the amount of precipitation. This is the main reason
                                 why the blue WF is the highest in July, because the evaporation rate is the highest in this
                                 month,
                                in Figureas2.seen  in Figure
                                              Therefore,       2. Therefore,
                                                            more               more
                                                                   water is lost      waterevaporation
                                                                                  through    is lost through thisevaporation
                                                                                                                  month and morethis month
                                                                                                                                      blue
                                 and more
                                water        blue water
                                       is needed           is needed
                                                   to replenish         to replenish
                                                                   the lost  water. the lost water.
                                      Anotherresult
                                     Another     resultobtained
                                                         obtainedfromfromthethegraph
                                                                                graph(Figure
                                                                                        (Figure2)2)isisthat
                                                                                                        thatwhile
                                                                                                              whilethere
                                                                                                                     thereisisaanoticeable
                                                                                                                                 noticeable
                                 differencebetween
                                difference   betweenmonthly
                                                         monthly    evaporation
                                                                  evaporation      and
                                                                                 and     precipitation
                                                                                      precipitation       changes,
                                                                                                      changes,   the the
                                                                                                                     blueblue    WF values
                                                                                                                           WF values    are
                                 are close
                                close       to each
                                      to each   otherother
                                                       in theindifferent
                                                                the different    months.
                                                                           months.         This implies
                                                                                     This implies   that thethat  the contributors,
                                                                                                               contributors,          other
                                                                                                                                other than
                                 than evaporation
                                evaporation           and precipitation,
                                               and precipitation,            increase
                                                                      increase         theblue
                                                                                the total  totalWF
                                                                                                 blue   WF more.
                                                                                                      value   value more.

                                3.3.
                                 3.3.Distribution
                                     DistributionofofTotal
                                                         TotalBlue
                                                                BlueWF
                                                                     WFininthetheProcess
                                                                                   ProcessSteps
                                                                                             Steps
                                     ItItcan
                                          can be seen in the chart shared in Figure66that
                                              be seen   in  the chart  shared    in Figure      thatevaporation
                                                                                                       evaporationandandprecipitation
                                                                                                                          precipitationvalues
                                                                                                                                         values
                                among
                                 among direct and indirect WF values contribute less to the total bluecompared
                                         direct  and  indirect   WF   values   contribute     less  to the total blue  WF             to otherto
                                                                                                                             WF compared
                                contributors.     In terms
                                 other contributors.          of percentage,
                                                           In terms               it is seen
                                                                      of percentage,      it isthat
                                                                                                seenthe  contribution
                                                                                                       that              of evaporation
                                                                                                            the contribution               and
                                                                                                                                of evaporation
                                precipitation   to  the  total blue  WF   is 1.76%    and   0.75%,   respectively.  The  highest
                                 and precipitation to the total blue WF is 1.76% and 0.75%, respectively. The highest value       value on  the
                                direct
                                 on theWF    sideWF
                                          direct   belongs    to lost return
                                                       side belongs     to lostflow,
                                                                                 returnwhile
                                                                                          flow,onwhile
                                                                                                   the indirect
                                                                                                          on theWF    side this
                                                                                                                  indirect WF value   belongs
                                                                                                                                side this value
                                to the  blue  WF   due    to oxygen    consumption.
                                 belongs to the blue WF due to oxygen consumption.

                                                                    Diesel       2.73
                                                                   Carbon        0.11
                                                                  Oxygen                   37.38
                                             Indirect

                                                                Electricity               32.55
                                                                Explosives              22.24
                                                                      HCL        0.81
                                                                     Lime        0.02
                                   Blue WF

                                                         Sodium Cyanide                   25.49
                                                             Evaporation              7.95
                                                                   Rainfall          3.38
                                                        Dust Suppression             3.72
                                             Direct

                                                        Moisture Content               12.93
                                                               Human Use             3.38
                                                        Lost Return Flow                                                                260.61
                                                           Pit Dewatering                   39.09
                                                                              0.00        50.00     100.00   150.00   200.00   250.00     300.00
                                                                                                    Total Blue WF (m3/kg Au)

                                 Figure 6. Distribution of the total blue WF between the process steps.
                                Figure 6. Distribution of the total blue WF between the process steps.

                                      InInFigure
                                           Figure7,7,the
                                                       the  blue
                                                         blue  WF WF   values
                                                                    values      between
                                                                            between       operations
                                                                                     operations       are shared.
                                                                                                 are shared.  BothBoth  the extraction
                                                                                                                   the extraction and
                                 and   the  process    facility have   been   evaluated   according  to the  operations
                                the process facility have been evaluated according to the operations within them.        withinWhile
                                                                                                                                 them.
                                 While
                                only   theonly the works
                                            works            in thepit
                                                   in the open       open  pit and
                                                                        mine   minecontributing
                                                                                     and contributing
                                                                                                  to thetoblue
                                                                                                           the WF
                                                                                                               blueare
                                                                                                                    WFevaluated
                                                                                                                        are evaluated
                                                                                                                                   for
                                 for extraction,
                                extraction,   the the   process
                                                  process        facility
                                                              facility    is divided
                                                                       is divided     into
                                                                                   into    crushing,
                                                                                         crushing,   grinding,dewatering,
                                                                                                   grinding,    dewatering,leaching,
                                                                                                                             leaching,
                                 adsorption,and
                                adsorption,     andtailing
                                                      tailingdam.
                                                               dam.
                                      As a result of the calculations, it was determined that the largest blue WF belonged to
                                the 272 m3 /kg Au tailing dam. The second refers to extraction operations, with 86 m3 /kg
                                Au, and the third greatest contribution is from leaching, with 68 m3 /kg Au. It is not
                                surprising that the results are like this because the lost return flow value, which belongs
                                to the highest value in Figure 5, is actually a blue WF value belonging to the tailing dam.
                                Likewise, the contributors with the greatest value in Figure 5 are the blue WF values of the
                                extraction and leaching operations.
                                      When an evaluation was made on the indirect WF side, it was seen that most of the
                                water was caused by the oxygen consumed in the leaching and adsorption unit and the
                                electricity consumption used for production. In the second place, it was determined that
                                the blue WF depends on the amount of cyanide consumed.
Leaching                           68

                                        Operation
                                                                 Dewatering        5
Sustainability 2021, 13, 8497                                                                                                                            12 of 16
  Sustainability 2021, 13, x FOR PEER REVIEW                       Grinding        6                                                                      12 of 17

                                                                   Crushing        9

                                                                      Mining                              86
                                                                 Tailing Dam                                                                     272
                                                                               0            50            100         150       200        250     300
                                                                 Adsorption        6                           Blue WF (m3/kg Au)
                                              Leaching                     68

                                          Operation
                                    Figure 7. Distribution of the total blue WF between operations.
                                           Dewatering      5
                                         As a result of the calculations, it was determined that the largest blue WF belonged
                                    to the 272Grinding       6
                                                m3/kg Au tailing       dam. The second refers to extraction operations, with 86 m3/kg
                                    Au, and the third greatest contribution is from leaching, with 68 m3/kg Au. It is not sur-
                                               Crushing       9
                                    prising that the results      are like this because the lost return flow value, which belongs to
                                    the highestMining
                                                   value in Figure 5, is actually a blue WF value belonging to the tailing dam.
                                                                                  86
                                    Likewise, the contributors with the greatest value in Figure 5 are the blue WF values of
                                    the extraction and0leaching50       operations.
                                                                                  100        150        200        250       300
                                         When an evaluation was made onBlue           the WF
                                                                                          indirect WF
                                                                                              (m3/kg Au)side, it was seen that most of the
                                    water was caused by the oxygen consumed in the leaching and adsorption unit and the
                                    electricity consumption used for production. In the second place, it was determined that
                                    Figure
                                    the
                                   Figure 7.7.Distribution
                                        blue   Distribution
                                               WF   dependsofofthe
                                                                 thetotal
                                                                on    total
                                                                     the    blueWF
                                                                          amount
                                                                          blue   WFofbetween
                                                                                      cyanide
                                                                                   between   operations.
                                                                                               consumed.
                                                                                            operations.

                                   3.4.    As a resultofofof
                                     3.4.Distribution
                                          Distribution        the calculations,
                                                           Chemicals
                                                            Chemicals  ininGrey
                                                                             GreyWFit was determined that the largest blue WF belonged
                                                                                  WF
                                     to the  272
                                         InInthe m  3/kg Au tailing dam. The second refers to extraction operations, with 86 m3/kg
                                              thestudy,
                                                   study,only
                                                            onlythe
                                                                  thetailing
                                                                       tailingpond
                                                                                 pondcauses
                                                                                        causesthethegrey
                                                                                                      greywater
                                                                                                            waterfootprint. AAdetox
                                                                                                                   footprint.   detoxprocess
                                                                                                                                        process
                                     Au,
                                   isis   and the
                                       carried  out, third
                                                       the   greatest contribution
                                                            processed      water  is    is from
                                                                                      sent  to    leaching,
                                                                                                the  tailing  with 68
                                                                                                              dam,    m3the
                                                                                                                    and  /kg excess
                                                                                                                              Au. It is not sur-
                                                                                                                                      water  is
                                        carried out, the processed water is sent to the tailing dam, and the excess water                is dis-
                                     prising that
                                   discharged    to  the
                                                     the results
                                                          receivingarewater
                                                                        like this  because
                                                                               body.  Figure  the
                                                                                               8   lost return
                                                                                                 shows    the   flow value,ofwhich
                                                                                                              contribution    nine   belongs to
                                                                                                                                   chemicals
                                     charged to the receiving water body. Figure 8 shows the contribution of nine chemicals
                                     the highest value
                                   causing                  in Figure     5, is actually a blue WF value belonging to the tailing dam.
                                     causingaagrey
                                                 greyWF WFininthe
                                                                themine.
                                                                    mine.
                                     Likewise, the contributors with the greatest value in Figure 5 are the blue WF values of
                                     the extraction and leaching operations.
                                             1800 an1777
                                           When         evaluation was made on the indirect WF side, it was seen that most of the
                                     water was caused by the oxygen consumed in the leaching and adsorption unit and the
                                             1500
                                     electricity  consumption used for production. In the second place, it was determined that
                                        Grey WF (m3/kg gold)

                                     the blue WF depends on the amount of cyanide consumed.
                                                                 1200

                                    3.4. Distribution of Chemicals in Grey WF
                                                                 900
                                         In the study, only the tailing pond causes the grey water footprint. A detox process
                                    is carried
                                            600out, the processed water is sent to the tailing dam, and the excess water is dis-
                                    charged to the receiving water body. Figure 8 shows the contribution of nine chemicals
                                                                          261
                                    causing300
                                             a grey WF in the mine.                       158
                                                                                       29        6                   5                35   30     1
                                                                    0
                                                                 1800    1777

                                                                 1500
                                          Grey WF (m3/kg gold)

                                                                 1200

                                             900 water footprint in the tailing dam based on 9 contaminants.
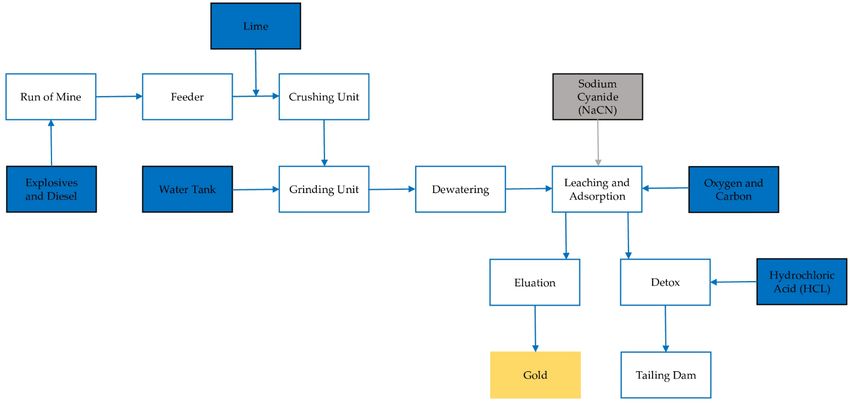
                                   Figure 8. Grey

                                        Among
                                            600 the nine contaminants in the mine tailings, the critical component responsible
                                   for the grey water footprint is by far arsenic. Arsenic constitutes 77.23% of the total grey
                                                                           261
                                             a value of 1777 m3 /kg Au. By definition, the
                                   WF, with300                                                largest pollutant is that associated
                                                                                            158
                                                           29
                                   with the specific grey water footprint.
                                                                     6     Here, it will
                                                                                    5 be sufficient 35 to focus
                                                                                                             30 on the
                                                                                                                     1 grey water
                                              0
                                   footprint due to arsenic in order to make a general comment on water pollution and to
                                   find an indicator. However, it is of course crucial to formulate a response that targets other
                                   contaminants as well.
Sustainability 2021, 13, 8497                                                                                           13 of 16

                                4. Discussions
                                     The WF value may vary depending on the type of mining methods together with
                                geological and geographical factors. Therefore, with this study, both a region and a process
                                method have been brought to the literature. Considering the results, it is seen that the
                                study has achieved its purpose. The blue and grey WF values of a facility that produces
                                gold using the CIP method in Turkey were calculated, and the contributors and regions
                                with the highest water footprint for sustainable water management were determined. In
                                addition, with this study, a detailed examination of the CIP method was made, and the
                                most water-consuming parts of this method were determined. This study is a first in terms
                                of examining the CIP method in such a detailed way.

                                4.1. Comparison with the Previous Studies
                                     The values obtained as a result of this study were compared with 2 previous studies on
                                water consumption in gold mining.In the first study, Mudd (2007) examined the resources
                                used in gold mining from 1992 to 2006 based on sustainability reports in his study [38].
                                In another study, Mudd et al. (2017), there are water use data from 75 different mines for
                                different years [39]. Among these mines, there are 19 mines that produce only gold, and
                                only the values of these 19 mines are taken as a reference for comparison. The maximum,
                                average, and minimum values of the two studies are shown in Table 4.

                                Table 4. Water Consumption Values of the Studied.

                                        Study                Unit             Maximum            Average         Minimum
                                                          m3 /kg  Au            1783               691              224
                                     Mudd (2007)
                                                           m3 /t ore            2.87               1.42             0.74
                                  Mudd et al. (2017)       m3 /t ore            5.24               2.09             0.04

                                      When the results obtained in this study are compared with those of the two studies, it
                                is seen that there is a consistency with the other two studies. The 452.40 m3 /kg Au value
                                obtained in this study is between the maximum and minimum values and is below the
                                average value of the study by Mudd (2007). In addition, the amount of water consumed
                                per ton in this study is 1.73 m3 /t ore. This value is still within the range, and the value is
                                higher than the average value. The reason for this difference is the difference in ore grade,
                                processing techniques, precipitation, and evaporation. When the study by Mudd et al.
                                (2017) is considered, the value of 1.73 m3 /t ore is again in the range of the maximum and
                                minimum values and is smaller than the average value.

                                4.2. Response Formulation to Reduce Blue WF
                                      Considering the results obtained from the study, it was seen that evaporation and blue
                                WF values moved proportionally. It was also found that the blue WF values were more
                                dependent on other contributors than on evaporation and rainfall compared to the values
                                obtained. As a result, it was seen that the amount of lost return flow with 260.61 m3 /kg
                                Au among values contributed much more than other contributors. In fact, this value has
                                the largest value among both direct and indirect WF values. The fact that this value is
                                so large has caused the tailing dam to have the highest blue WF value, 272 m3 /kg Au,
                                among the operations and parts of the facility. For this reason, it is necessary to work to
                                reduce the lost return flow on the direct blue WF side. As a starting point for sustainable
                                water management, recycling more water from the tailing dam to be used in operations
                                can reduce the lost return flow. Since the lost return flow value is discharge water from the
                                tailing fam to the receiving environment, the discharge value will be reduced with more
                                recycling. In this way, less water will be drawn from the wells to obtain the required water
                                for the process plant. At the same time, a final filtration process before sending the wastes
                                to the tailing dam will also reduce the lost return flow value. Regionally, solutions should
                                be taken to prevent evaporation, especially in the summer months, when the tailing dam is
Sustainability 2021, 13, 8497                                                                                                  14 of 16

                                the largest surface area [40]. On the indirect WF side, oxygen consumption (37.38 m3 /kg
                                Au) and electricity consumption (32.55 m3 /kg Au) are the sources that contribute the most.
                                In addition, when the blue WF value obtained for cyanide consumption (25.49 m3 /kg Au)
                                is evaluated, the leaching operation stands out. To reverse this situation, remedial solutions
                                should be found for the amount of electricity and oxygen consumed in the mine. When
                                both the direct and indirect blue water footprint values are evaluated together, it is seen that
                                the blue WF value for the extraction operation is also high. Here, it was determined that
                                the pit dewatering with 39.09 m3 /kg Au made the greatest contribution to the extraction
                                operation. For example, using pit dewatering for dust suppression in the mine or in the
                                process facility will reduce the blue WF value.

                                4.3. Response Formulation to Reduce Grey WF
                                     Only the tailing dam is responsible for the grey WF. Among the nine contaminants
                                that cause the grey WF, the biggest contributor belongs to arsenic, with 1777 m3 /kg Au.
                                Arsenic is a highly toxic and accumulative element. World Health declares arsenic as one
                                of the main pollutants in aqueous waste streams. Therefore, it is important to reduce the
                                arsenic concentration before it is introduced into a natural system with wastewater. Since
                                the arsenic content causes the greyest WF, the arsenic concentration in the water must be
                                further reduced using new methods before the wastewater is released into the environment.
                                These measures can be taken with the use of new technologies for arsenic removal. In the
                                study by Langsch et al. (2012), 14 arsenic removal methods are given with their advantages
                                and disadvantages. The arsenic concentration can be reduced by evaluating these methods
                                and applying the appropriate one to the mine waste [4,41].

                                5. Conclusions and Recommendations
                                      In this study, the WF of a gold-producing mine using the CIP method was calculated,
                                hotspots were determined, and the research objectives have been successfully achieved. At
                                the end of the study, blue a WF of 452.40 m3 /kg Au and a grey WF of 2300.69 m3 /kg Au
                                belonging to the mine were found. For the blue WF in the mine, the lost return flow on the
                                direct WF side and the oxygen and electricity consumption on the indirect blue WF side
                                have the highest values. Among the process steps, the tailing dam was identified as by far
                                the largest source of blue WF. However, on the indirect WF side, it has emerged that, first
                                of all, measures to reduce the blue WF should be taken for the leaching operation. When
                                the two blue WFs were examined jointly, it was revealed that measures to reduce the blue
                                WF should be taken for pit dewatering after lost return flow. The tailing dam is the only
                                source of grey WF. Among the nine pollutants that are sources of grey WF, arsenic is the
                                largest pollutant. Here, it is revealed that necessary studies should be done to reduce the
                                concentration of arsenic in the waste dam. In order for the mine to reduce WF values and
                                produce in a more environmentally sustainable way, a water management system should
                                be established, and these hot spots should take the necessary measures.
                                      This study can be made more efficient by collecting more detailed data from a mining
                                site operating with the CIP method and taking the necessary measurements. At the
                                same time, with a study in which Life Cycle Assessment Methodology is integrated, the
                                environmental impact of the mine in relation to the water consumed can be clearly seen by
                                selecting certain categories. In this way, the measures to be taken can be built on a more
                                solid foundation with the understanding of sustainable production, which is an emerging
                                issue for today’s mining industry under the upcoming water crisis.

                                Author Contributions: Conceptualization, E.G. and N.D.; methodology, E.G.; formal analysis, N.D.;
                                investigation, E.G.; resources, E.G.; data curation, E.G.; writing—original draft preparation, E.G. and
                                N.D..; writing—review and editing, E.G. and N.D.; visualization, N.D.; supervision, N.D. All authors
                                have read and agreed to the published version of the manuscript.
                                Funding: This research received no external funding.
                                Institutional Review Board Statement: Not Applicable.
Sustainability 2021, 13, 8497                                                                                                          15 of 16

                                    Informed Consent Statement: Not Applicable.
                                    Data Availability Statement: The data presented in this study are available on request from the
                                    corresponding author.
                                    Conflicts of Interest: The authors declare no conflict of interest.

References
1.    Lall, U.; Heikkila, T.; Brown, C.; Siegfried, T. Water in the 21st Century: Defining the Elements of Global Crises and Potential
      Solutions. J. Int. Aff. 2008, 6, 1–17. Available online: https://www.jstor.org/stable/24358108 (accessed on 23 June 2021).
2.    World Economic Forum. Global Risks Report 2019; World Economic Forum: Geneva, Switzerland, 2019.
3.    Martín, A.; Arias, J.; López, J.; Santos, L.; Venegas, C.; Duarte, M.; Ortíz-Ardila, A.; de Parra, N.; Campos, C.; Zambrano, C.C.
      Evaluation of the effect of gold mining on the water quality in Monterrey, Bolívar (Colombia). Water 2020, 12, 2523. [CrossRef]
4.    Fashola, M.O.; Ngole-Jeme, V.M.; Babalola, O.O. Heavy metal pollution from gold mines: Environmental effects and bacterial
      strategies for resistance. Int. J. Environ. Res. Public Health 2016, 13, 1047. [CrossRef] [PubMed]
5.    Hamilton, R. From water management to water stewardship-a policy maker’s opinion on the progress of the mining sector. Water
      2019, 11, 438. [CrossRef]
6.    Aktaş, O. Impacts of climate change on water resources in Turkey. Environ. Eng. Manag. J. 2014, 13, 881–889. [CrossRef]
7.    The World Bank. Valuing Water Resources in Turkey. A Methodological Overview and Case Study; The World Bank: Washington, DC, USA,
      2016.
8.    Mining Operations Water, Wastewater and Waste Statistics (Maden İşletmeler Su, Atıksu ve Atık İstatistikler). 2010. Available online:
      https://data.tuik.gov.tr/Bulten/Index?p=Maden-Isletmeleri-Su,-Atiksu-ve-Atik-Istatistikleri-2010-10799 (accessed on 17 July 2021).
9.    Mining Operations Water, Wastewater and Waste Statistics (Maden İşletmeler Su, Atıksu ve Atık İstatistikler). 2012. Available online:
      https://data.tuik.gov.tr/Bulten/Index?p=Maden-Isletmeleri-Su,-Atiksu-ve-Atik-Istatistikleri-2012-16173 (accessed on 17 July 2021).
10.   Mining Operations Water, Wastewater and Waste Statistics (Maden İşletmeler Su, Atıksu ve Atık İstatistikler). 2014. Available online:
      https://data.tuik.gov.tr/Bulten/Index?p=Maden-Isletmeleri-Su,-Atiksu-ve-Atik-Istatistikleri-2014-21625 (accessed on 17 July 2021).
11.   Mining Operations Water, Wastewater and Waste Statistics (Maden İşletmeler Su, Atıksu ve Atık İstatistikler). 2016. Available online:
      https://data.tuik.gov.tr/Bulten/Index?p=Maden-Isletmeleri-Su,-Atiksu-ve-Atik-Istatistikleri-2016-24879 (accessed on 17 July 2021).
12.   Mining Operations Water, Wastewater and Waste Statistics (Maden İşletmeler Su, Atıksu ve Atık İstatistikler). 2018. Available online:
      https://data.tuik.gov.tr/Bulten/Index?p=Maden-Isletmeleri-Su,-Atiksu-ve-Atik-Istatistikleri-2018-30670 (accessed on 17 July 2021).
13.   Chan, B.K.C.; Xiong, M.Y.; Chen, C.; Zhang, G.P.; Franke, N. A preliminary water footprint assessment of copper production in
      China. Water Sci. Technol. Water Supply 2014, 14, 1018–1025. [CrossRef]
14.   Aldaya, M.M.; Chapagain, A.K.; Hoekstra, A.Y.; Mekonnen, M.M. The Water Footprint Assessment Manual; Earthscan, 2012; Available
      online: https://waterfootprint.org/media/downloads/TheWaterFootprintAssessmentManual_2.pdf (accessed on 7 April 2021).
15.   Zhang, G.P.; Hoekstra, A.Y.; Mathews, R.E. Water Footprint Assessment (WFA) for better water governance and sustainable
      development. Water Resour. Ind. 2013, 1–2, 1–6. [CrossRef]
16.   Peña, C.A.; Huijbregts, M.A.J. The blue water footprint of primary copper production in Northern Chile. J. Ind. Ecol. 2014, 18,
      49–58. [CrossRef]
17.   Haggard, E.L.; Sheridan, C.M.; Harding, K.G. Quantification of water usage at a South African platinum processing plant.
      Water SA 2015, 41, 279–286. [CrossRef]
18.   Ranchod, N.; Sheridan, C.M.; Pint, N.; Slatter, K.; Harding, K.G. Assessing the blue-water footprint of an opencast platinum mine
      in South Africa. Water SA 2015, 41, 287–293. [CrossRef]
19.   Pardavé, W.; Delvasto, P. Estimation of the Water Footprint in a Small-Scale Gold Ore Beneficiation Plant Located in the
      Municipality or Vetas, Santander, Colombia. XVI Word Water Congress. 2017. Available online: https://iwra.org/member/
      congress/resource/ABSID100_ABSID100_Pardave_Gold_Mine_Vetas_Water_Footprint_1.pdf (accessed on 7 April 2021).
20.   Osman, A.; Crundwell, F.; Harding, K.G.; Sheridan, C.M. Application of the water foot printing method and water accounting
      framework to a base metal refining process. Water SA 2017, 43, 722–729. [CrossRef]
21.   Islam, K.; Murakami, S. Accounting for Water Footprint of an Open-Pit Copper Mine. Sustainability 2020, 12, 9660. [CrossRef]
22.   Gu, Y.; Xu, J.; Keller, A.A.; Yuan, D.; Li, Y.; Zhang, B.; Weng, Q.; Zhang, X.; Deng, P.; Wang, H.; et al. Calculation of water footprint
      of the iron and steel industry: A case study in Eastern China. J. Clean. Prod. 2015, 92, 274–281. [CrossRef]
23.   Guven Onal. BAT Practice at Ovacık Gold Mine. 2013. Available online: https://docplayer.net/24286042-Bat-practice-at-ovacik-
      gold-mine-g-onal.html (accessed on 7 April 2021).
24.   Koksal, E.; Ormanoglu, G.; Devuyst, E.A. Cyanide destruction: Full-scale operation at Ovacık gold mine. Eur. J. Miner. Process.
      Environ. Prot. 2003, 3, 270–280.
25.   Yuce, A.; Koksal, E.; Onal, G. Gold Mining and Tailings Dam in Ovacık, Turkey. VI SHMMT I XVIII ENTMME. 2001, pp. 527–530.
      Available online: http://artigos.entmme.org/download/2001/environmental_issues/1006%20-%20A.%20Ekrem%20Y%C3
      %BCce_Erkan%20Koksal_G%C3%BCven%20Onal%20-%20GOLD%20MINING%20AND%20TAILINGS%20DAM%20lN%20
      OVACIK,%20TURKEY.pdf (accessed on 7 April 2021).
You can also read