Water Quality Monitoring Results for Port Arthur Area by EPA Tasmania October 2020 to March 2021 - July 2021
←
→
Page content transcription
If your browser does not render page correctly, please read the page content below
Water Quality Monitoring
         Results for Port Arthur
         Area by EPA Tasmania
         October 2020 to March
         2021

    July 2021

Department of Primary Industries,
P a r k s , Wa t e r a n d E n v i r o n m e n t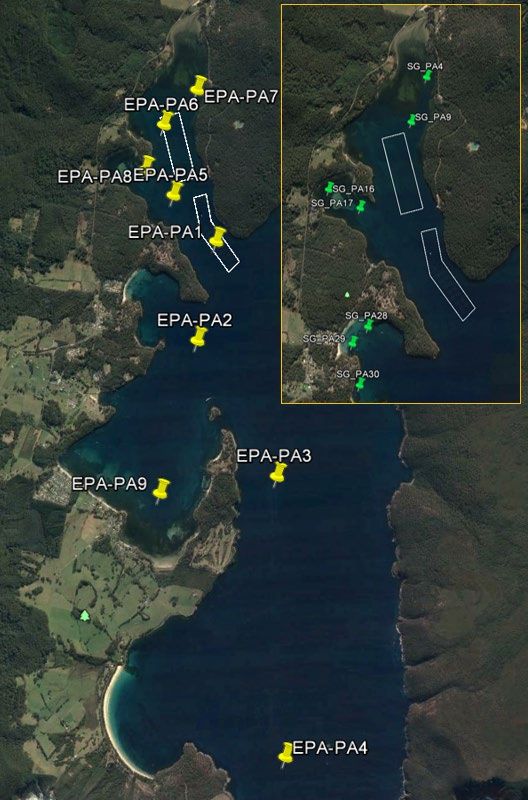
Publishing Information
Citation:
EPA Tasmania (2021) Water Quality monitoring results for Port Arthur area by EPA (Tasmania) October 2020 to March
2021, EPA Tasmania, Hobart, Tasmania.
Date:
July 2021
Enquiries:
EPA Tasmania
Department of Primary Industries, Parks, Water and Environment
GPO Box 1550
Hobart, Tasmania 7001
Telephone: (03) 6165 4599
Email: Enquiries@epa.tas.gov.au
Web: www.epa.tas.gov.au
Copyright:
© The Crown in the Right of Tasmania
Disclaimer:
The information provided in this document is provided in good faith. The Crown, its officers, employees and agents
do not accept liability however arising, including liability for negligence, for any loss resulting from the use of or
reliance upon the information in this document and/or reliance on its availability at any time.

Table of Contents
Water Quality Monitoring Program.................................................................................................................. 4
   Introduction......................................................................................................................................................................... 4
   Aims....................................................................................................................................................................................... 4
   Description .......................................................................................................................................................................... 4
      Default Guideline Values (DGVs).............................................................................................................................. 4
      Monitoring sites ............................................................................................................................................................. 4
      Key Parameters/Indicators of Interest ..................................................................................................................... 7
   Results................................................................................................................................................................................... 9
      Water Quality ................................................................................................................................................................ 9
        Temperature ............................................................................................................................................................. 9
        Dissolved Oxygen .................................................................................................................................................. 10
        Salinity ....................................................................................................................................................................... 12
        pH .............................................................................................................................................................................. 13
        TAN (Total Ammoniacal Nitrogen) .................................................................................................................. 14
        NOx (Nitrate and Nitrite)................................................................................................................................... 16
        Nitrogen (total) ...................................................................................................................................................... 17
        Phosphorus (total) ................................................................................................................................................. 18
        DRP (Dissolved Reactive Phosphorus) ............................................................................................................. 19
        Chlorophyll a........................................................................................................................................................... 20
      Epiphytic Algal growth ............................................................................................................................................... 20
   Discussion .......................................................................................................................................................................... 22
      Water Quality .............................................................................................................................................................. 22
        Temperature ........................................................................................................................................................... 22
        Dissolved Oxygen .................................................................................................................................................. 22
        Salinity ....................................................................................................................................................................... 23
        pH .............................................................................................................................................................................. 23
        TAN (Total Ammoniacal Nitrogen) .................................................................................................................. 23
        NOx (Nitrate and Nitrite)................................................................................................................................... 24
        Nitrogen (total) ...................................................................................................................................................... 24
        Phosphorus (total) ................................................................................................................................................. 25
        DRP (Dissolved Reactive Phosphorus) ............................................................................................................. 25
      Epiphytic Algal growth ............................................................................................................................................... 26
   Conclusion ......................................................................................................................................................................... 26
   Appendix 1......................................................................................................................................................................... 27
      Surface Water Nitrogen Compounds.................................................................................................................... 27
      Bottom Water Nitrogen Compounds ................................................................................................................... 29

EPA Tasmania, July 2021                                                                                                                                                                      3
Water Quality Monitoring Program
Introduction
The Water Section of EPA Tasmania conducted water quality monitoring in the Port Arthur area from
October 2020 to March 2021 to increase the understanding of water quality across the area and in
particular within Long Bay.

Aims
• To provide water quality information to increase the understanding of water quality in the Port Arthur
  area and in particular Long Bay;
• To collect data on key indicators for comparison against Default Guideline Values (DGVs) for aquatic
  ecosystems developed for the Port Arthur area;
• To investigate if any departures from background conditions (DGVs) are attributable to anthropogenic
  or natural sources and if possible show attribution.
• To provide a summer snapshot for the extent of epiphytic growth on seagrass habitat.

Description
The Port Arthur area is a large embayment on the Tasman Peninsula which opens directly to the Tasman
Sea at its southern extent.
Default Guideline Values (DGVs)
Default Guideline Values (DGVs) for aquatic ecosystems have been developed for the Port Arthur area.
The DGVs have been derived from site specific information in accordance with the National Water Quality
Management Strategy (NWQMS). The DGVs are based on data collected from August 2013 to July 2017
from four locations (PA1, PA2, PA3 and PA4). The available data has allowed for the derivation of annual
and seasonal DGVs of surface, 5 metre depth, integrated depth and bottom waters for key indicators. For
dissolved oxygen, temperature and pH the 20th percentile represents the lower DGV and the 80th
percentile the upper DGV, whilst for all other indicators the 80th percentile of the aforementioned data
represents the DGV. When a value reported by the laboratory is below the Limit of Reporting (LoR), the
reported value has been halved prior to inclusion in the dataset for DGV derivation. Information on all
indicators (particularly nutrients) is not available at all depths due to being beyond the scope of the initial
program requirements. The Port Arthur area DGVs provide a level of refinement over the interim Default
guideline values for Coastal and Marine waters based on the IMCRA bioregion.
Monitoring sites
Water quality data have been collected from nine (9) sites across the Port Arthur area, which include four
(4) sites monitored on a monthly basis as part of the environmental licence conditions for lease MF55
(Long Bay Port Arthur). The proximity of site PA1 to the Long Bay lease should be taken into account
when interpreting monitoring results. Due to the site being adjacent to the lease and within 60 metres of
stocked cages the location is unlikely to represent ambient conditions. The site is however valuable in the
interpretation of ‘near field’ effects.
Epiphytic growth data have been collected from seven (7) sites across the Port Arthur area. The data
represents a snapshot for February 2021 at these locations.
An overview of the monitoring locations is provided in Table 1 and distribution across the Port Arthur area
in Map 1.

EPA Tasmania, July 2021                                                                                       4
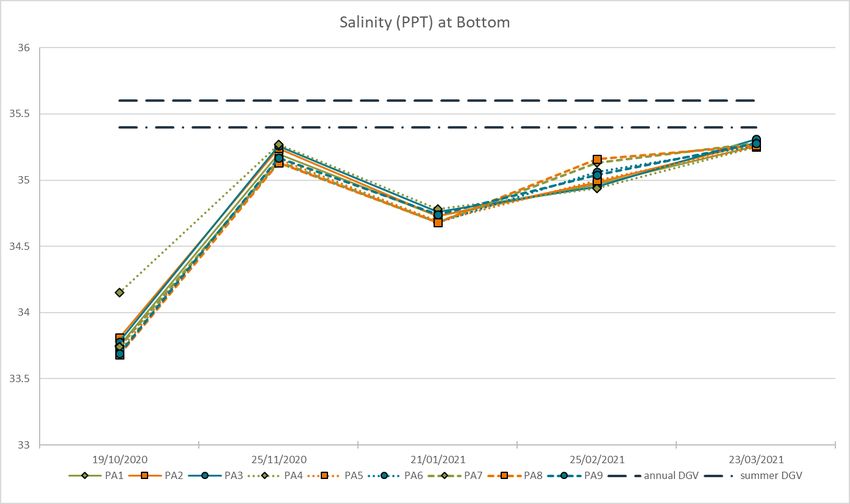
Table 1: Port Arthur monitoring locations

 Site ID                   Location              Easting   Northing                Monitoring                       Distance from Lease                Comment
                                                                                                                         boundary

EPA-PA1    North of Garden Point                570485     5224084    Nutrient, phytoplankton, physico-chem.       ~ 20 m (near scale)       Co-located with BEMP-PA1

EPA-PA2    East of Fryingpan Point              570287     5222948    Nutrient, phytoplankton, physico-chem.       ~ 1.0 km (intermediate)   Co-located with BEMP-PA2

EPA-PA3    South East of Suicide Point          571217     5221408    Nutrient, phytoplankton, physico-chem.       ~ 2.5 km (intermediate)   Co-located with BEMP-PA3

EPA-PA4    East of Dog Bark                     571352     5218242    Nutrient, phytoplankton, physico-chem.       ~ 5.6 km (Far field)      Co-located with BEMP-PA4

EPA-PA5    Long Bay 300m off Garden Point       569987     5224610    Nutrient, phytoplankton, physico-chem.       ~ 300 m (near scale)
           Boat Ramp

EPA-PA6    Long Bay west of shellfish lease     569865     5225420    Nutrient, phytoplankton, physico-chem.       ~ 800 m (intermediate)

EPA-PA7    Long Bay north east of shellfish lease 570240   5225825    Nutrient, phytoplankton, physico-chem.       ~ 1.1 km (intermediate)

EPA-PA8    Stingaree Bay                        569655     5224900    Nutrient, phytoplankton, physico-chem.       ~ 600 m (intermediate)

EPA-PA9    Carnarvon Bay                        569885     5221210    Nutrient, phytoplankton, physico-chem.       ~ 2.8 km (intermediate)

SG_PA17 Stingaree Bay                           569640     5224888    Epiphyte cover                                                         Co-located with IMAS_SG_PA17

SG_PA16 Stingaree Bay                           569328     5225068    Epiphyte cover                                                         Co-located with IMAS_SG_PA16

SG_PA9     Long Bay                             570128     5225741    Epiphyte cover                                                         Co-located with IMAS_SG_PA9

SG_PA4     Long Bay                             570274     5226192    Epiphyte cover                                                         Co-located with IMAS_SG_PA4

SG_PA28 Stewarts Bay                            569739     5223742    Epiphyte cover                                                         Co-located with IMAS_SG_PA28

SG_PA29 Stewarts Bay                            569591     5223580    Epiphyte cover                                                         Co-located with IMAS_SG_PA29

SG_PA30 Stewarts Bay                            569669     5223188    Epiphyte cover                                                         Co-located with IMAS_SG_PA30

EPA Tasmania, July 2021                                                                                        5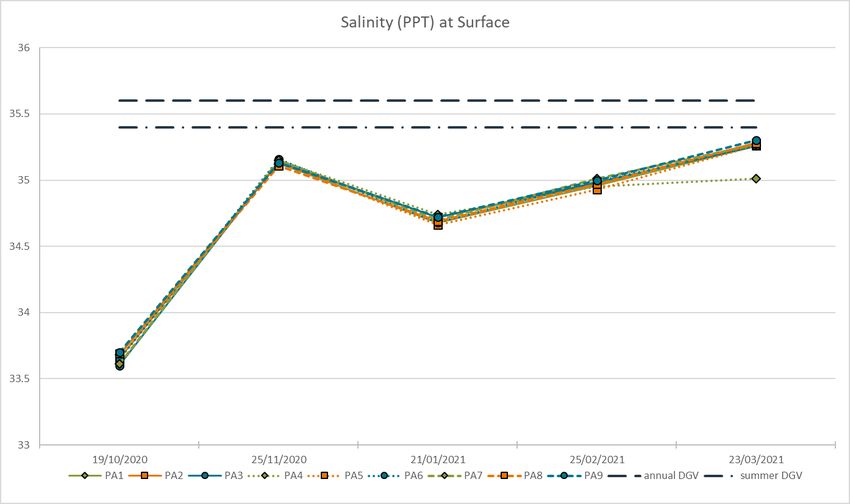
Map 1: Port Arthur monitoring locations

EPA Tasmania, July 2021                   6
Key Parameters/Indicators of Interest
The following table outlines the key water quality indicators of interest and the type of measurement from
which the reported value is derived. The DGVs of surface and bottom waters are provided for the full year
and summer period. For those indicators with a DGV range, the most relevant value from an
environmental perspective is discussed. For temperature the upper value is reported against and for
dissolved oxygen and pH the lower limit.
Table 2: Indicators of interest, measurement type and associated DGVs

                 Indicator               Measurement type           Summer         Annual      Summer        Annual
                                                                     surface       surface     Bottom        Bottom

Nitrogen (Total) (mg/L)               Laboratory analysis (AST)     0.30          0.32        0.30          0.32

Nitrogen, Total Kjeldahl (mg/L)       Laboratory analysis (AST)     Nil           Nil         Nil           Nil

TAN (NH3 and NH4+) (mg/L)             Laboratory analysis (AST)     0.008         0.007       0.013         0.010

Nitrate (mg/L)                        Laboratory analysis (AST)     0.001         0.025       0.009         0.027

Nitrite (mg/L)                        Laboratory analysis (AST)     Nil           Nil         Nil           Nil

Nitrate and Nitrite (mg/L)            Laboratory analysis (AST)     0.001         0.024       0.005         0.033

Phosphorus (Total) (mg/L)             Laboratory analysis (AST)     0.03          0.03        0.04          0.04

Dissolve Reactive Phosphorus (mg/L)   Laboratory analysis (AST)     0.006         0.008       0.008         0.009

Silica, Molybdate Reactive (mg/L)     Laboratory analysis (AST)     0.1           0.2         0.1           0.2

NPOC (dissolved) (mg/L)               Laboratory analysis (AST)     Nil           Nil         Nil           Nil

Chlorophyll a (µg/L)                  Laboratory analysis (AST)     1.0           1.5         Nil           Nil

Temperature (oC)                      Calibrated Field Instrument   14.8 - 17.6   12.3 - 16.9 14.0 - 16.4   12.0 -16.0

Salinity (PPT)                        Calibrated Field Instrument   35.4          35.6        35.4          35.6

Dissolved Oxygen (mg/L)               Calibrated Field Instrument   8.0 – 8.8     7.9 – 8.8   8.0 – 8.7     7.7 – 8.7

Dissolved Oxygen (% saturation)       Calibrated Field Instrument   103.4 –       98.6 –      97.6 –        96.1 –
                                                                    108.0         106.5       105.9         101.4

pH                                    Calibrated Field Instrument   8.1 – 8.3     8.1 – 8.2   8.2 - 8.3     8.1 - 8.2

SpCond (µS/cm)                        Calibrated Field Instrument   Nil           Nil         Nil           Nil

Turbidity (NTU)                       Calibrated Field Instrument   Nil           Nil         Nil           Nil

Epiphyte Score                        Drop Camera                   Nil           Nil         Nil           Nil

Integrated samples are also taken for the identification and enumeration of phytoplankton by AST.

EPA Tasmania, July 2021                                                                                              7
Epiphytic growth
The EPA committed to undertake strategic monitoring of the volume and extent of epiphytic algae growth
on shallow reef and seagrass habitats across the south east of Tasmania. The monitoring aims to improve
the understanding of fluxes in epiphytic algal growth in response to natural coastal processes as well as
anthropogenic interactions, in particular salmon farming activities. A key outcome of the monitoring is the
provision of a snapshot of broadscale epiphytic algal growth dynamics across the south east of Tasmania.
The following table outlines the qualitative categories for assessing epiphytic growth on shallow reef and
seagrass habitats.
Table 3: Description of scoring system used to assess epiphytic growth
Score Description
0 No epiphytic growth present.
1 Very low epiphytic growth, virtually clean plant.
2 Low, minimal epiphytic growth.
3 Medium, obvious epiphytic growth.
4 High, most of plant covered.
5 Very high, plant completely covered.
For the Port Arthur area epiphytic algal growth surveys were undertaken at seven (7) locations as outlined
in Table 1. The data was collected on 25 February 2021 and as such the survey represents a snapshot for
February 2021 at these locations.
Images were captured using a GoPro camera mounted on a quadrat and frame (drop camera). The quadrat
being 0.5mx0.5m in size and fully captured within the field of view of the camera. The quadrat is further
divided into 0.1m2 sections. At each location the camera was set at the surface to record images at
10 second intervals. Location information was recorded via the GoPro camera which is GPS enabled.
Additional GPS information was recorded on the vessel via Garmin GPS.
For each location, 5 or 6 camera drops were conducted. For each camera drop a suitable image was
selected for analysis. The selected images were scored against the qualitative categories outlined in Table 3.
A total score for the location was derived on the basis of the average value for the images analysed at the
location.
ArcGis Pro mapping software was used to spatially display the epiphytic score information.
EPA Tasmania, July 2021 8Results Water Quality Graphical representation of data for key water quality indicators against surface and bottom water annual and summer DGVs. Temperature Figure 1: Water temperature at surface and associated DGVS Figure 2: Water temperature at bottom and associated DGVS EPA Tasmania, July 2021 9
Dissolved Oxygen

Figure 3: Dissolved oxygen (mg/L) levels at surface and associated DGVS

Figure 4: Dissolved oxygen (mg/L) levels at bottom and associated DGVS

EPA Tasmania, July 2021                                                   10
Figure 5: Dissolved oxygen (%Sat) levels at surface and associated DGVS

Figure 6: Dissolved oxygen (%Sat) levels at bottom and associated DGVS

EPA Tasmania, July 2021                                                   11
Salinity

Figure 7: Salinity levels at surface and associated DGVS

Figure 8: Salinity levels at bottom and associated DGVS

EPA Tasmania, July 2021                                    12
pH

Figure 9: pH levels at surface and associated DGVS

Figure 10: pH levels at bottom and associated DGVS

EPA Tasmania, July 2021                              13
TAN (Total Ammoniacal Nitrogen)

Figure 11: TAN concentrations at surface and associated DGVS

Figure 12: TAN concentrations at bottom and associated DGVS

EPA Tasmania, July 2021                                        14
NO3 (Nitrate)

Figure 13: NO3 concentrations at surface and associated DGVS

Figure 14: NO3 concentrations at bottom and associated DGVS

EPA Tasmania, July 2021                                        15
NOx (Nitrate and Nitrite)

Figure 15: NOx concentrations at surface and associated DGVS

Figure 16: NOx concentrations at bottom and associated DGVS

EPA Tasmania, July 2021                                        16
Nitrogen (total)

Figure 17: Nitrogen (total) concentrations at surface and associated DGVS

Figure 18: Nitrogen (total) concentrations at bottom and associated DGVS

EPA Tasmania, July 2021                                                     17
Phosphorus (total)

Figure 19: Phosphorus (total) concentrations at surface and associated DGVS

Figure 20: Phosphorus (total) concentrations at bottom and associated DGVS

EPA Tasmania, July 2021                                                       18
DRP (Dissolved Reactive Phosphorus)

Figure 21: DRP concentrations at surface and associated DGVS

Figure 22: DRP concentrations at bottom and associated DGVS

EPA Tasmania, July 2021                                        19
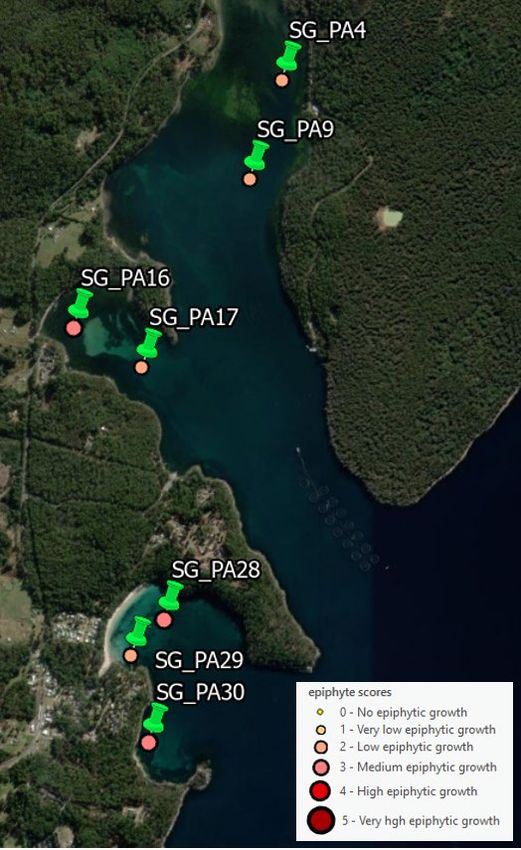
Chlorophyll a

Figure 23: Chlorophyll levels from integrated sample and associated DGVS

Epiphytic Algal growth
Tabulated and spatial representation of survey location epiphytic algal growth scores.
Table 4: Average epiphytic algal growth score by survey location

   Location        Score                                         Description

 SG_PA17        2.20         Low, minimal epiphytic growth.

 SG_PA16        3.00         Medium, obvious epiphytic growth.

 SG_PA9         2.83         Low, minimal epiphytic growth.

 SG_PA4         2.17         Low, minimal epiphytic growth.

 SG_PA28        3.83         Medium, obvious epiphytic growth.

 SG_PA29        2.00         Low, minimal epiphytic growth.

 SG_PA30        3.40         Medium, obvious epiphytic growth.

EPA Tasmania, July 2021                                                                  20
Map 2: spatial representation of epiphytic algal growth scores

EPA Tasmania, July 2021                                          21
Discussion
In this section the results for summer 2021 water quality data will be discussed in relation to the summer
and annual Default Guideline Values (DGVs) for aquatic ecosystems for surface and bottom waters. It
should be noted that the DGVs are based on data collected from August 2013 to July 2017 from four
locations (PA1, PA2, PA3 and PA4). The resultant figures have been applied to the entire Port Arthur area.
A degree of caution is required in interpreting the findings for sites in the upper reaches of Long Bay
against the DGVs. However, in the absence of site specific data, the application of regional DGVs is the
acceptable approach. It should also be noted that the summer DGVs are based on the data from December
to February (inclusive).
The results for epiphytic growth will be discussed in relation to the qualitative categories described in
Table 3 and broader findings for epiphytic growth on seagrass across the South East of Tasmania.
Water Quality
Temperature
The pattern observed for water temperature is as expected during summer where increased solar radiation
increases surface water temperatures, particularly in shallow regions of waterways. The East Australian
Current (EAC) transports warm water down the eastern seaboard during summer and this can also result
in elevated water temperatures around Tasmania.
For October and November all surface water temperature readings were below the annual and summer
period DGVs. For January the surface water temperature for EPA-PA3 and EPA-PA4 were below the
annual DGV whilst all other sites were equal to or greater than the annual DGV. For January all sites were
above the annual DGV and only EPA-PA6 reached the summer DGV level (17.6 oC), whilst for February all
sites except EPA-PA4 exceeded the summer DGV for surface waters. For March all sites were equal to or
above the annual DGV and EPA-PA9 was the only site to equal the summer DGV for surface waters. This
range is comparable to that of the baseline period, being 10.09 oC to 20.91 oC.
For October and November all bottom water temperature readings were below the annual and summer
period DGVs. For January the bottom water temperature reading exceeded the annual DGV for all sites
and the shallow sites within Long Bay (EPA-PA5 to EPA-PA8) also exceeded the summer DGV. For January
the shallow site within Carnarvon Bay (EPA-PA9) was equal to the summer DGV. For February all bottom
water temperature readings exceeded the annual and summer period DGVs. For March all bottom water
temperature readings exceeded the annual DGV and all readings were equal to (EPA-PA4) or exceeded (all
other sites) the summer period DGVs. The elevated bottom water temperatures during February and
March coincide with a southern extension of the EAC which extended around southern Tasmania (IMOS
Ocean current). This range is comparable to that of the baseline period, being 9.44 oC to 19.15 oC.

Dissolved Oxygen
Given that the annual and summer DGVS for surface waters of Port Arthur for dissolved oxygen are
7.9 mg/L and 8.0 mg/L, respectively, the results will be compared to the more conservative summer DGV.
For October and November all surface water dissolved oxygen readings were above the summer DGV. For
January the surface water dissolved oxygen readings for EPA-PA3, EPA-PA4 and EPA-PA9 were above the
summer DGV, whilst all other sites were below. For February and March, the surface water dissolved
oxygen readings were below the summer DGV for all sites. With the lowest values being within Long Bay.
This is not unexpected given that as water temperature increases the carrying capacity for oxygen
decreases. This range is comparable to that of the baseline period, being 7.2 mg/L to 9.6 mg/L.
As with the surface waters, bottom water dissolved oxygen levels shall be compared to the more
conservative summer DGV. For October all bottom water dissolved oxygen readings were above the
summer DGV. For November only EPA-PA5 had a bottom water dissolved oxygen reading that was below
the summer DGV. For January, February and March all dissolved oxygen reading were equal to or below
the summer DGV. The lowest dissolved oxygen reading was 5.0 mg/L for site EPA-PA7 in March. This is a
likely indicator of localised oxygen demand resulting from the combined influence of in-situ factors (such as
senescence of algae) and external factors (such as runoff from the surrounding catchment). This range is
comparable to that of the baseline period, being 7.0 mg/L to 9.7 mg/L.

EPA Tasmania, July 2021                                                                                     22
Salinity
The pattern observed for salinity indicates that the water column at all sites is dominated by water of
marine origin. The values recorded were below that of the annual and summer DGVs for surface and
bottom waters on all occasions.

pH
The pattern observed for pH indicates that the water column at all sites is dominated by water of marine
origin. Of note is that the value for EPA-PA7 is markedly lower in March than the other locations. The low
value in the upper section of Long Bay may indicate catchment-based inputs. This range is comparable to
that of the baseline period, being 7.3 to 8.4.

TAN (Total Ammoniacal Nitrogen)
For the monitoring period (October 2020 to March 2021) the majority (23 of 45 readings) of surface water
TAN (Total Ammoniacal Nitrogen) readings were either at or below the Limit of Reporting (LoR), being
0.005 mg/L. Of the remaining records eight were above the summer and annual DGVs, of which four were
associated with EPA-PA1. This reflects the close proximity of the site to the finfish lease. On these
occasions, TAN accounted for between 4.1 % to 14.6 % of total nitrogen. In January, TAN was lower than
the annual and summer DGVs and represented 1.9 % of total nitrogen. One observation above the annual
and summer DGVs was evident for EPA-PA3 during October. TAN represented 4.8 % of total nitrogen for
the site on this occasion. The remaining observation above the annual and summer DGVs occurred during
March at sites EPA-PA5 (0.009 mg/L), EPA-PA6 (0.016 mg/L), and EPA-PA7 (0.018 mg/L). These
observations indicated that TAN accounted for 3.5 %, 5.9 % and, 6.2 % of total nitrogen, respectively. This
range is comparable to that of the baseline period, being 0.001 mg/L to 0.031 mg/L. Interestingly, the TAN
values increased the further toward the upper section of Long Bay. The elevated readings in the upper
section of Long Bay may indicate catchment-based inputs.
For the monitoring period (October 2020 to March 2021) around one third (14 of 45 readings) of bottom
water TAN (Total Ammoniacal Nitrogen) readings were either at or below the Limit of Reporting (LoR),
being 0.005 mg/L. Of the remaining readings, eleven were above the annual DGVs of 0.010 mg/L, and six of
these were above the summer DGV of 0.013 mg/L. During October, TAN levels for EPA-PA3 and EPA-
PA4, were 0.018 mg/L and 0.015 mg/L, respectively. This indicates the intrusion of marine water masses
from outside of Port Arthur, though this accounted for less than 2.5% of total nitrogen at the sites. During
January the TAN level for EPA-PA5 was 0.031 mg/L, which is the highest recorded for the period or for the
baseline period (0.0025 mg/L to 0.028 mg/L). This accounted for 9.1 % of total nitrogen at the site. The
remaining readings above the annual and summer DGVs occurred during March 2021 at sites EPA-PA5
(0.017 mg/L), EPA-PA6 (0.016 mg/L), and EPA-PA7 (0.017 mg/L). TAN accounted for 6.5 %, 5.7 % and 5.0 %
of total nitrogen, respectively for these sites. This pattern indicates the ingress of bottom waters into Long
Bay, as is typical in tidal systems.

NO3 (Nitrate)
For the monitoring period (October 2020 to March 2021) all surface water NO3 (nitrate) readings were
either at or below the Limit of Reporting (LoR), being 0.002 mg/L. This is consistent with the summer
period values used in deriving the DGVs where only a single value was above the LoR from August 2013 to
July 2017.
For the monitoring period (October 2020 to March 2021) all bottom water NO3 (nitrate) readings were
either at or below the Limit of Reporting (LoR) for sites EPA-PA1, EPA-PA6, EPA-PA7, EPA-PA8 and EPA-
PA9. EPA-PA5 was below the LoR for all months except March when a value of 0.003 mg/L was recorded.
These findings indicate that for shallow sites, the NO3 levels were consistently low throughout the water
column for the monitoring period. For October, of the deeper sites (EPA-PA2, EPA-PA3 and EPA-PA4)
only EPA-PA4 exceeded the summer DGV for bottom waters. EPA-PA4 also exceeded the annual DGV for
bottom waters. For November EPA-PA2 was below the summer and annual DGVs whilst, EPA-PA3 and

EPA Tasmania, July 2021                                                                                    23
EPA-PA4 exceed the summer DGV but were below the annual DGV for bottom waters. For January EPA-
PA2, EPA-PA3 and EPA-PA4 were below the LoR value for bottom waters. For February EPA-PA2 and
EPA-PA3 were below the LoR value and EPA-PA4 at 0.003 mg/L which is below the summer DGV. For
March EPA-PA2 and EPA-PA3 are greater than the summer DGV and below the Annual DGV for bottom
waters. EPA-PA4 exceeded the summer and annual DGVs for bottom waters. The maximum value
recorded for NO3 during the base line period for bottom waters was 0.061 mg/L.
The pattern observed in nitrate values for bottom waters at the deep water sites reflects the intrusion of
marine water masses from outside of Port Arthur. The nature of the marine water is strongly influenced by
eddies of the EAC, intrusion of the Zeehan current from the west and currents within the Southern Ocean
and Tasman Sea. The Zeehan current is a dominant current during winter and extends down the west
coast of Tasmania and then past the south east in an easterly direction. Much like the EAC which is a
dominant current over summer the Zeehan current is relatively warm and low in nitrate concentration. In
contrast waters brought in by currents from the Southern Ocean are of sub-antarctic origin and tend to be
relatively cool with elevated nitrate concentrations.

NOx (Nitrate and Nitrite)
For the monitoring period (October 2020 to March 2021) all surface water NOx (nitrate and nitrite)
readings were either at or below the Limit of Reporting (LoR), being 0.002 mg/L. This is consistent with the
summer period values used in deriving the DGVs where only a single value was above the LoR from
August 2013 to July 2017.
For the monitoring period (October 2020 to March 2021) all bottom water NOx (nitrate and nitrite)
readings were either at or below the Limit of Reporting (LoR) for sites EPA-PA6, EPA-PA7, EPA-PA8 and
EPA-PA9, EPA-PA5 was below the LoR for all months except March when a value of 0.003 mg/L was
recorded. EPA-PA1 was below or equal to the LoR for all months except November when a value of
0.003 mg/L was recorded. These findings indicate that for shallow sites, the NOx levels were consistently
low throughout the water column for the monitoring period. For October, of the deeper sites (EPA-PA2,
EPA-PA3 and EPA-PA4,) only EPA-PA4 was above the summer DGV for bottom waters. EPA-PA4 was also
above the annual DGV for bottom waters. For November EPA-PA2, EPA-PA3 and EPA-PA4 were above
the summer DGV but were below the annual DGV for bottom waters. For January EPA-PA2, EPA-PA3 and
EPA-PA4 were below the LoR value for bottom waters. For February EPA-PA2 and EPA-PA3 were below
the LoR value and EPA-PA4 at 0.003 mg/L which is below the summer DGV For March EPA-PA2 and EPA-
PA3 are greater than the summer DGV and below the Annual DGV for bottom waters. EPA-PA4 was
above the summer and annual DGVs for bottom waters, with a value of 0.42 mg/L. The maximum value
recorded for NOx during the base line period for bottom waters at PA4 was 0.055 mg/L.
The pattern observed in NOx values for bottom waters at the deep water sites reflects the intrusion of
marine water masses from outside of Port Arthur, as described for Nitrate above.

Nitrogen (total)
For the monitoring period (October 2020 to March 2021) Nitrogen total readings for surface water tended
to be higher within Long Bay than for all other sites. During October, EPA-PA6 recorded a reading of
0.31 mg/L, which is above the summer DGV (0.30 mg/L) but lower than the annual DGV (0.32 mg/L). All
other sites recorded values lower than the summer DGV. For November and March all sites recorded
values lower than the summer DGV, though values for sites within Long Bay were higher than for the other
sites. For January and February the Long Bay sites (EPA-PA1, EPA-PA5, EPA-PA6, EPA-PA7, and EPA-PA8)
recorded values above the summer DGV, In February, EPA-PA1 recorded a value equal to the annual DGV
as did EPA-PA8 in January. Interestingly, EPA-PA7 was above the annual DGV value for January and
February. The elevated readings for EPA-PA7 may indicate catchment based inputs. These values are well
below the maximum recorded for the baseline period, being 0.46 mg/L for surface waters.
For sites EPA-PA1, EPA-PA2, EPA-PA3 and EPA-PA9 all readings for bottom waters were below the
summer DGV value of 0.30 mg/L. EPA-PA4 was above the annual DGV during October, recording a value
of 0.37 mg/L. During January EPA-PA5, EPA-PA6 and EPA-PA7 recorded values above the annual DGV.

EPA Tasmania, July 2021                                                                                  24
During February EPA-PA7 and EPA-PA8 were above the annual DGV. These values are well below the
maximum recorded for the baseline period, being 0.45 mg/L for bottom waters.

For all sites, organic nitrogen represents the majority of nitrogen within surface and bottom waters.
Organic nitrogen (ON) is calculated by removing the TAN component from Total Kjeldahl Nitrogen
(TKN). The relative proportions of TAN, NOx and organic nitrogen for each site on a monthly basis for
surface and bottom waters are presented in Appendix 1.

Phosphorus (total)
For the monitoring period (October 2020 to March 2021) Phosphorus total readings for surface waters
tended to be equal to or above the annual and summer DGVs of 0.030 mg/L for the shallow water sites
and lower for the deep water sites. EPA-PA4 (the outer most deep water site) recorded a value of
0.030 mg/L during November but was as with EPA-PA2 and EPA-PA3 consistently lower on all other
occasions. Interestingly, EPA-PA9 (shallow Carnarvon Bay site) had a value below the DGVs on all
occasions. EPA-PA1 was equal to the DGVs values during October and February and above the DGVs for
January (0.038 mg/L) and March (0.032 mg/L), whilst below in November. This pattern is also reflected in
the shallow water sites in Long Bay (EPA-PA5, EPA-PA6, EPA-PA7, and EPA-PA8). These values are well
below the maximum recorded for the baseline period, being 0.07 mg/L for surface waters.
Phosphorus total readings for bottom waters have a less evident trend. EPA-PA4 had a reading of
0.048 mg/L for October. This is the only occasion however that a site not within the shallow reaches of
Long Bay had a reading that was above the summer and annual DGVs, being 0.040 mg/L. Only EPA-PA5 had
readings above the DGVs during October and November, being 0.047 mg/L and 0.049 mg/L, respectively.
During January, EPA-PA5, EPA-PA6, EPA-PA7, and EPA-PA8 had bottom water readings above the DGVs
(ranging from 0.044 mg/L to 0.049 mg/L). During February, EPA-PA8 returned a reading of 0.042 mg/L as
did EPA-PA7 during March 2021. These were the only two sites for the last two months of the survey
period to have bottom water values above the DGVs. These values are well below the maximum recorded
for the baseline period, being 0.07 mg/L for bottom waters. The elevated reading for EPA-PA7 during
March 2021 may indicate catchment based inputs.

DRP (Dissolved Reactive Phosphorus)
For October to February all surface water DRP (Dissolved Reactive Phosphorus) readings were either at
or below the summer DGV, except for EPA-PA7 during January. For January, EPA-PA7 had a reading of
0.007 mg/L , which is higher than the summer DGV (0.006 mg/L) but lower than the annual DGV
(0.008 mg/L). For March, the deep water sites (EPA-PA2, EPA-PA3 and EPA-PA4) were lower than annual
and summer DGVs. The shallow water sites in Long Bay, were equal to the summer DGV (EPA-PA5 and
EPA-PA8) or lower than the annual DGV value (EPA-PA1 and EPA-PA6). The only exception was EPA-PA7
that had a value of 0.011 mg/L. Interestingly, EPA-PA9 (shallow Carnarvon Bay site) had a value of
0.005 mg/L, which is the same as that for the outer deep site (EPA-PA4). The elevated readings in the
upper section of Long Bay may indicate catchment based inputs. Stream gauge information from Allens
Rivulet indicates that a high rainfall event occurred within the catchment causing discharge to rise over a
two day period (24 March to 26 March) from 1.2 ML/day to over 275.0 ML/day. Long Bay Creek which
shares headwaters with Allens Rivulet would have shown a similar discharge pattern. The increase at EPA-
PA7 and associated decrease in pH may reflect runoff associated with the onset of the rain event.
For the monitoring period bottom water DRP (Dissolved Reactive Phosphorus) readings were lower than
the summer or annual DGVs on all but 4 occasions. EPA-PA4 recorded a value of 0.01 mg/L during
October and of 0.009 mg/L during March. The latter value being equivalent to the annual DGV for bottom
waters. EPA-PA5 recorded a value of 0.016 mg/L during November and EPA-PA7 of 0.013 mg/L in March.
The elevated reading for EPA-PA7 may indicate catchment based inputs.

EPA Tasmania, July 2021                                                                                  25
Chlorophyll a
For all months EPA-PA1, EPA-PA2, EPA-PA5, EPA-PA6 and EPA-PA8 chlorophyll a values were above the
annual and summer DGVs for chlorophyll a. EPA-PA7 was above the summer DGV for all months and the
annual DGV for all months except October. Interestingly, EPA-PA9 (shallow Carnarvon Bay site) had a
value lower than the summer and annual DGVs for October 2021, had a value that lies between the
summer DGV and annual DGV from November to February and was above both DGVs during March.
EPA-PA3 was above the summer DGV for all months but below the annual DGV for November and
February. EPA-PA4 was above the summer DGV and annual DGV for November to January and equal or
lower than both DGVs for February and March.
It is not uncommon that chlorophyll a concentration is higher in shallow areas where light is not limited,
and nutrients are available. The higher chlorophyll a levels for the shallow Long Bay sites (EPA-PA5, EPA-
PA6, EPA-PA7, and EPA-PA8) indicate a higher level of nutrient availability compared to the shallow
Carnarvon Bay site (EAP-PA9) which is of similar depth and water clarity.

Epiphytic Algal growth
Overall the February 2021 snapshot indicated that epiphytic growth was of the Low (minimal) to Medium
(obvious) range for seagrass within Port Arthur. These findings are in line with those for the South East of
Tasmania, where 45% (22 of 49 locations) and 35% (17 of 49 locations) were of the Low (minimal) to
Medium (obvious) range, respectively. Other areas with sea grass habitat with epiphytic algal growth that is
comparable for the February 2021 snapshot include Blackman Bay, the D’Entrecasteaux Channel,
Recherche Bay, Frederick Henry Bay, Norfolk Bay and the Mercury Passage.

Conclusion
The data reviewed in this document indicates that the water quality of the Port Arthur is akin to that of the
baseline period on which the DGVs were derived. For most parameters the levels have remained within
the overall range of the baseline dataset even when lower or greater than the DGVs.
Water within the Port Arthur area is chiefly of marine origin and nature. The upper section of Long Bay is
at times subject to catchment runoff following rainfall events. Some elevation in TAN and Nitrogen (total)
is discernible within waters near the finfish lease. These elevations are not persistent over the period
surveyed and seem to be limited to the surface water in the immediate vicinity of the lease. The increased
nutrient availability from these sources contributes to the elevated chlorophyll a levels noted within Long
Bay.
The level of epiphytic growth noted was comparable to that for other sea grass habitats across the South
East of Tasmania for the February snapshot.

EPA Tasmania, July 2021                                                                                      26
Appendix 1
Surface Water Nitrogen Compounds

Figure 24: October 2020 surface water nitrogen compounds and budget for Port Arthur.

Figure 25: November 2020 surface water nitrogen compounds and budget for Port Arthur.

EPA Tasmania, July 2021                                                                 27
Figure 26: January 2021 surface water nitrogen compounds and budget for Port Arthur.

Figure 27: February 2021 surface water nitrogen compounds and budget for Port Arthur.

EPA Tasmania, July 2021                                                                 28
Figure 28: March 2021 surface water nitrogen compounds and budget for Port Arthur.
Bottom Water Nitrogen Compounds

Figure 29: October 2020 bottom water nitrogen compounds and budget for Port Arthur.

EPA Tasmania, July 2021                                                               29
Figure 30: November 2020 bottom water nitrogen compounds and budget for Port Arthur.

Figure 31: January 2021 bottom water nitrogen compounds and budget for Port Arthur.

EPA Tasmania, July 2021                                                                30
Figure 32: February 2021 bottom water nitrogen compounds and budget for Port Arthur.

Figure 33: March 2021 bottom water nitrogen compounds and budget for Port Arthur.

EPA Tasmania, July 2021                                                                31
You can also read