Weekly update for coronavirus figures in the county

Page created by Gilbert Barrett
 
CONTINUE READING
Weekly update for coronavirus figures in the county
Weekly update for coronavirus
      figures in the county
                      Wednesday 21 October 2020

   How is coronavirus affecting people in Lancashire?
This is a weekly bulletin produced by the Lancashire Resilience Forum with the
 latest figures on the number of coronavirus-related cases and deaths in the
              county, as well as figures at a unitary and district level.
     It also shows how Lancashire compares to other areas of the country.
Weekly update for coronavirus figures in the county
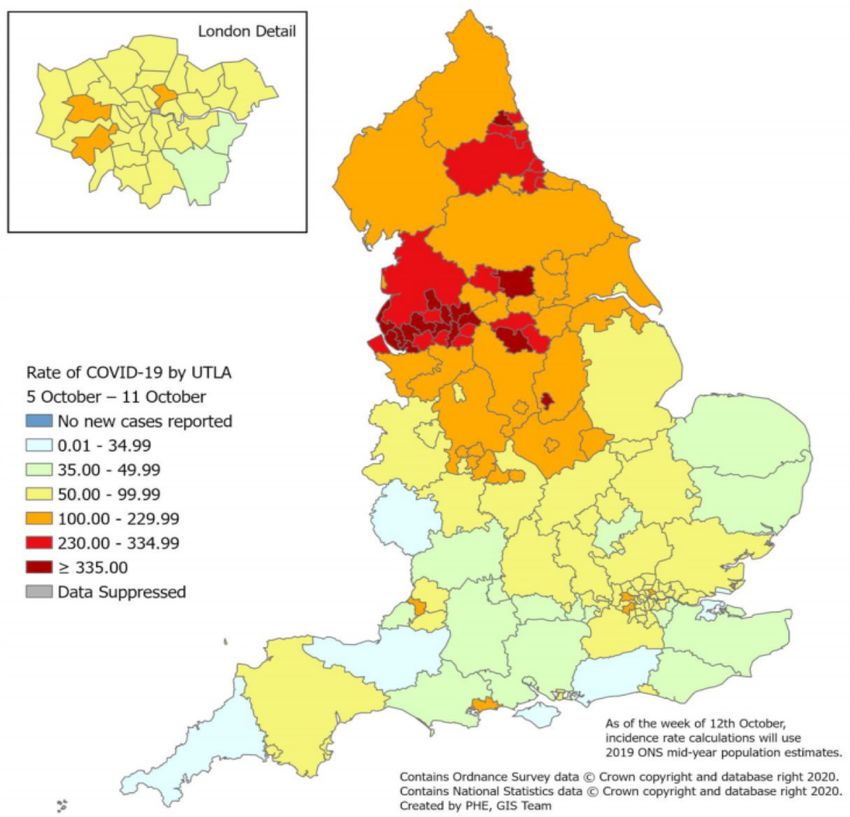
Confirmed cases from positive
‘pillar 1 and 2’ tests up to
                                                                                                                               2,285
18 October 2020
                                                                                    1,545
                                                                                                    LANCASTER
                                                                                                                                            906
LANCASHIRE

30,648                                                                   3,778
                                                                                                  WYRE
                                                                                                                      RIBBLE
                                                                                                                      VALLEY
                                                                                                                                                    2,479
                                                          2,451
NORTH WEST                                                                                                                         PENDLE

157,193                                                                1,139
                                                                                     BLACKPOOL
                                                                                          FYLDE
                                                                                                    PRESTON

                                                                                                   SOUTH
                                                                                                   RIBBLE
                                                                                                                              BURNLEY
                                                                                                                        HYNDBURN
                                                                                                                    BLACKBURN
                                                                                                                    WITH
                                                                                                                                                    2,572

ENGLAND                                                                                                             DARWEN
                                                                                                                            ROSSENDALE
                                                                                                                                                  1,741

629,211
                                                                          2,415                          CHORLEY

                                                                                            WEST
                                                                                            LANCASHIRE
                                                                                                                                            1,462
                                                                                                                     1,696      4,449
                                                                                                            1,730
These figures are from tests carried out in Public Health England labs and in
the NHS (Pillar 1) and from other testing routes, such as mobile labs (Pillar 2).
Weekly update for coronavirus figures in the county
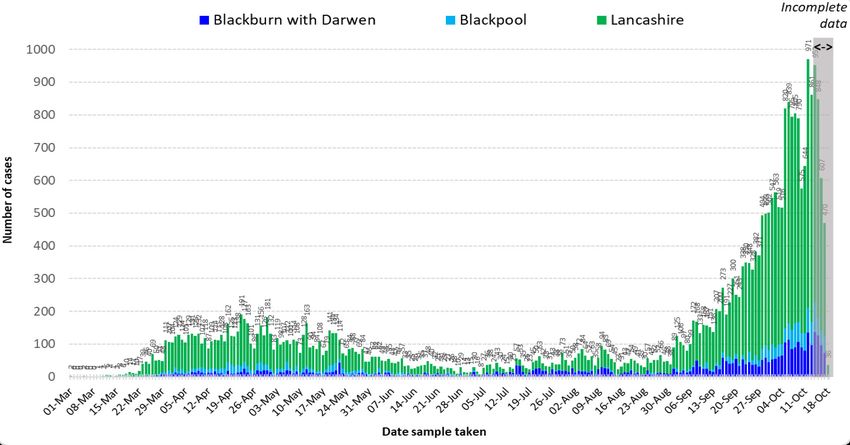
Weekly rate of Covid-19
cases per 100,000 population
tested under pillar 1 and
pillar 2 (Week 41 - data
between 5 October and
11 October 2020).                                                                Blackpool
                                                                                             Lancashire

                                                                                 Blackburn
                                                                               with Darwen

For rate of cases detected via Pillar 1 & 2 testing:
Blackpool is in the third highest category, Lancashire in the second highest
category and Blackburn with Darwen in the highest category.

Pillar 1 = swab testing in PHE labs & NHS hospitals for those with a
medical need and key workers & their families
Pillar 2 = testing by commercial partners - swab testing for the wider
population from out in the community
Weekly update for coronavirus figures in the county
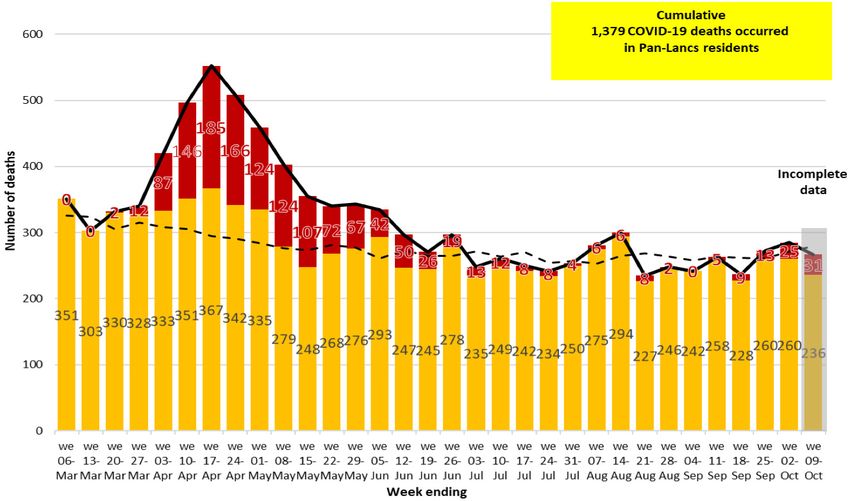
Cumulative lab-confirmed cases up to 18 October,
                                             rate per 100,000

Source: https://coronavirus.data.gov.uk     Cases are from both pillar 1 and 2
Weekly update for coronavirus figures in the county
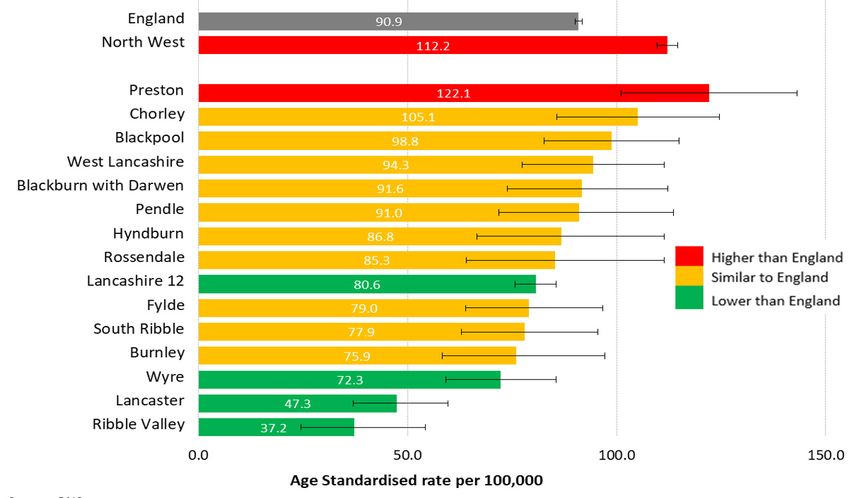
Daily pillar 1 and pillar 2 lab-confirmed cases to 18 October

Positive tests are counted according to the date the sample was taken. However, most
swabs taken in recent days will not yet have produced a result, so it is important not to
jump to the conclusion that the epidemic is tailing off quicker than it really is. The PHE
website cautions that only data from five days or more ago can be considered complete.       Figures relating to confirmed cases by Upper Tier Local Authority
The greyed-out columns in figure above are liable to be added to as more results come in.           can be downloaded from: https://coronavirus.data.gov.uk
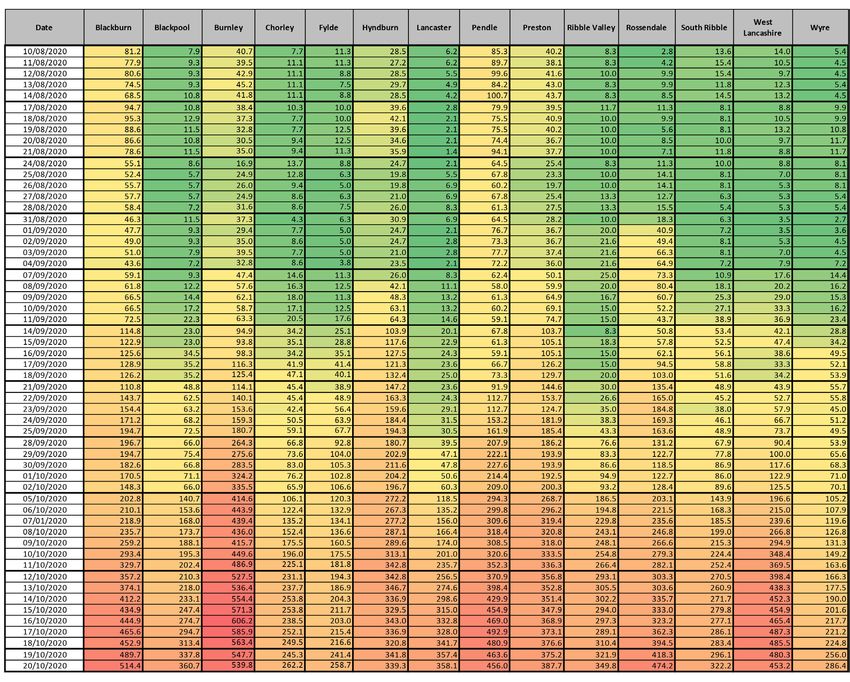
Testing and incidence reporting period 14/10/20 - 20/10/20

                                                     Individuals Tested          Percentage Tested Positive           Daily Incidence
           Local Authority                               per 100,000                    per 100,000                     per 100,000
                                                  (7-Day Moving Average)          (7-Day Moving Average)          (7-Day Moving Average)
  Blackburn with Darwen                          502.9      504.8      ↓          15.5      14.8      ↑          514.4     489.7       ↑
  Blackpool                                      460.5      465.5      ↓          10.5      10.7      ↓          360.7     337.8       ↑
  Burnley                                        532.7      547.5      ↓          15.3      15.1      ↑          539.8     547.7       ↓
  Chorley                                        385.0      390.6      ↓           9.9       9.3      ↑          262.2     245.3       ↑
  Fylde                                          384.5      379.5      ↑           9.1       9.4      ↓          258.7     241.4       ↑
  Hyndburn                                       467.8      485.3      ↓          10.9      10.5      ↑          339.3     341.8       ↓
  Lancaster                                      429.5      444.3      ↓          12.6      12.5      ↑          358.1     357.4       ↑
  Pendle                                         530.6      560.3      ↓          13.4      12.9      ↑          456.0     463.6       ↓
  Preston                                        461.0      469.5      ↓          12.7      12.1      ↑          387.7     375.2       ↑
  Ribble Valley                                  394.4      390.9      ↑          13.5      12.5      ↑          349.8     321.9       ↑
  Rossendale                                     477.0      467.7      ↑          14.4      13.0     ↑↑          474.2     418.3      ↑↑
  South Ribble                                   409.4      415.9      ↓          11.7      10.5     ↑↑          322.2     296.1      ↑
  West Lancashire                                512.5      528.3      ↓          14.1      14.5      ↓          453.2     480.3      ↓
  Wyre                                           346.1      358.9      ↓          10.5      10.5      ó          286.4     256.0      ↑↑
  LRF (14th october)                                                                                             371.0
  England (14th October)                                                                                         168.7

Due to the reporting delays for comparison between Local Authorities the most
recent 4 days are excluded from the calculations of rates and moving averages.

Single direction-of-travel arrows denote a perecntage change of less than 10%.
Twin arrows denote a change of greater than 10%.                                                      Source: PHE laboratory confirmed COVID-19-line list
Covid-19 cases (number of people with a lab-confirmed
positive test result) by Middle Super Output Area (MSOA).
MSOAs with 3 and above COVID-19 cases, in the 7 days ending 15 October

                                                           MSOAs are small areas with around 7,200 average population
                                                           and are used to facilitate the reporting of small area statistics.

                                                           Source: https://coronavirus.data.gov.uk/cases
                               Continued on next page
Covid-19 cases (number of people with a lab-confirmed positive test
result) by Middle Super Output Area (MSOA).
MSOAs with 3 and above COVID-19 cases, in the 7 days ending 15 October

                                                           MSOAs are small areas with around 7,200 average population
                                                           and are used to facilitate the reporting of small area statistics.

                                                           Source: https://coronavirus.data.gov.uk/cases
New cases per 100,000 population (7 day average)
as published every day by Public Health England
Number of COVID-19 cases occupying hospital beds
              Number of COVID-19  cases
                         in Lancashire   occupying
                                       and         hospital beds in
                                           South Cumbria
                                               Lancashire and South Cumbria
            Number of COVID-19 25/08/2020
                                cases01/09/2020
                                          occupying
                                                08/09/2020hospital       beds29/09/2020
                                                           15/09/2020 22/09/2020 in                                                                     06/10/2020 13/10/2020

                       Lancashire and South Cumbria
Weekly admissions to hospitals for COVID-19                               3              2              4              4            15             25          53         63
                                                     25/08/2020 01/09/2020 08/09/2020 15/09/2020 22/09/2020 29/09/2020 06/10/2020 13/10/2020

Weekly inpatient diagnoses for COVID-19                                   3            12               5              50           43             93         156        190
Weekly admissions to hospitals for COVID-19                     3             2           4            4          15           25           53           63

Number of HDU/ITU/IDU beds with COVID-19                                  3              6              4              10           20             39          82        105
Weekly inpatient diagnoses for COVID-19                         3             12          5          50           43           93          156          190
patients on specified date

Number of HDU/ITU/IDU beds with COVID-19                        3             6           4          10           20           39           82          105
Numberonofspecified
patients   beds (excluding
                    date     HDU/ITU/IDU) with                            4              6              6              30           51             75         132        203
COVID-19 patients on specified date

Number of beds (excluding HDU/ITU/IDU) with                     4             6           6          30           51           75          132          203
COVID-19 patients on specified date
The hospital admission figures are of people who had a confirmed case of COVID-19 in the 14 days prior to admission.

Thehospital
The weeklyadmission
            inpatientfigures
                       diagnoses
                             are of are patients
                                    people       who
                                           who had    receivedcase
                                                   a confirmed a confirmed COVID
                                                                   of COVID-19 in thediagnosis   after
                                                                                      14 days prior     being admitted to hospital.
                                                                                                    to admission.

The
Theweekly inpatient
    in hospital     diagnoses
                 data  used isare patientsofwho
                               a subset      thereceived a confirmed
                                                  data that          COVID
                                                            is published   diagnosis
                                                                         monthly by after being here:
                                                                                     the NHS    admitted to hospital.
                                                                                                      https://www.england.nhs.uk/statistics/statistical-work-
areas/covid-19-hospital-activity/ It will not be made available at an organisation level.
The in hospital data used is a subset of the data that is published monthly by the NHS here: https://www.england.nhs.uk/statistics/statistical-work-
areas/covid-19-hospital-activity/ It will not be made available at an organisation level.
Count of deaths identified as
Covid-19 on death certificates
                                                                                         78
and occurred up to 9 October
but were registered up to      124
17 October                                                     LANCASTER
                                                                                                             31

                                          144                                   RIBBLE
                                                                                                                           83
                                    154                      WYRE               VALLEY

                                                                                                PENDLE
LANCASHIRE                                      BLACKPOOL      PRESTON

                                          100
                                                     FYLDE                              BURNLEY
                                                                                                                           73
       60                 304                                 SOUTH
                                                                                  HYNDBURN
                                                                              BLACKBURN
      at home          in a care home
                                                              RIBBLE          WITH
                                                                                      ROSSENDALE

     984
                                                                              DARWEN
                                                                                                                       74
     in hospital
                         30
                         in a hospice
                                          131                       CHORLEY

                                                    WEST

         Other     1                                LANCASHIRE
                                                                                                               59
                                                                                96         114
                                                                       118
 TOTAL 1,379
                                                                                         Source: Office for National Statistics (ONS)
Weekly deaths occurring up to 9 October,
compared with the five-year weekly average

 Non-Covid-19         Covid-19
 Total deaths         Weekly average (2014 - 2018)
                                                     Source: Office for National Statistics (ONS)
Covid-19 mortality rate, all persons
1 March to 31 July 2020, rate per 100,000

                                            Source: Office for National Statistics (ONS)
Help share our messages!

     Access our range of resources to share on social media to
encourage Lancashire people to play their part to combat coronavirus.

       Find out more about the LancsTogether campaign and
                   what you can do to take part.

We are all working together in Lancashire to combat coronavirus.
You can also read