White Paper Effects of COVID-19 on Traffic Congestion, Driver Speed, and Vehicle Crashes in the Southern Nevada Region - Waycare
←
→
Page content transcription
If your browser does not render page correctly, please read the page content below
White Paper
Effects of COVID-19 on Traffic Congestion,
Driver Speed, and Vehicle Crashes in the
Southern Nevada Region

                                             August 10, 2020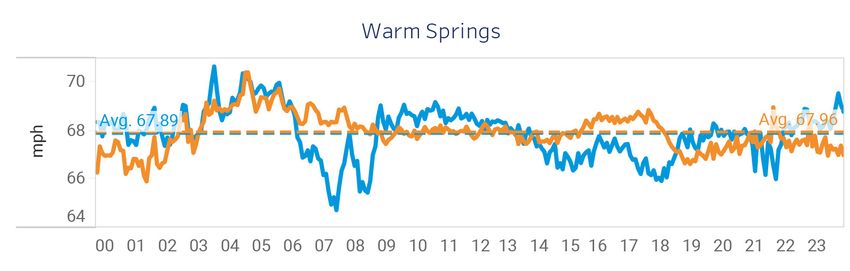
Introduction                                              Preliminary finds are summarized below with further
                                                          details and visualizations provided on the following
The following white paper identifies the effects of       pages:
COVID-19 on traffic congestion, driver speed, and
vehicle crashes in the Southern Nevada region with        Traffic Congestion:
a particular focus on Las Vegas. The study was            • There was a 40% decrease in average hours of traffic
conducted during the timeframe of February through        congestion on the roads surrounding the McCarran
June 2020 to capture the conditions prior to the stay-    International Airport [Apr compared to Feb].
at-home orders and after they were lifted.                • There was a 33% decrease in average hours of traffic
                                                          congestion on the roads surrounding the Las Vegas
                                                          Strip [Apr compared to Feb].
Sources of Data
                                                          Driver Speeds
Waycare is a cloud-based software that uses
                                                          • There was a 33.7% increase in average driver speeds
Artificial Intelligence (AI) to provide comprehensive
                                                          on US-95 Southbound between Alexander Rd and
solutions for the traffic management industry. The
                                                          Jones [Mar 12 - May 8 compared to Feb 1 - Mar 11].
platform   integrates   data   from   various   sources
                                                          • There was a 19.4% increase in average driver speed
including navigation apps, connected vehicles, road
                                                          on I-15 Northbound between Blue Diamond Road and
sensors, weather forecasts, and more. In this
                                                          Sahara [Mar 12 - May 8 compared to Feb 1 - Mar 11]
white paper, Waycare leveraged these 3rd party
                                                          • There was a 24.4% increase in average driver speeds
partnerships to supplement reports provided by the
                                                          on I-15 Southbound          between Carey Avenue and
Regional Transportation Commission of Southern
                                                          Tropicana [Mar 12 - May 8 compared to Feb 1 - Mar 11].
Nevada (RTC), the Nevada Highway Patrol (NHP), and
the Nevada Department of Transportation (NDOT).
                                                          Crash Occurrences
                                                          • Between Mar 12 - May 8, there were ~68% fewer

Summary                                                   crashes in Las Vegas compared to the previous year.
                                                          During this period of time, Nevada was under a
Our primary findings suggest that the COVID-19            Declaration of Emergency and a subsequent stay-at-
pandemic led to a major decrease in both traffic          home order went into effect.
congestion and crashes in Las Vegas. However,             • Between May 9 - Jun 30, there were ~57% fewer
the average speed increased throughout observed           crashes     compared   to    the   previous   year. During
corridors, likely due to the reduced number of cars       this period of time, a phased reopening process was
on the roads. Perhaps counter intuitively, the fatality   underway.
rate among car crashes increased at the height of
the shutdown. Variables at play suggest a correla-        Crash Fatalities
tion between speed and fatality during this period        • Although the amount of traffic crashes was down,
as a result of drivers traveling at higher speeds.        the fatality rate still increased by 1.49% in April.

                                                                                                                       2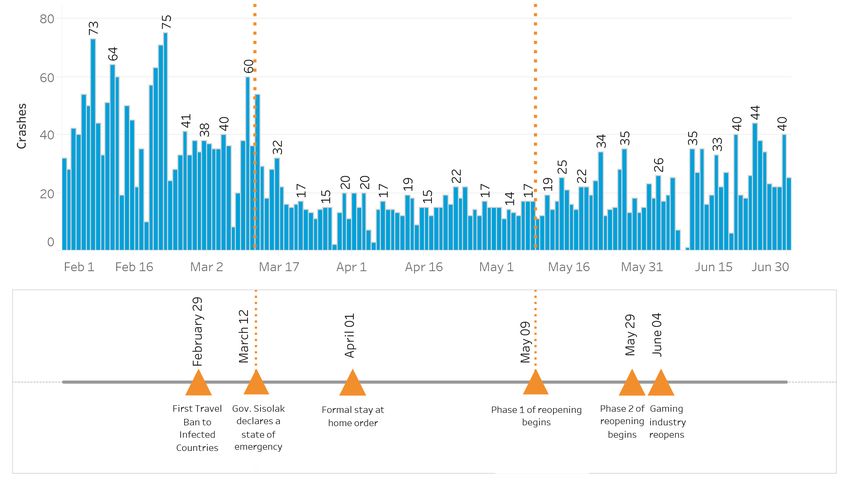
Timeline of                                                ➢ April 1
                                                           Governor Sisolak formally issued a stay-at-

COVID-19                                                   home order and extended the closure of
                                                           schools, casinos, and other nonessential

Related Events                                             businesses.

A timeline with certain dates marking significant events
has been constructed to serve as the parameters for        ➢ May 9
this investigation:
                                                           Phase 1 of reopening was declared; bar-
                                                           bershops, salons, restaurants with limited
                                                           capacity, and open-air malls were among
        ➢ January 31
                                                           the first businesses allowed to reopen.
        President Trump signed a proclamation
        to suspend entry into the United States
        of people who were physically present in
        China over a 14-day period preceding their         ➢ May 29
        attempted entry. The proclamation took             Phase 2 of reopening was announced; gyms,
        effect Sunday, February 2.                         fitness facilities, spas, indoor malls, zoos,
                                                           movie theatres, art galleries, pools, and places
                                                           of worship with less than 50 people were
                                                           declared fit to reopen.
        ➢ February 29
        Overall presence of COVID-19 cases was
        too low to be detected in the U.S. through
        emergency department syndromic surveil-            ➢ June 4
        lance data; few travel restrictions were in
                                                           The Gaming Industry reopened; casinos and
        place outside of a complete travel ban for
                                                           resorts were permitted to operate with social
        Iran and travel advisories for parts of Italy
                                                           distancing restrictions and required tempera-
        and South Korea.
                                                           ture checks.

        ➢ March 12-20
        Following the first reported case of COVID-19
        in the state, on March 5th Governor Steve
        Sisolak issued a Declaration of Emergency
        to facilitate the State’s response to the
        pandemic on March 12th. Five days later, a
        statewide shutdown was put in place for
        all   non-essential   businesses,   including
        casinos and hotels.

                                                                                                              3
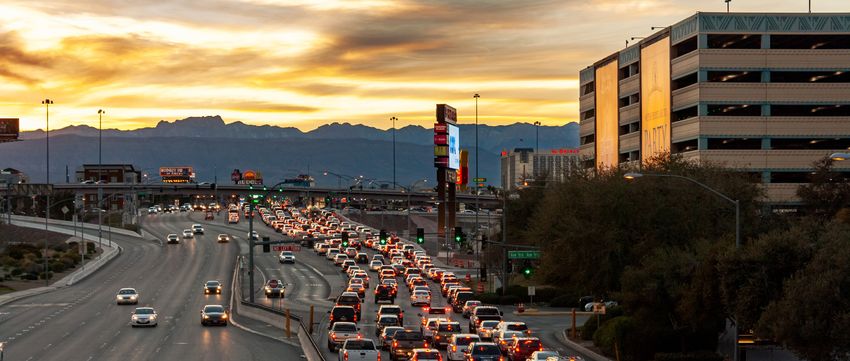
Traffic Congestion                                                           in the state brought the city’s main economic engine
                                                                             to a complete standstill, for visitors and locals alike.
Nearly half of all visitors to Las Vegas arrive by plane.
The McCarran International Airport, located in Las                           In April, there was a 33% decline in the average hours
Vegas, NV, is the main airport for the Southern Nevada                       of traffic congestion on the roads surrounding the
region. In 2019, an average of 8.6 million passengers                        Las Vegas Strip, as referenced in Figure 2, compared
passed through the airport per month. Stay-at-home                           to just two months prior.
orders and closures of non-essential businesses
caused a drop in domestic travel.                                                                           Figure 2 -
                                                                                  Difference in congestion hours between Feb 1-29 and April 1-29
                                                                                                     near the Las Vegas Strip
As a result, traffic congestion surrounding the airport
fell drastically in the month of April, as seen in Figure
1. In its entirety, there was a 40% average decrease in
hours of congestion.

                              Figure 1 -
    Difference in congestion hours between Feb 1-29 and April 1-29
               near the McCarran International Airport

                                                                             Driver Speeds
                                                                             The stay-at-home orders created vast stretches of
                                                                             largely empty roads that some drivers took advantage
                                                                             of, leading to a marked increase in speeding violations;
                                                                             a nationwide issue, reported by most major metropoli-
                                                                             tan areas from Los Angeles to New York.

The Las Vegas Strip is a stretch of roadway on South
                                                                             As part of this study, Waycare made an assessment
Las Vegas Boulevard with a high concentration of
                                                                             of speeds in the Southern Nevada Region along
resort hotels, casinos, and attractions. In 2019, an
                                                                             Interstate 15 (I-15), a major throughway that intersects
average of 42.5 million people visited Las Vegas, with
                                                                             Nevada from its origin point in Southern California to
most staying around the Strip. In addition, almost
                                                                             the terminus in Montana. Figures 3 and 4 show that
100,000 people work in the resorts along the Strip.
                                                                             there were considerable increases in speeding on
Their daily commute accounts for a large portion of
                                                                             most segments studied.
peak congestion throughout the day. The shut down -

* Findings for congestion hours are based off of anonymized reports from the public’s use of personal navigation devices. Accuracy of the data is
subjected to the amount of users.

                                                                                                                                                    4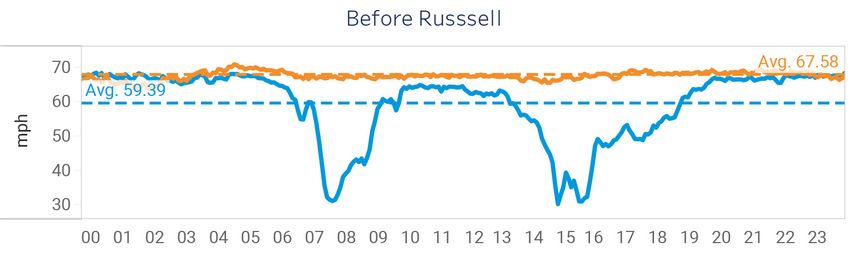
Figure 3 -
                                  Average speed per location on weekdays difference between Feb 1-Mar 11 and Mar 12-May 8

   I-15 North Bound (NB)                              I-15 North Bound (NB)                                  I-15 South Bound (SB)                              US-95 South Bound (SB)
         Segment 1                                          Segment 2

Average difference: +11.6 mph                       Average difference: -0.2 mph                          Average difference: +12.9 mph                       Average difference: +17.0 mph
           (+19.4%)                                            (-0.3%)                                               (+24.4%)                                            (+33.7%)

                                          Feb 1-Mar 11                                                                                Mar 12-May 8
          This time period was used as a baseline for comparison because it was prior to major        This time period encompasses greater overall knowledge of the COVID-19 outbreak and
            COVID-19 detections in the US and thus had relatively normal traffic conditions.                         thus stay-at-home measures and manditory closures.

                                                                                             Figure 4 -
                     Average speed per location on weekdays difference between Feb 1-Mar 11 and Mar 12-May 8 (located on I-15 NB)

                                       hours                                                                                                       hours

                         Average difference: +5.67 mph                                                                               Average difference: +8.19 mph
                                    (+10.1%)                                                                                                   (+13.79%)

                                       hours                                                                                                       hours

                        Average difference: +8.47 mph                                                                                Average difference: +0.07 mph
                                  (+15.83%)                                                                                                     (+0.1%)

                                        Feb 1-Mar 11                                                                                Mar 12-May 8
        This time period was used as a baseline for comparison because it was prior to major        This time period encompasses greater overall knowledge of the COVID-19 outbreak and
          COVID-19 detections in the US and thus had relatively normal traffic conditions.                         thus stay-at-home measures and manditory closures.

                                                                                                                                                                                              5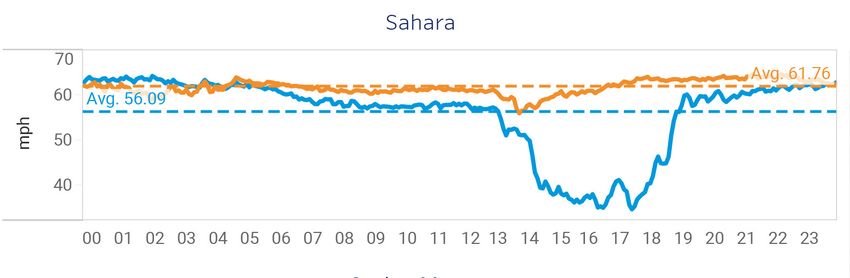
Crash Occurrences                                                                        Non-essential businesses were shuttered, including
                                                                                         casinos - a major attraction and economic engine of
Governor Steve Sislak declared a formal State of                                         the city.
Emergency for Nevada on March 12, 2020. As the
graph in Figure 5 illustrates, this began a steep                                        Once the stay-at-home order was rescinded, an
decline in the amount of crashes within the City of                                      uptick in traffic crashes was observed due to the
Las Vegas. Between March 12 and May 8, there was                                         phased reopening in the region. Subsequently, a
a 68.2% reduction in crashes compared to the same                                        considerable rise coincided with the return of opera-
month in 2019. The State of Emergency and the stay-                                      tions within the casino/gaming industry: between
at-home order dramatically curbed travel activity for                                    June 4 - June 30, there was an average of 24.61
the citizens of Nevada as well as incoming travelers.                                    crashes per day, a 28% increase compared to the
                                                                                         previous 26 days.

                                                                            Figure 5 -
                                                 Traffic Crashes Reported in City of Las Vegas from Feb 1 - Jun 30

                 Feb 1 - Mar 11                               Mar 12 - May 8                             May 9 - Jun 30
             40.8 avg crashes per day                    16.21 avg crashes per day                   21.92 avg crashes per day
         [-18.15% change from last year]              [-68.20% change from last year]           [-57.01% change from last year]

* As referenced on page 3, Phase 1 reopening included parks, restaurants, barbershops, and open air malls. Phase 2 of reopening included fitness and massage
facilities, spas, museums, galleries, and theatres.

                                                                                                                                                               6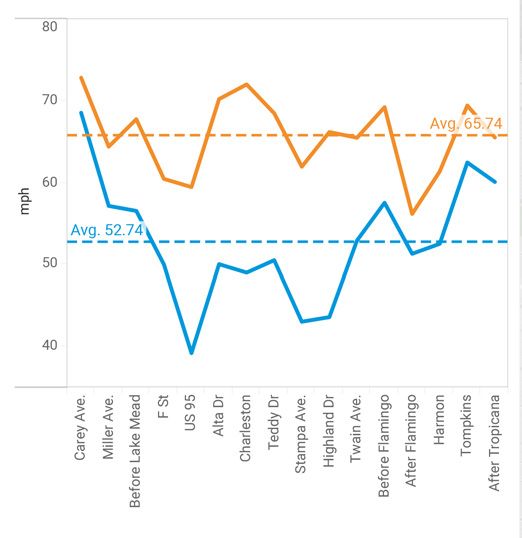
Crash Fatalities                                                Figure 7 illustrates a major increase in traffic-related
                                                                deaths reported during April 2020. While there were a
States around the U.S. reported more instances of               total of seven fatalities on Las Vegas interstates
traffic-related fatalities during the time period that          during the month of April, there was an average of two
stay-at-home orders were in effect. The loss of life            fatalities each month during the three months prior
was frequently attributed to increased rates of speed.          (January, February, March).
Waycare collected information on crashes report-
ed each month within the metropolitan limits of Las
                                                                                             Figure 7 -
Vegas, evaluating the data set for injury and fatality-              Percentage of fatalities out of the total crashes per month

related outcomes.

The majority of traffic crashes that occurred in Las
Vegas between January and June involved no injury,
as seen in Figure 6. However, there was a notable
increase in the percentage of traffic fatalities.

                                                      Figure 6 -
                      Severity in percentages of traffic crashes between January - June

                         Jan 1 - Mar 11                   Mar 12-May 8                  May 9-June 1

                                                                                                                                   7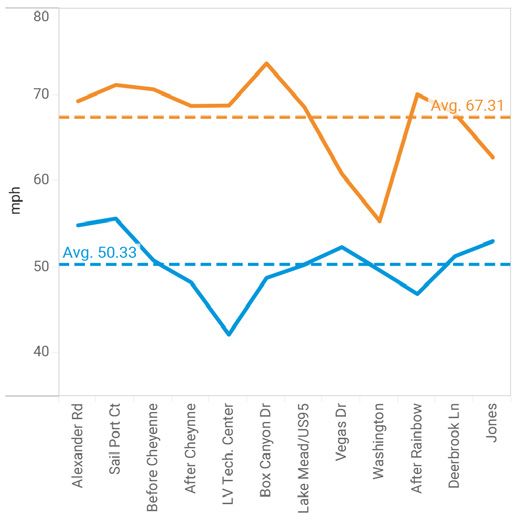
Conclusions                                               volumes. This resulted in a higher severity of the
                                                          crashes and in turn the unfortunate loss of life.
Based on the available evidence from the findings of
this study, we can make several inferences about the      The findings from this study provide a window to
course of events during this period.                      re-examine the past in order to learn valuable lessons
                                                          and develop strategies for the future. Waycare hopes
In a city that is fueled by tourism, Las Vegas felt the   that this white paper can shed light on certain areas
effects of the COVID-19 shut down acutely. While          of regional traffic performance that could use
air travel never completely halted, there was a           improvement. While the whole country makes the
severe   reduction   in   commercial    flights   since   necessary adjustments to live with this virus, it is
consumer demand fell sharply. Unsurprisingly, the         important that traffic agencies make use of detailed
stay-at-home order led to a reduction in overall          assessments and analyses such as this one to plan
congestion as there were fewer people leaving the         for a safer future on the roads.
house, except for essential activities, ergo fewer cars
on the road.

Compared to the same period a year prior, it was
demonstrated that these orders also had an impact
on crashes as well. It would be reasonable to conflate
the reduction in overall traffic volume with a decrease
in crash occurrences. It is borne out in the findings
that the number of crashes rose in conjunction with
the resumption of normal traffic volumes once the
stay-at-home orders lifted.

Less congestion and fewer crashes would also lead
one to assume these conditions would correlate with
a drop in driver fatalities. In reality, there was a
consequential rise in the rate of fatal injuries during
the shutdown period. The hidden variable that
accounts for this disparity is speed. Roads, devoid
of commuters and tourists, were practically empty.
This emboldened some drivers to exceed safe limits
since they were no longer hindered by normal traffic -

                                                                                                                   8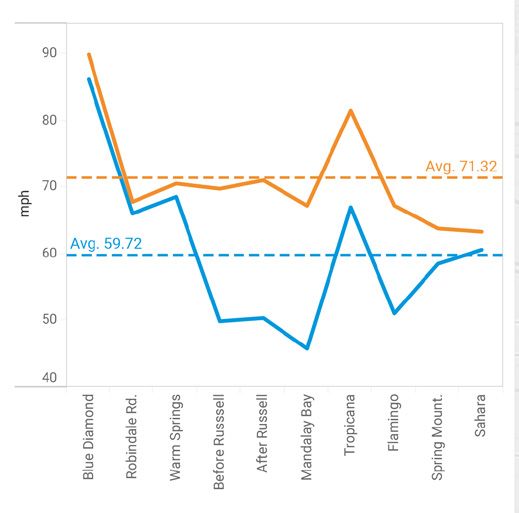
References                                                     ba4-9929-45de-90e9-6a7e41aebcd7/1400698/
                                                               2019%20Total%20Passengers.pf?t=20200129
                                                               -073400
Center for Gaming Research. (2020, February). Las
   Vegas Strip Casino Employment. https://gaming.
                                                            Mundell, EJ. & Foster, R. (2020, February 29). U.S.
   unlv.edu/reports/lvstrip_emp.pdf
                                                               Announces More Travel Restrictions as First
                                                               Coronavirus Death Reported. U.S. News & World
CDC Covid Response Team. (2020, June 4). Evidence
                                                               Report. www.usnews.com/news/health-news/
    for Limited Early Spread of COVID-19 Within the
                                                               articles/2020-02-29/3-new-us-coronavirus-
    United States, January–February 2020. www.cdc.
                                                               cases-of-unknown-origin-reported-who-ups-
    gov/mmwr/volumes/69/wr/mm6922e1.htm?s_
                                                               risk-level-to-very-high.
    cid=mm6922e1_w#discussion

                                                            Sisolak, S. (2020, April 1). DECLARATION OF EMER-
Delaney, M. (2020, May 26). Governor Sisolak
                                                               GENCY DIRECTIVE 009 (REVISED). Nevada Gov-
    Releases Prepared Remarks, Guidance for Phase
                                                               ernor Steve Sisolak. gov.nv.gov/News/Emergency
    2 Reopening, Plans Press Call. Nevada Health
                                                               _Orders/2020/2020-04-01_-_COVID-19_Declara-
    Response. nvhealthresponse. nv.gov/wp-con
                                                               tion_of_Emergency_Directive_009_(Revised)
    tent/uploads/2020/05/5.26-post-presser-re
    lease.pdf
                                                            Sisolak, S. (2020, May). Roadmap to Recovery for
                                                               Nevada. Nevada Health Response. nvhealth
Gartner, J. & Abdelsayed, A. (2020, May 16). Gov.
                                                               response.nv.gov/wp-content/uploads/2020/05/
    Sisolak Announces Nevada Phase 1 Reopening
                                                               Roadmap-to-Recovery-Phase-One-Initial-
    Starts May 9. KTNV. www.ktnv.com/news/coro
                                                               Guidance.pdf
    navirus/watch-gov-sisolak-to-announce-phase
    -1-reopening-specifics-at-3-p-m
                                                            Sun Staff. (2020, March 25). A Timeline of the
                                                               Coronavirus Crisis in Las Vegas. Las Vegas Sun.
Las Vegas Statistics, Research, and Frequently Asked
                                                               lasvegassun.com/news/2020/mar/25/a-time
    Questions. Las Vegas Convention and Visitors
                                                               line-of-the-coronavirus-crisis-in-las-vegas/
    Authority. www.lvcva.com/research/.

                                                            The White House. (2020, January 31). Proclamation
Linton, J., et al. (2020, April 6). As More Drivers Speed
                                                               on Suspension of Entry as Immigrants and
    Under COVID-19, Reynolds Calls For Speed Law
                                                               Nonimmigrants of Persons who Pose a Risk
    Reform. Streetsblog Los Angeles. la.streetsblog.
                                                               of Transmitting 2019 Novel Coronavirus. https://
    org/2020/04/06/as-more-drivers-speed-under-
                                                               www.whitehouse.gov/presidential-actions/
    covid-19-reynolds-calls-for-speed-law-reform/.
                                                               proclamation-suspension-entry-immigrants-
                                                               nonimmigrants-persons-pose-risk-transmit
McCarran International Airport. (2020, January 27).
                                                               ting-2019-novel-coronavirus/
    2019 Statist ics - Enplaned and Deplaned
    Passengers. www.mccarran.com/pubfile/9a33a

                                                                                                                  9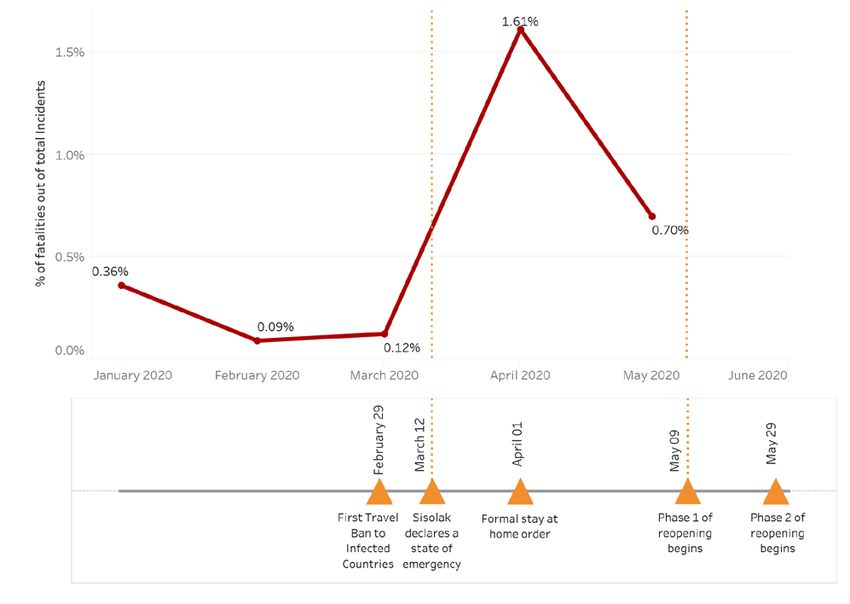
You can also read