WHO GLOBAL REPORT
ON SODIUM INTAKE REDUCTION
←
→
Page content transcription
If your browser does not render page correctly, please read the page content below

WHO GLOBAL REPORT
ON SODIUM INTAKE REDUCTION

WHO GLOBAL REPORT ON SODIUM INTAKE REDUCTION

WHO global report on sodium intake reduction

ISBN 978-92-4-006998-5 (electronic version)
ISBN 978-92-4-006999-2 (print version)

© World Health Organization 2023

Some rights reserved. This work is available under the Creative Commons Attribution-NonCommercial-ShareAlike 3.0 IGO licence
(CC BY-NC-SA 3.0 IGO; https://creativecommons.org/licenses/by-nc-sa/3.0/igo).

Under the terms of this licence, you may copy, redistribute and adapt the work for non-commercial purposes, provided the work
is appropriately cited, as indicated below. In any use of this work, there should be no suggestion that WHO endorses any specific
organization, products or services. The use of the WHO logo is not permitted. If you adapt the work, then you must license your
work under the same or equivalent Creative Commons licence. If you create a translation of this work, you should add the following
disclaimer along with the suggested citation: “This translation was not created by the World Health Organization (WHO). WHO is not
responsible for the content or accuracy of this translation. The original English edition shall be the binding and authentic edition”.

Any mediation relating to disputes arising under the licence shall be conducted in accordance with the mediation rules of the
World Intellectual Property Organization (http://www.wipo.int/amc/en/mediation/rules/).

Suggested citation. WHO global report on sodium intake reduction. Geneva: World Health Organization; 2023.
Licence: CC BY-NC-SA 3.0 IGO.

Cataloguing-in-Publication (CIP) data. CIP data are available at http://apps.who.int/iris.

Sales, rights and licensing. To purchase WHO publications, see https://www.who.int/publications/book-orders. To submit
requests for commercial use and queries on rights and licensing, see https://www.who.int/copyright.

Third-party materials. If you wish to reuse material from this work that is attributed to a third party, such as tables, figures or
images, it is your responsibility to determine whether permission is needed for that reuse and to obtain permission from the
copyright holder. The risk of claims resulting from infringement of any third-party-owned component in the work rests solely with
the user.

General disclaimers. The designations employed and the presentation of the material in this publication do not imply the
expression of any opinion whatsoever on the part of WHO concerning the legal status of any country, territory, city or area
or of its authorities, or concerning the delimitation of its frontiers or boundaries. Dotted and dashed lines on maps represent
approximate border lines for which there may not yet be full agreement

The mention of specific companies or of certain manufacturers’ products does not imply that they are endorsed or recommended
by WHO in preference to others of a similar nature that are not mentioned. Errors and omissions excepted, the names of proprietary
products are distinguished by initial capital letters.

All reasonable precautions have been taken by WHO to verify the information contained in this publication. However, the published
material is being distributed without warranty of any kind, either expressed or implied. The responsibility for the interpretation and
use of the material lies with the reader. In no event shall WHO be liable for damages arising from its use.

Design and layout: Alberto March
Contents
Acknowledgements                                                                                                         v
Abbreviations                                                                                                           vi
Foreword                                                                                                               vii
Executive summary                                                                                                      viii
Scope and purpose                                                                                                       ix
Background                                                                                                               1
   WHO guideline: sodium intake for adults and children                                                                  2
   Member State commitments to the prevention and control of noncommunicable diseases                                    3
Methods                                                                                                                  5
   Implementation of sodium reduction policies and measures                                                              6
   Sodium Country Score Card                                                                                             6
   Population dietary sodium intake                                                                                      8
   Modelled health impact of sodium reduction policies and measures                                                      8
Results                                                                                                                11
   Implementation of sodium reduction policies and measures                                                            12
     National policy commitments                                                                                       12
     Measures to reduce sodium in the food supply or encourage consumers to make healthier food choices about sodium   13
          Reformulation to reduce sodium content across the food supply                                                15
          Public food procurement and service policies                                                                 19
          Nutrition labelling                                                                                          21
          Mass media campaigns                                                                                         27
          Marketing restrictions                                                                                       29
          Fiscal policies                                                                                              31
   Sodium Country Score Card                                                                                           33
     Sodium Country Score Cards: African Region                                                                        35
     Sodium Country Score Cards: Region of the Americas                                                                36
     Sodium Country Score Cards: Eastern Mediterranean Region                                                          37
     Sodium Country Score Cards: European Region                                                                       38
     Sodium Country Score Cards: South-East Asia Region                                                                39
     Sodium Country Score Cards: Western Pacific Region                                                                40
   Population dietary sodium intake                                                                                    41
   Modelled health impact of sodium reduction policies and measures                                                    42
     Impact of policies and measures on sodium intake                                                                  42
      Impact of policies and measures on cardiovascular disease                                                        42
The way forward                                                                                                        43
References                                                                                                             46
Annexes                                                                                                                53
   Annex 1: Sodium intake, sodium country score, policies and measures in WHO Member States                            54
   Annex 2: Details of sodium reduction policies and measures implemented around the world                             70
   Annex 3: Overview of mandatory and voluntary measures by WHO region                                                 87
   Annex 4: Overview of mandatory and voluntary measures by World Bank income group                                    90

                                                                                                                          iii
Acknowledgements

T
    his report was developed by Ms Kaia Engesveen, Ms Allison Goldstein, Dr Mary-Anne Land and Ms Camilla
    Haugstveit Warren under the coordination of Dr Luz Maria De-Regil, Multisectoral Action in Food Systems Unit,
    Department of Nutrition and Food Safety, World Health Organization (WHO).

The valuable technical contributions from colleagues across WHO are recognized: Dr Ayoub Al-Jawaldeh, Dr Lorena
Allemandi, Dr Hana Bekele, Dr Elaine Borghi, Dr Francesco Branca, Ms Melanie Cowan, Dr Angela De Silva, Mr Fabio
Da Silva Gomes, Dr Katrin Engelhardt, Ms Eman Ibrahim, Dr Luc Ingenbleek, Dr Lucero Lopez-Perez, Ms Fabienne
Maertens, Mr Eugene Mahlehla, Ms Nashwa Mansour, Dr Ricardo X. Martinez, Mr Leendert Nederveen, Dr Chizuru
Nishida, Ms Pyi Pyi Phyo, Ms Leanne Riley, Dr Juliawati Untoro, Ms Laura Utemissova, Mr Stephen Whiting, Dr Kremlin
Wickramasinghe and Dr Rain Yamamoto. Also recognized are the WHO Nigeria noncommunicable disease team
through Dr Kelias Phiri Msyamboza and the WHO Country Office of Sri Lanka.

WHO also recognizes the valuable contributions made by Ms Simone Bosch, Dr Laura Cobb, Dr Renu Garg, Ms Nicole Ide
(Resolve to Save Lives) and Mr Aaron Schwid (Vital Strategies), Ms Mhairi Brown (World Action on Salt, Sugar and Health),
Dr Marieke Hendriksen (WHO Collaborating Centre for Nutrition), Dr Megan E. Henry (Johns Hopkins Bloomberg School
of Public Health), Dr Kathy Trieu and Professor Jacqui Webster (WHO Collaborating Centre on Population Salt Reduction),
Professor Jason Wu (Nutrition Science Program, The George Institute for Global Health), Professor Peter Scarborough
(Nuffield Department of Population Health, University of Oxford), Professor Chantal Julia (Équipe de Recherche en
Épidémilogie Nutritionnelle), Dr Eszter Sarkadi-Nagy (National Insitute of Pharmacy and Nutrition, Hungary), Ms
Stephanise Desnousse, Ms Judy Jean-Baptise and Ms Vereine Louis-Marie (Ministry of Health Seychelles), and colleagues
from the Ministry of Health of Sri Lanka.

All Member States are acknowledged for the actions taken to reduce population sodium intake.

Financial support
WHO is grateful for the financial support to develop this report from the Government of Sweden and Resolve to Save
Lives.

                                                                                                                        v
abbreviations
HIC     high-income countries

LIC     low-income countries

LMC     lower-middle income countries

ND      not determined

UMC     upper-middle income countries

vi    WHO GLOBAL REPORT ON SODIUM INTAKE REDUCTION

Foreword

S
     odium reduction plays a key role in protecting populations from the burden of noncommunicable diseases,
     namely, cardiovascular disease which is the number one cause of death and disability globally. The evidence
     is clear: the more sodium we consume the more our blood pressure rises, and blood pressure is reduced when
dietary sodium intake is reduced. Reducing sodium intake is one of the most cost-effective ways to improve health, as
it can avert millions of deaths every year at very low total programme costs.

On average, we consume over 4000 mg of sodium every day, which is double the amount recommended by WHO. In
2013 all 194 WHO Member States committed to reducing population sodium intake by 30% by the year 2025. Since
then, progress has been slow and only a few countries have been able to reduce population sodium intake, but no
one has been able to achieve the target. As such, it is being considered to extend the target to 2030.

We can reduce sodium intake by deciding to add less salt to the food we prepare and by deciding to buy foods
that contain less sodium. People’s behaviour change is important, and mass media campaigns to alter consumer
behaviour around sodium are needed. However, several public policies need to make this choice an easier one. Food
manufacturers need to reduce sodium content in food products; products with high sodium content need to be easy
to identify through front-of-pack labelling; meals offered in public institutions such as schools, hospitals, and public
offices should contain less sodium. If the WHO recommended policies were implemented, we would see sodium
consumption reduced by over 20%, getting close to the target set in 2013.

The report shows which countries have adopted and implemented sodium reduction policies and is meant to
encourage bolder action from a larger number of countries.

WHO will support these efforts with new and better tools, innovative approaches, advocacy initiatives and technical
assistance. We can build on the success stories of the few countries who have managed to achieve a decrease of
population intake of sodium.

In many high-income countries, and increasingly in low- and middle-income countries,
a significant proportion of sodium intake can be attributed to processed food. In 2022
WHO developed benchmarks for sodium content in 18 food categories and called on
food operators to implement them globally. The benchmarks are based on real life
experiences, so that their implementation is safe and technologically feasible. Some of the
large food manufacturers have committed to make steps to achieve those benchmarks,
but again bolder action and engagement from more actors is needed to see measurable
public health impact.

WHO has long been monitoring and reporting on the adoption, implementation, and
impact of policies to reduce sodium. We will continue to do so and will establish a
mechanism to monitor the implementation of the commitments of food operators.

Implementing WHO recommended sodium intake reduction policies may save over
two million deaths by 2025 and seven million by 2030. We cannot fail this completely          Dr Francesco Branca, MD, PhD
achievable and affordable public health goal!                                                 Director, Department of Nutrition and
                                                                                              Food Safety, World Health Organization

                                                                                                                                vii
Executive Summary

  T
       he global burden of unhealthy diets constitutes a major public health and development challenge worldwide.
       Urgent action is required to modify the production and consumption of foods and beverages, including
       industry manufactured (pre-packaged) food. Of greatest concern is excess consumption of sodium, sugars and
  unhealthy fats, particularly trans-fatty acids (trans fats) and saturated fatty acids, and low consumption of whole
  grains, pulses, vegetables, and fruits.

  The largest number of diet-related deaths, an estimated 1.89 million each year, is associated with excessive intake
  of sodium, a well-established cause of raised blood pressure and increased risk of cardiovascular disease. The global
  average sodium intake is estimated to be 4310 mg/day (10.78 g of salt per day), which far exceeds the physiological
  requirement and is more than double the World Health Organization (WHO) recommendation of
Scope and purpose

T
      he World Health Organization (WHO) has developed this report to monitor progress and identify areas for action
      in the implementation of sodium reduction policies and other measures within Member States and across
      WHO regions and World Bank income groups. For the first time, a Sodium Country Score from 1 (the lowest
level) to 4 (the highest level) is allocated to each Member State based on the level of implementation of sodium
reduction policies and other measures. The Sodium Country Score is used to estimate the impact of policy progress
on population dietary sodium intake and cardiovascular disease.

                                                                                                                  ix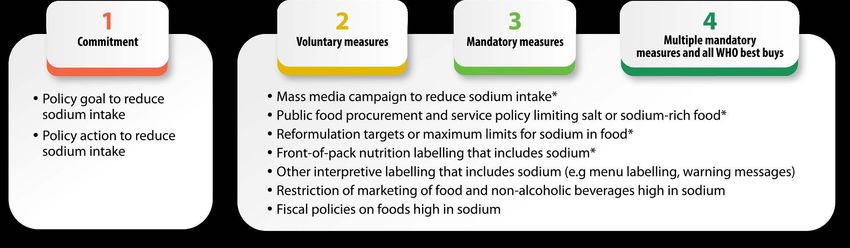
© PeopleImages

                 BACKGROUND
BACKGROUND
A
n estimated 1.89 million deaths each year are associated with excessive sodium intake (1), a well-established
cause of raised blood pressure and increased risk of cardiovascular disease (2-4). Reducing sodium intake
is one of the most cost-effective ways to improve health and reduce the burden of noncommunicable
diseases, as it can avert a large number of cardiovascular events and deaths at very low total programme costs.
WHO recommends several sodium-related best buys policies and other measures as practical actions that should
be undertaken immediately, to prevent cardiovascular disease and its associated costs (5). These include lowering
of sodium content in food products; implementing front-of-pack labelling to help consumers select food products
with lower sodium content; conducting mass media campaigns to alter consumer behaviour around sodium; and
implementing public food procurement and service policies to reduce sodium content in food served and sold.
National nutrition and/or noncommunicable disease prevention and control policies help to catalyse and integrate
regulatory, legislative and multisectoral actions across health and other health relevant sectors. The development,
implementation and monitoring and evaluation of sodium reduction policies should be government-led and
safeguarded against possible conflicts of interest.
WHO guideline: Sodium intake for adults and children
Sodium is an essential nutrient involved in the maintenance of normal cellular homeostasis, and in the regulation of
fluid and electrolyte balance. It is crucial for maintaining extracellular fluid volume because of its osmotic action; and it is
equally important for muscle and nerve cell function, and for the transport of nutrients through plasma membranes (6).
Sodium deficiency is extremely unlikely in healthy individuals (7); the minimum intake level required for physiological
needs is not well established although it is estimated to beMember State commitments to the prevention and control of noncommunicable diseases
2011
Member States committed to reducing exposure to unhealthy diets. The commitment was made
through a Political Declaration of the High-level Meeting of the United Nations General Assembly
on the Prevention and Control of Noncommunicable Diseases (17).
2013
Member States adopted the Global Action Plan for the Prevention and Control of
Noncommunicable Diseases 2013–2020 (18) to take coordinated action at all levels to attain
nine voluntary global targets, including:
• 30% relative reduction in mean population sodium intake by 2025, with a goal of© monkeybusinessimages
METHODS
5METHODS
T
his report uses several data sources and models to determine population dietary sodium intake, country-based
policy implementation and corresponding score, and the policy impact on sodium intake and cardiovascular
disease.
Implementation of sodium reduction policies and measures
Data on policy implementation were obtained from the WHO Global database on the Implementation of Nutrition
Action (GINA) (20). This database includes WHO policy surveys focusing on nutrition (21), noncommunicable diseases
(22) and related databases (23), a number of WHO reports at the global (24) or regional level (25-35), as well as the
results of ongoing monitoring by the WHO team through its regional and country networks and systematic searches
on government websites. These data cover all Member States, thus, in the report, the denominator for overall policy
implementation is n = 194. Additional information on Member State policy status was sourced from relevant partner
databases (36-38) and reports (39), and from recent peer-reviewed papers (40-45).
For each relevant national policy or action identified, the national document was obtained through searches of
government websites or legislative compilations, and analysed for potential inclusion in GINA–that is, whether it
contained specific goals, strategies, or measures to reduce sodium intake. Relevant documents were added to GINA
with basic reference information about the title, government agency publishing the document, date of publishing, date
of going into effect, adoption status, and the document and/or the link to the document on the government website. In
addition, an extract of key sections was included in the document’s original language and the document was catalogued
in GINA using taxonomy topics for different healthy diet policies and sodium reduction measures. Where there were
doubts around relevance or status, a team discussion occurred. As needed, additional information was sought to find
evidence of adoption or implementation (for example, from consulting media articles), that reformulation targets were
launched (for example, from government reports or meeting minutes), to check whether school food standards were
initiated (for example, from school policies and government reports) and to verify that a front-of-pack labelling system
is in use (for example, from online food shops in the country).
This data scoping and analysis was completed for all Member States indiscriminately. Additional searches on
government websites were performed for countries with no information regarding sodium reduction policies.
These data set out the overarching status of implemented sodium reduction policies and other measures.
Sodium Country Score Card
The policy information described above was used to develop a Sodium Country Score Card. It assesses country
implementation of sodium reduction policies and other measures (both voluntary and mandatory), allocating a score
from 1 (the lowest level of implementation) to 4 (the highest level of implementation).
The Sodium Country Score Card assesses policies and other measures, and assigns the highest score obtained as follows:
• Score 1 - a national policy commitment towards sodium reduction
• Score 2 - voluntary measures implemented to reduce sodium in the food supply or encourage consumers to make
healthier food choices These measures would be considered if upper-level thresholds for sodium have been set in an
underlying nutrient profile model (for example, a quantified limit for the maximum permissible amount of sodium
in food served in schools), or if consumer behaviour is specifically targeted in relation to sodium (for example,
prohibition on saltshakers in food service areas).
• Score 3 - mandatory measures implemented to reduce sodium and use a nutrient profile model to effectively
implement measures. Declaration of sodium on all pre-packaged food is mandatory.
• Score 4 - at least two mandatory measures to reduce sodium, mandatory sodium declaration on all pre-packaged
food, and at the same time all four WHO sodium-related best buys (Figure 1).
6 WHO GLOBAL REPORT ON SODIUM INTAKE REDUCTIONFigure 1. Sodium Country Score Card Criteria
* WHO best buys for reducing noncommunicable diseases through reducing sodium intake
It should be noted that the Sodium Country Score Card algorithm does not differentiate between key aspects of
the policies and other measures, such as the number of food categories with a sodium content limit. For example,
one country may have implemented voluntary reformulation targets for sodium content in processed food for a
large number of food categories and is assessed as score 2, while another country implements mandatory sodium
content limit on one food category only and yet this country is potentially assessed as score 3 or 4. Similarly, the
scoring algorithm does not take into account the type of front-of-pack labelling system, the number of channels
or age range of children covered by the marketing restrictions, or the types of settings or food categories covered
by the public food procurement and service policies. Finally, the data also include country reports on mass media
campaigns, but information on the frequency, duration and reach of the mass media campaigns is not frequently
known or evaluated.
The assessment of measures in the Sodium Country Score Card is based on the pathway countries may take from
making a policy commitment to address a problem at (the first level), up to having at least two mandatory policies and
other measures plus implementation of all best buys (the highest level), as comprehensive government-led mandatory
policies and other measures are generally considered more effective (46) and have a history of being ineffective unless
they are coupled with strong government oversight and close monitoring (47). While there are several examples of
effective city-level action (48, 49) to reduce sodium intake, the Sodium Country Score Card mainly focuses on national
programmes and therefore does not comprehensively consider stand-alone city initiatives.
METHODS 7Population dietary sodium intake
Estimates for mean population sodium intake were calculated by the Institute for Health Metrics and Evaluation (1).
The data can be readily accessed through the WHO Noncommunicable Disease Data Portal, which provides access to
detailed information on noncommunicable diseases and their risk factors (50). It should be noted that the Institute for
Health Metrics and Evaluation data is not without limitations, given there is no comprehensive reporting of population
sodium intake.
Modelled health impact of sodium reduction policies and measures
A model was created to estimate the impact of uplifting the score of countries in the Sodium Country Score Card
as a result of implementing new mandatory or voluntary policies and other measures, on mean population sodium
intake, and in turn on cardiovascular disease outcomes. The baseline scenario was set to 2019, the year of the most
recently available sodium intake estimates, and the hypothetical scenario estimated for the two end-points of 2025
and 2030 (corresponding to the sodium reduction target of 30% by 2025, now under consideration for extension to
2030) (Figure 2).
Figure 2. Framework for estimated changes in sodium intake and cardiovascular disease based on policy
implementation
Global Baseline Hypothetical Hypothetical
Noncommunicable Diseases point end-point 1 end-point 2
Action Plan
2013 2019 2025 2030
Hypothetical
scenario score uplift
Po licy uplift
Policy and scores:
Policy baseline scenario
Sodium intake Sodium intake
Policy baseline scenario reduction scenario 1 reduction scenario 2
Sodium intake:
Policy uplift scenario
Health impact: Averted deaths in 2025 Averted deaths in 2030
In the baseline scenario, it was assumed that no Member State implemented any new policy or other measure and
thus had no score uplift. The rate of change in sodium intake was calculated using the current average annual rate of
reduction in individual Member States, based on the available data as of 2019, and projecting intake until 2025 or 2030.
In the hypothetical scenario, each Member State was uplifted two scores or, if already at score 3 or 4 in the
baseline year, achieved or sustained the highest score 4. The effect of score uplifts or sustaining a score 4
on sodium intake was calculated using effect sizes for mandatory and voluntary policies used in a previous
modelling. The effect sizes for mandatory and voluntary measures – an inherent feature of the Sodium Country
Score Card – were considered to be in line with ongoing work by WHO to update the best buys (51), systematic
reviews (52) modelling studies (53, 54), and documented country impact of multicomponent interventions (55, 56).
8 WHO GLOBAL REPORT ON SODIUM INTAKE REDUCTIONThe following effect sizes were used to estimate the impact of policy progress on sodium intake over an 11-year
period from 2019 to 2030, where recording the estimated effect on intakes in 2025 from the 2030 projection was
used as the estimated effect for that end-point.
• Uplift from no score to score 2 = 15% (based on voluntary reformulation)
• Uplift from score 1 to score 3 = 20% (based on mandatory reformulation)
• Uplift from score 2 or 3 to score 4 = 25% (a composite value based on reformulation,
procurement, and front-of-pack labelling).
The corresponding health impact of reduced sodium intake on the number of deaths from cardiovascular diseases
resulting from the effect of the hypothetical uplifts in score compared with the baseline projected intake was
calculated for each Member State using the Noncommunicable diseases Preventive Risk Integrated ModEl (NCD
prime) (57), based on the population attributable framework (58). The default parameters of NCD prime were updated
to a reduction in 100 mmol/day in 24-hour urinary sodium excretion of an associated reduction in systolic blood
pressure of 5.56 mmHg as reported by Filippini et al 2021 (2) and in line with the updating of Appendix 3 of the WHO
Global Action Plan for the Prevention and Control of Noncommunicable Diseases 2013–2030 analysis (51).
It should be noted that the estimated effect size was applied to each Member State, despite known differences in
the major sources of sodium in each population, therefore, it is likely that Member States with a higher discretionary
sodium intake (salt added to food during cooking and/or at the table) may have a lower estimated reduction in
dietary intake, and fewer cardiovascular deaths averted in 2025 and 2030. The estimated effect sizes were also applied
to Member States, regardless of existing policies and measures.
METHODS 9© vasiliybudarin
RESULTSresults
D
ata on population dietary sodium intake, and country-based sodium reduction policies and other measures
implemented are presented for all 194 WHO Member States. Also presented are the scores assessed through
the Sodium Country Score Card (Annex 1), and the policies on sodium intake and cardiovascular disease.
Implementation of sodium reduction policies and measures
National policy commitment
National nutrition and/or noncommunicable disease prevention and control policies help to catalyse and integrate
legislative and multisectoral measures across food, health and other health-relevant sectors. The development,
implementation, and monitoring and evaluation of sodium reduction policies should be government-led and
safeguarded against possible conflicts of interest (59).
Of the 194 Member States, 79% (n = 154) have a policy commitment towards sodium reduction (Figure 3). There
is little variation across WHO regions, however, low-income countries less frequently have stated sodium reduction
commitments. Of the Member States, 56 remain in score 1 in the Sodium Country Score Card, without further measures
implemented in the WHO African Region and among low-income countries, whereas 98 implement either voluntary,
or mandatory policies and other measures, and are scored higher. Just under half of these Member States had already
made a sodium reduction policy commitment by 2013, the year of the WHO Global Action Plan for the Prevention and
Control of Noncommunicable Diseases and the global sodium reduction target. Box 1 describes setting of national
policy targets and actions in Nigeria.
Figure 3. Proportion of Member States with a policy commitment to reduce sodium intake by WHO region,
and World Bank income group
100
89 27 85
77 78 83
100% 74 31 79
71 73 38
90% 11 26 27
55 57 12
14 47
80% 66 52 56
19 64 67
70% 57
50
60%
50% 14
40%
30%
20%
10%
0%
AFR AMR EMR EUR SEAR WPR LIC LMC UMC HIC
(n = 47) (n = 35) (n = 21) (n = 53) (n = 11) (n = 27) (n = 28) (n = 53) (n = 52) (n = 58)
Member States in scores 2, 3 or 4 Member States in score 1
AFR: African Region; AMR: Region of the Americas; EMR: Eastern Mediterranean Region; EUR: European Region; SEAR: South-East Asia Region;
WPR: Western Pacific Region
12 WHO GLOBAL REPORT ON SODIUM INTAKE REDUCTIONBox 1. National policy commitment — Nigeria
In 2013, the National Policy and Strategic Plan of Action on Prevention and Control of Non-Communicable
Diseases was established, with the objective to reduce sodium intake (60). In 2019, the National Multi-sectoral
Action Plan for the Prevention and Control of Non-Communicable Diseases (2019-2025) was launched (61). This
plan clearly identifies unhealthy diet as a risk factor for noncommunicable diseases, and notes that, anecdotally,
food consumption patterns in Nigeria are changing rapidly towards the consumption of processed foods high
in sodium. The target set for sodium reduction is at least a 30% relative reduction in mean population intake of
sodium. The proposed actions to achieve this target include reformulation of processed food products to contain
less salt, setting maximum target levels for sodium content in processed foods and standards for front-of-pack
labelling. These actions will be supported by the implementation of nutrition education and counselling, mass
media and behaviour change campaigns on healthy diets, including social marketing to reduce sodium and
promote the intake of fruits and vegetables.
The commitments towards sodium reduction set targets for reduced population sodium intake and/or describe the
approach government will take to achieve this target. These commitments are typically expressed in national nutrition
plans (n = 82), noncommunicable disease plans (n = 94) or health sector plans (n = 40). Three Member States have
incorporated sodium reduction commitments into multisectoral development plans (Indonesia, Islamic Republic of
Iran and Türkiye), and one Member State has incorporated sodium reduction commitments into a food sector plan
(Mongolia). About a third of the Member States (37%) had sodium reduction commitments expressed in more than
one policy type (Annex 2, Table A2.1).
Measures to reduce sodium in the food supply or encourage consumers to make healthier food choices
about sodium
WHO has identified a set of evidence-based best buy interventions to tackle noncommunicable diseases that should
be undertaken immediately, with expected accelerated results in terms of lives saved, healthy life-years gained, cases of
disease prevented, and costs avoided.
These aim to reduce sodium intake through:
• reducing sodium content in a food supply (reformulation of processed/manufactured food);
• reducing sodium in meals or snacks consumed outside of the home (public food procurement and service policies);
• encouraging consumers to make healthier choices related to sodium through information (media campaigns,
front-of-pack or other interpretive nutrition labelling, menu labelling or removal of saltshakers in food service
areas) and absence of negative influence (restricting marketing of food high in sodium).
These policies and other measures are mutually reinforcing. As the number of policies and other measures
implemented increases, there is a compound increase in immediate benefits. However, a single policy or measure
can be implemented based on the resources available, and built upon with additional complementary policies
and measures over time; they may also have an unintended effect. For instance, setting specific thresholds for, the
maximum permissible amount of sodium in a food product in order to bear or not bear a label, may encourage
reformulation of the product to reduce its sodium content.
Generally, mandatory policies, whether expressed in legislation or other government guidance, are more likely to
achieve impact because they have higher coverage and set a level playing field across the food manufacturing sector
where all companies abide by the same limits and rules. Mandatory policies create a food environment that restricts
or demotes the least healthy food options regardless of where food is served or sold.
RESULTS 13Of the 194 Member States, 55% (n = 119) have implemented sodium reduction policies and other measures through
mandatory (5%; n = 9), mandatory and voluntary (27%; n = 53) or voluntary (29%; n = 57) approaches (Figure 4). The
most implemented sodium reduction measure is voluntary media campaigns (49%; n = 96), followed by reformulation
(34%; n = 65) and public food procurement and service policies that are both mandatory and voluntary (Figure 4).
There are significant regional discrepancies in implementation of measures and use of voluntary versus mandatory
policies (Annex 3), and a consistent tendency for these measures to be more frequently implemented the higher the
income group (Annex 4).
Figure 4. Proportion of Member States implementing mandatory and/or voluntary sodium reduction policies
and other measures
100%
90%
61
80%
29
70% 27
5 34
60% 49
20 29
50% 49
3 7 21
3 14 13
40% 11
19 1 3
30%
6 1
3
20% 9
1
1
10% 2 1
0%
Any voluntary Reformulation Public food Front-of-pack Other Mass media Fiscal policies Marketing
or mandatory procurement labelling interpretative campaigns restrictions
measure and service nutrition labelling
Mandatory Mandatory and voluntary Voluntary
14 WHO GLOBAL REPORT ON SODIUM INTAKE REDUCTIONReformulation to reduce sodium content across the food supply
An effective way to reduce population sodium intake is through lowering the sodium content of foods that are
consumed frequently (24, 62). In many high-income countries, and increasingly in low- and middle-income countries,
a significant proportion of sodium in the diet comes from processed foods such as bread, cereal and grains, processed
meats, and dairy products (63).
Mandatory maximum limits for sodium in processed foods promote industry-wide reformulation. It creates a
marketplace that restricts the least healthy food options regardless of where people shop or how much they understand
(or have access to) information on labels. This type of policy requires no consumer action and places the burden to avoid
manufacturing less healthy products on the food industry.
Of the 194 Member States, 34% (n = 65) have implemented policies to reformulate manufactured food to contain less
sodium through mandatory (11%; n = 21), mandatory and voluntary (3%; n = 6), or voluntary (20%; n = 38) approaches
(Figure 5 and Annex 2, Table A2.2). Reformulation is most commonly implemented in the WHO Eastern Mediterranean
and European regions, and is more common in the higher the income group. The first reformulation policies date back
to the 1980s when some Member States introduced maximum permissible limits of sodium in bread, tomato sauces or
peanut butter. About half of the Member States with mandatory or voluntary sodium reduction reformulation policies
had introduced these by 2013, when the WHO Global Action Plan for the Prevention and Control of Noncommunicable
Diseases, which recommended reducing sodium in the food supply, was launched.
Figure 5. Proportion of Member States implementing mandatory and/or voluntary reformulation policies to
reduce sodium content in food by WHO region, and World Bank income group
100% 65
90% 58 43
48 30 10
80%
19 9 12
70%
5 19
60% 36
33
29 24 15
50% 26
23 21
40% 7 15
6
6 18 9
30%
2 18
6
20%
4
10%
0% 0%
0
0%
AFR AMR EMR EUR SEAR WPR LIC LMC UMC HIC
(n = 47) (n = 35) (n = 21) (n = 53) (n = 11) (n = 27) (n = 28) (n = 53) (n = 52) (n = 58)
Mandatory Mandatory and voluntary Voluntary
AFR: African Region; AMR: Region of the Americas; EMR: Eastern Mediterranean Region; EUR: European Region; SEAR: South-East Asia Region;
WPR: Western Pacific Region
RESULTS 15The variation of sodium content in manufactured food offers a significant opportunity for sodium reduction through
reformulation and demonstrates that reducing sodium in processed food is possible, as demonstrated by the WHO
global sodium benchmarks (24). It is likely that reformulation of processed foods and beverages will generate the greatest
impact in reducing the consumption of sodium, particularly in countries where these foods are commonly consumed.
Across the implemented reformulation policies in Member States, bread and bread products are the most targeted
food category for sodium reduction, followed by processed meat, poultry, game or fish; ready-made and convenience
foods and composite dishes; and savoury snacks (Figure 6).
Figure 6. Number of Member States targeting different food categories through mandatory and/or voluntary
reformulation policies to reduce sodium content in food2
Chocolate and sugar confectionery,
energy bars, and sweet toppings 2 4 6
and desserts
Cakes, sweet biscuits and pastries;
other sweet bakery wares; and 6 12 18
dry-mixes for making such
Savoury snacks 5 16 21
Beverages 1 3 4
Breakfast cereals 1 12 13
Yoghurt, sour milk, cream and
other similar foods 1 2 3
Cheese 4 10 14
Ready-made and convenience 8 15 23
foods and composite dishes
Butter and other fats and oils 4 9 13
Bread, bread products and 19 2 21 43
crisp breads
Fresh or dried pasta, noodles,
rice and grains 1 5 6
Fresh and frozen meat, poultry,
game, fish and similar 3 3
Processedmeat, poultry, 11 15 26
game, fish and similar
Processed fruit, vegetables and
legumes 5 10 15
Plant-based food/meat analogues 4 4
Sauces, dips and dressings 4 14 18
0 5 10 15 20 25 30 35 40 45
Number of Member States Mandatory Mandatory and voluntary Voluntary
2 The food groups are based on the 18 food categories identified in the WHO Global sodium benchmarks (24) where all but two of the food groups (edible ices; fresh
and frozen fruit, vegetables and legumes) had at least one mandatory limit or voluntary target set. Three Member States (Czechia, France and Ireland) have voluntary
reformulation targets that do not specify food categories and are not included in this graph.
16 WHO GLOBAL REPORT ON SODIUM INTAKE REDUCTIONMandatory limits are typically set on a smaller number of food categories, with only four Member States (Argentina,
Islamic Republic of Iran, Slovakia, and South Africa) setting such limits for five or more food categories (Figure 7).
Boxes 2–4 describe different approaches to reformulation.
Figure 7. Number of Member States targeting different number of food categories through mandatory and/or
voluntary reformulation policies to reduce sodium content in food
16
6
1
18 9
16
14
Number of Member States
12
10 6 5
6 4
8 1 3
6 3 2 4
4 2
6 4
1 2 2 1 2
4 1 1
2 2 1 2
1 1
2
0
1 2 3 4 5 6 7 8 9 10 11 12
Number of food categories
Mandatory Mandatory and voluntary Voluntary
Box 2. Reformulation to reduce sodium content across the food supply — Saudi Arabia (mandatory)
In 2018, with the aim of reducing sodium content in food items, the Saudi Food and Drug Authority enforced
a limit of 1 g of salt/100 g for breads (64) and salted yoghurts drinks on manufacturers. This regulation was
followed by a salt guide (65) from the Saudi Food and Drug Authority inviting food manufacturers to abide by
limits for sodium content for 22 processed food items.
Box 3. Reformulation to reduce sodium content across the food supply — Australia (voluntary)
The Healthy Food Partnership (66) was established by the Government of Australia in 2015. The aim is to improve
the dietary habits of Australians by making healthier food choices easier and more accessible, and by raising
awareness of appropriate food choices and portion sizes. The programme, which defines and sets voluntary
maximum sodium targets for 27 food categories was rolled out in 2020 and expanded in 2021 to include an
additional three food categories (66). As an example, the target for maximum sodium content in leavened
breads is 380 mg/100 g, to be met by June 2024. These targets cover 80% of the categories, by sales volume, for
participating businesses. The first of six progress reports is scheduled in June 2022. Early modelling indicates
that this voluntary approach is limited by the number of categories and adherence to targets, and that for
significant sodium reduction, government-led mandatory reformulation implemented across the manufactured
food supply is required (67).
RESULTS 17Box 4. Reformulation to reduce sodium content across the food supply — South Africa (mandatory)
The South African government introduced mandatory maximum limits for sodium content in 2013. The legislation
was set for products in 13 food categories, including bread, breakfast cereals, margarines, meat products, snack
foods and soup mixes. It is estimated that approximately 60% of total sodium intake is provided from processed
foods (68). Food companies were granted a period of 3 years to ensure that their products were compliant. The
regulation came into effect in June 2016, and further reduction was expected 3 years later in 2019 (69). Evidence
from the WHO Study on global AGEing and adult health suggests a reduction of 400 mg/day sodium (1.15 g/day
salt) between 2015 and 2019 (70, 71).
Although South Africa has mandatory limits on sodium in food products, it is yet to legislate mandatory
sodium declarations on all pre-packaged food because the amended regulations relating to the labelling and
advertising of foods amendment is under review (72). The implementation of a nutrition declaration is critical to
monitoring compliance with mandatory limits on sodium content, as well as for other food systems actions such
as identifying foods low in sodium eligible for front-of-pack labelling, and for applying marketing restrictions.
© monkeybusinessimages
18 WHO GLOBAL REPORT ON SODIUM INTAKE REDUCTIONPublic food procurement and service policies
Healthy public food procurement and service policies set nutrition criteria for food served and sold in public settings
(a limit on the use of food typically high in sodium, a maximum permissible amount of sodium in a serving of food, or
a prohibition against placing saltshakers on tables) (73, 74). These policies can cover the entire process of purchase,
provision, distribution, preparation, service and sale of food to ensure each step meets healthy criteria.
Of the 194 Member States, 28% (n = 54) have public food procurement and service policies to reduce
sodium consumption through mandatory (18%; n = 36), mandatory and voluntary (3%; n = 5) or voluntary
(7%; n = 13) approaches (Figure 8). Such policies are most common in the WHO regions of the Americas, Europe
and Western Pacific, and more frequently implemented in the higher the income group. These policies set a
threshold for sodium in the food to be served or sold or – in 15 Member States – to restrict the availability of
saltshakers in the service area. These policies were from 2006 onwards, with almost a third of the Member States
having introduced these measures by 2013 when the WHO Global Action Plan for the Prevention and Control
of Noncommunicable Diseases, which recommended reducing sodium content in foods in public service, was
launched.
Figure 8. Proportion of Member States implementing mandatory and/or voluntary public food procurement
and service policies addressing sodium by WHO region, and World Bank income group
100%
59
90% 17
45
80% 7
13 37
70% 40 15 34
4
60% 6 23
28 4
50% 4
34 20 19
40% 13 2
10
30% 2 17
10
20% 4 11
10% 4
0 0
0%
AFR AMR EMR EUR SEAR WPR LIC LMC UMC HIC
(n = 47) (n = 35) (n = 21) (n = 53) (n = 11) (n = 27) (n = 28) (n = 53) (n = 52) (n = 58)
Mandatory Mandatory and voluntary Voluntary
AFR: African Region; AMR: Region of the Americas; EMR: Eastern Mediterranean Region; EUR: European Region; SEAR: South-East Asia Region;
WPR: Western Pacific Region
RESULTS 19Governments worldwide have a unique opportunity and responsibility to lead by example through setting criteria for food
served or sold in public settings such as government offices, schools, childcare centres, nursing homes, hospitals, health
centres, community centres, seniors centres, military bases and prisons, as well as in shops or stalls surrounding these
settings. Importantly, public funds should not be spent on food that is high in sodium.
The most common setting in which public food procurement and service policies are applied is schools (50 of the 54
Member States) (Figure 9). Forty-three Member States set standards for foods and beverages offered during school lunches,
other meals or snacks, while 31 Member States set standards for foods and beverages sold in school cafeterias, tuckshops,
snack bars or vending machines. Five Member States (Cabo Verde, Kiribati, Mongolia, Republic of Korea and Seychelles) set
sodium-specific standards for food sold around the school perimeter.
Beyond the school setting, two Member States (Hungary and Saudi Arabia) have standards for all foods procured by the
government, eight have standards for workplaces, government canteens or universities (Brazil, China, Malaysia, Philippines,
Qatar, Saudi Arabia, Singapore, Switzerland), and three (Hungary, Malaysia and Switzerland) for caring homes or hospitals.
Five Member States have standards including thresholds for sodium for restaurants and food outlets (Argentina, Bolivarian
Republic of Venezuela, Brunei Darussalam, Republic of Korea, Singapore) (Annex 2, Table A2.3). Boxes 5 and 6 illustrate two
different approaches to public food procurement.
Figure 9. Number of Member States implementing mandatory and/or voluntary public food procurement and
service policies addressing sodium by setting
50
13
3
60
34
50
Number of Member States
40
30 8
3 5
4
20 1 2
2 4
10 2 3
2
0
All food procured by Schools Workplaces, government Hosptials or Restaurants and
the government canteens or universities caring homes food outlets
Mandatory Mandatory and voluntary Voluntary
20 WHO GLOBAL REPORT ON SODIUM INTAKE REDUCTIONBox 5. Public food procurement and service policies — Brazil (mandatory)
The Brazilian Ministry of Health published Ordinance No. 1.274 of 7 July 2016 (75) to improve health in
workplaces. It requires all restaurants, canteens and cafeterias within the ministry and its entities to serve and
sell food that adheres to the Dietary guidelines for the Brazilian population (76). This includes using fresh or
minimally processed food products in cooking; prohibits serving or selling sugar-sweetened beverages; and
imposes strict limitations on serving, selling, promoting or advertising ultra-processed food products (as defined
in the Pan American Health Organization Nutrient Profile Model, including food products with greater than or
equal to 1 mg of sodium per 1 kcal) (77). In addition to the criteria for serving and selling food in food venues,
the Ordinance also applies to events and meetings held or contracted by the ministry. This includes meals and
snacks served or catered during meetings, coffee breaks, celebrations and other events. The ministry published
Guide for the preparation of healthy meals in events (78) to provide implementation guidance for meeting the
criteria, while maintaining local ingredients and the cultural value of food. The guide is also intended to be
applied voluntarily in other public or private institutions.
Box 6. Public food procurement and service policies — Seychelles (mandatory)
Seychelles adopted a National School Nutrition Policy in 2008, which sets standards for school meals, as well as
guidelines for food provision in tuckshops and during fundraising and other activities. The standard for school
meals is that these should not contribute more than 30% of recommended sodium intake for school-aged
children, that is, 210 mg/day for children in creche, 360 mg/day for children in primary school and 480 mg/day
for children in secondary school. The guidelines for tuckshops and fundraising and other activities state that
no foods of low nutritional value should be offered or sold. In the 2018 revised tuckshop guidelines, foods and
beverages of low, moderate and high nutritional value are being classified based on a traffic light system.
The national government developed a guidance document to support implementation of the policy, including
a monitoring tool and sample lease agreement for school tuckshops. Monitoring was supposed to be done
locally by school nutrition action groups in every school, comprising a teacher, student, parent, tuckshop owner,
dining staff member, school nurse, dental therapist and district representative. However, there are very few
schools where this group has been set up and still is operational. Central and local authorities also monitor
nutrition in schools at least once a year using the monitoring tool, reporting results back to the management
team of each corresponding school.
Nutrition labelling
Nutrition labelling is a powerful tool. It not only informs consumers about the ingredients and nutrient content of the
food, but can also influence consumers to make healthier choices and induce food manufactures to develop healthier
food products.
Nutrient declarations
Declaration of the amount of sodium on the food label is fundamental for the implementation and monitoring of
policies on reformulation, interpretive nutrition labelling such as front-of-pack-labelling, public food procurement
and service policies, fiscal policies, and marketing restrictions (79).
RESULTS 21As required by Codex alimentarius (food code) (80), the nutrient declaration, which is usually placed on the back or side
of the package and lists the nutrient content of a food, should be mandatory for all commercial pre-packaged foods.
Countries are advised to adopt regulations following the codex guidelines on nutrition labelling (80) on how nutrient
declarations should be structured and which nutrients should be mandatory to declare. The guidelines recommend
stating the sodium content, but national authorities may express the total amount of sodium in salt equivalents as “salt”.
Of the 194 Member States, 43% (n = 83) have a mandatory declaration of sodium on pre-packaged food, of which
26% (n = 52) have other mandatory, and 16% (n = 31) have no other mandatory approaches (Figure 10). A large
majority of Member States in the European Region implement mandatory nutrient declaration of sodium.
Figure 10. Proportion of Member States with mandatory declaration of sodium on pre-packaged food by WHO
region, and World Bank income group
83
100% 30 78
28
90% 53
50
80%
70% 45
42 42
41
60% 18
11 15
22
29 27
50% 31 26 27
19
10
40% 9
19
17
30% 4
20% 2
10% 2
0
0%
AFR AMR EMR EUR SEAR WPR LIC LMC UMC HIC
(n = 47) (n = 35) (n = 21) (n = 53) (n = 11) (n = 27) (n = 28) (n = 53) (n = 52) (n = 58)
Mandatory Mandatory and voluntary Voluntary
AFR: African Region; AMR: Region of the Americas; EMR: Eastern Mediterranean Region; EUR: European Region; SEAR: South-East Asia Region;
WPR: Western Pacific Region
22 WHO GLOBAL REPORT ON SODIUM INTAKE REDUCTIONFront-of-pack labelling
Front-of-pack nutrition labelling on pre-packaged foods contributes to increasing consumer awareness and enables
consumers to make healthier choices, change purchasing intentions, and provide industry incentive to reformulate
and produce healthier products (81, 82).
Of the 194 Member States, 21% (n = 40) have implemented front-of-pack labelling systems that include
sodium in an underlying nutrient profile model, through mandatory (6%; n = 11), mandatory and voluntary
(1%; n = 1) or voluntary (14%; n = 28) approaches (Figure 11). Such front-of-pack labelling systems are most
common in the European Region. In the European and Western Pacific regions these measures tend to be
voluntary, in contrast to the Region of the Americas where they are mandatory. The first such front-of-pack
labelling were voluntary endorsement logos introduced in 1998 and the early 2000s, with the first mandatory
system being introduced in 2011. By 2013, about a quarter of the Member States with such measures had
introduced front-of-pack labelling systems that included sodium in an underlying nutrient profile model.
Figure 11. Proportion of Member States with mandatory and/or voluntary front-of-pack labelling systems, by
WHO region, and World Bank income group
100%
90%
80%
48
70%
38 27 41
60%
36 9 26 25 7
50%
2 9 22 4
40% 15
20
10 9 4 8 4
30%
20 4
5 8
20%
4
10%
0 0
0%
AFR AMR EMR EUR SEAR WPR LIC LMC UMC HIC
(n = 47) (n = 35) (n = 21) (n = 53) (n = 11) (n = 27) (n = 28) (n = 53) (n = 52) (n = 58)
Mandatory Mandatory and voluntary Voluntary
AFR: African Region; AMR: Region of the Americas; EMR: Eastern Mediterranean Region; EUR: European Region; SEAR: South-East Asia Region;
WPR: Western Pacific Region
RESULTS 23The most effective systems are interpretive front-of-pack labelling systems that provide “at-a-glance” guidance on
the relative healthfulness of the product, with or without additional nutrient information. Since most shoppers
spend a few seconds at most examining food labels before deciding, labels must be clear and easy to understand
(83). Interpretive systems therefore apply symbols, figures or cautionary text to indicate the overall healthfulness or
nutrient content of a product.
The most common format used in front-of-pack labelling in the context of sodium reduction was an endorsement
logo (n = 15). Such logos and summary indicators were always implemented voluntarily. Warning signs were the most
common mandatory scheme, implemented especially in Latin America and in Israel. The multiple traffic light and
proportion of daily intake systems were implemented through both mandatory and voluntary approaches (Figure
12; Annex 2, Table A2.4). Member States typically implement one single front-of-pack labelling system, except two
Member States (Indonesia, Thailand) that have two systems.
Figure 12. Number of Member States with mandatory or voluntary front-of-pack labelling systems
15
15
16 9
14 5
12 8
4 7
10 3 8
7
8 2
6
1
4
2
0
Endorsement logo Multiple traffic Proportion of daily intake Summary indicator Warning sign
light system
Mandatory Voluntary
24 WHO GLOBAL REPORT ON SODIUM INTAKE REDUCTIONBoxes 7–10 describe different approaches to front-of-pack labelling systems in Chile, Sri Lanka, Australia and New
Zealand, and France, respectively.
Box 7. Front-of-pack labelling systems — Chile (mandatory)
The Food Composition and Food Advertising Law (2013) (84), enforced by the decree Modifica decreto supremo
nº 977, de 1996, reglamento sanitario de los alimentos (2015) (85), requires front-of-package warning labels (“high
in”) on packaged foods that exceed specific thresholds for sodium (400 mg/100 g in food or food products). It
is the first law to simultaneously regulate a front-of-pack warning label, place restrictions on food marketing
to children under 14 years of age, and set restrictions on the school food environment. The objectives are to
protect children and promote informed selection of food, and decrease consumption of food with excessive
amounts of sugars, sodium and saturated fat. The warning label was developed based on quantitative and
qualitative studies conducted with different population groups. The warning label performed the best in terms
of visibility, understanding and intention to purchase. Chile chose to use cut-off values per 100 g instead of per
serving because research found that the Chilean population was not aware of the definition of serving size, and
therefore using this reference would make the label more difficult to interpret. Using a per 100 g reference allows
for a standard measure for all foods, as it describes food based on the nutritional quality of the food, not the way
it is consumed, and allows comparison both within and between categories. Evaluation after implementation
of the “high in” warning label showed strong public support, and impact on both purchasing behaviour and
product reformulation (85). Chile has an enforcement system in place with sanctions for noncompliance.
Box 8. Front-of-pack labelling systems — Sri Lanka (mandatory)
Food (Colour Coding for Sugar, Salt and Fat) Regulations 2019-No 2119/3 (86) legislates mandatory front-of-pack
labelling regulations for pre-packaged solid and semi-solid processed foods based on the content of sugar, salt
and fats. The amount of salt specified is as follows:
Total salt content in solid or semi-solid food
Red logo: salt content (per 100 g): more than 1.25 g
Amber logo: salt content (per 100 g): 0.25 g to 1.25 g
Green logo: salt content (per 100 g): less than 0.25 g
This legislation was introduced in April 2019 and was to come into force from 1 June 2019. However, it has been
operating since 1 January 2021 due to several industrial concerns.
Several factors have influenced the development and approval of the legislation, including; the increasing
burden of noncommunicable diseases in Sri Lanka, the positive international momentum for evidence-based
interventions, a dedicated Food Control Administration unit within the Ministry of Health to coordinate and
implement legislation, and the Food Advisory Committee — a multiple stakeholder committee to advise the
Minister of Health on formulation of regulations under the provisions of the Food Act in Sri Lanka.
RESULTS 25Box 9. Front-of-pack labelling systems — Australia and New Zealand (voluntary)
Australia and New Zealand have implemented a voluntary front-of-pack nutrition label — the Health Star Rating
system. The Health Star Rating system summarizes the nutritional quality of a product and assigns it a rating
from 0.5 stars (least healthy) to 5.0 stars (most healthy) in 10 half-star increments (87, 88). The rating is calculated
based on an algorithm generating points. The lower the number of points, the better Health Star Rating score,
based on a range of points for each food and beverage category. For sodium, the points range from 0 for food
products with a sodium content of ≤90 mg/100 g or 100 ml and up to 30 for those with a sodium content
ofYou can also read