Workforce Plan 2018-2022 - Shire of Bridgetown-Greenbushes
←
→
Page content transcription
If your browser does not render page correctly, please read the page content below

Workforce Plan
                                                         2018-2022

ENDORSED BY COUNCIL 28 FEBRUARY 2019

Shire of Bridgetown Greenbushes Workforce Plan 2018 – 2022     0|P a g e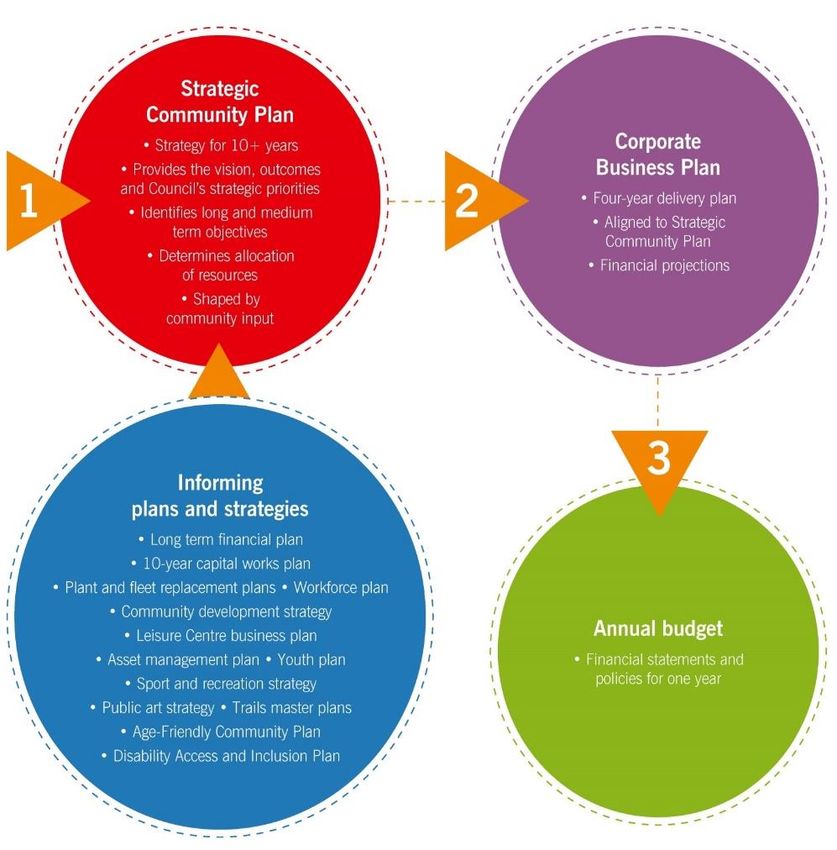
CONTENTS
Contents ................................................................................................................................................................................. 1

Executive Summary ..................................................................................................................................................................... 2

Integrated Workforce Planning in Context ................................................................................................................................. 3

External Environment ................................................................................................................................................................. 5

        Employment and Economic Environment .......................................................................................................................... 7

        Regional Environment Relative to Workforce Planning ..................................................................................................... 7

. Internal Operating Environment ............................................................................................................................................... 9

2018 Workforce Profile ............................................................................................................................................................. 11

Types of employment .......................................................................................................................................................... 13

Age profile in November 2018 ............................................................................................................................................. 14

Workforce Planning Staff Survey Summary .............................................................................................................................. 17

Workforce Implications from the Strategic and Corporate Business Plan................................................................................ 23

        Council's Vision ................................................................................................................................................................ 23

        Council's Key Goals........................................................................................................................................................... 23

Workforce Plan Strategy Summary ........................................................................................................................................... 37

Workforce Costs and Budget Implications ........................................................................................................................... 39

Workforce Plan Implementation Plan ...................................................................................................................................... 39

        Appendix One: IPR Integration Checklist ......................................................................................................................... 41

        Appendix Two - Staff responses to Workforce Planning Survey Questions ..................................................................... 42

                                                      Shire of Bridgetown Greenbushes Workforce Plan 2018 – 2022                                                               1|P a g e
Executive Summary

                                        Our previous Workforce Plan was completed in December 2013, so after
                                        a 5-year period it is appropriate that it be reviewed. In 2017 Council
                                        comprehensively reviewed its Strategic Community Plan and Corporate
                                        Business Plan and in 2018 conducted its annual review of the Corporate
                                        Business Plan. Council has also raised several issues that would have had
                                        either direct or non-direct impacts on the workforce. The advice to
                                        Council was that these issues needed to be addressed in a strategic
                                        context regarding the goals, objectives and strategies contained in its
                                        Strategic Community Plan.

                                        Included in the preparation of this new Workforce Plan was a
                                        comprehensive review of the Shire’s organisational structure. It is
                                        healthy for an organisation to review its structure. The demands and
                                        expectations imposed on the organisation by our community, the
                                        Council, other tiers of government and business are fluid and it is
important that the organisational structure can cater for these.

Maintaining the same organisational structure just because that is how we have always been is not a reason to
continue with that structure. Private enterprise reviews its organisational structure on a regular basis and a
local government needs to do the same to ensure that its services and infrastructure are delivered efficiently
and effectively.

The Workforce Plan considers the community aspirations, priorities and objectives identified in the Strategic
Community Plan. It is an essential component of the Corporate Business Plan and Long-Term Financial Plan so
that we can identify workforce requirements for current and future operations.

An integrated workforce plan identifies and reports on the internal capacity to meet current and future needs in
line with the goals and objectives of the Shire and the community it serves, both in capacity and capability. A
workforce plan also identifies the gaps or surplus in human, assets or financial resources and identifies
strategies to ensure there are the right people in the right place and at the right time to deliver on objectives
and realistic expectations in an affordable manner.

The plan is to address gaps between current and future workforce capability, identify areas of skill or capacity
shortage, and outline strategies to address them.

Planning human resource requirements is a significant challenge and not only considers the human resource
factors but ties this into overall strategic plans, environmental issues and legislative and governance obligations.

Ultimately undertaking a workforce planning activity is a snapshot of what human resources are in place at a
given time, and what staffing requirements are required into the future.

This Plan sets out strategies for delivery of functions and services that will be implemented with due diligence
and relevant consultation and approval processes

Tim Clynch
Chief Executive Officer

                                Shire of Bridgetown Greenbushes Workforce Plan 2018 – 2022               2|P a g e
Integrated Workforce Planning in C ontext
The workforce plan has been developed to address the requirements of the Local Government Act 1995 section
S5.56 (1) A “plan for the future” and Regulations on how to achieve have been made under S5.56 (2):
That Local Governments develop a Strategic Community Plan that links community aspirations with the
Council’s long- term strategy.
That the Local Government has a corporate business plan linking to long term financial planning that
integrates asset management, workforce planning and specific council plans (Informing Strategies) with
the strategic plan.
Regulation changes were gazetted in August 2011 with full compliance required by 30 June 2013
INTEGRATED PLANNING AND REPORTING FRAMEWORK
The Shire’s integrated planning framework comprises the following plans/programs:
Strategic Community Plan (SCP) – identifies the community’s main aspirations and priorities for the future and
outlines strategies for achieving these goals.
Corporate Business Plan (CBP) – describes the activities we will undertake over the next four years to achieve
the agreed short-term goals and outcomes that underpin long term aspirations.
Long Term Financial Plan (LTFP) – details the financial resources needed to enact the corporate plan in the first
four years and potential revenues and expenses for the next six years of the plan. It serves to inform and
resource all aspects of the integrated planning activities as appropriate.
Asset Management Plan (AMP) – This plan identifies and records the asset register, service level, activities and
strategies, to ensure physical assets and infrastructure are managed and maintained over their lifecycle; and
appropriately disposed of at the end of their useful life.
Integrated Workforce Plan (WP) – This plan identifies and reports on the internal capacity to meet current and
future needs of the goals and objectives of the Shire and the Community, both in capacity and capability.
Other informing strategies such as capital works plans, business plans, Aged Friendly, Youth Friendly and
Disability Access & Inclusion Plans
AIMS AND OBJECTIVES
This workforce plan aims to address the workforce needs of the Shire that arise from core function services and
operations, projects, strategic initiatives and priorities.
It also aims to build capacity and resilience to allow the Shire to respond to the changing environment and
issues arising from external pressures and legislative compliance issues.
The diagram on the following page illustrates the Shire of Bridgetown-Greenbushes’ Integrated Planning and
Reporting Framework; where the Corporate Business Plan, Strategic Community Plan and various informing
strategies come together and with the annual budget, and support Council decisions, resource allocations and
planning
Shire of Bridgetown Greenbushes Workforce Plan 2018 – 2022 3|P a g e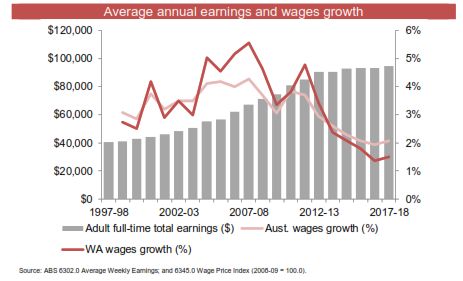
Shire of Bridgetown Greenbushes Workforce Plan 2018 – 2022 4|P a g e
External Environment

WESTERN AUSTRALIAN EMPLOYMENT ENVIRONMENT
                                                               Western Australia’s total employment rose by
                                                               4,229 to 1.35 million in August 2018, with an
                                                               increase in both full-time employment (up
                                                               828 to 914,507) and part-time employment
                                                               (up 3,401 to 430,530).

                                                               Total employment rose 2% (20,000) through
                                                               the year to August 2018, with an increase in
                                                               both full-time employment (up 1% or 9,519)
                                                               and part-time employment (up 2% or 10,481).

                                                               The 2018-19 Western Australian Government
                                                               Budget forecasts annual average employment
                                                               growth of 1.5% in 2018-19 and 2% in 2019-20.

   *Data sources are 12-month averages of original ABS data.

                                                               The unemployment rate measures the
                                                               proportion of the labour force that is
                                                               unemployed (people without a job who are
                                                               actively looking for work).

                                                               WA’s unemployment rate of 6.4% in August
                                                               2018 was above the 6.0% in the previous
                                                               month and the 5.8% a year ago.

                                                               Australia’s unemployment rate was 5.3% in
                                                               August 2018.

The 2018-19 Western Australian Government Budget forecasts an annual average unemployment rate of 5.75%
in 2018-19 and 5.5% in 2019-20.

                             Shire of Bridgetown Greenbushes Workforce Plan 2018 – 2022           5|P a g e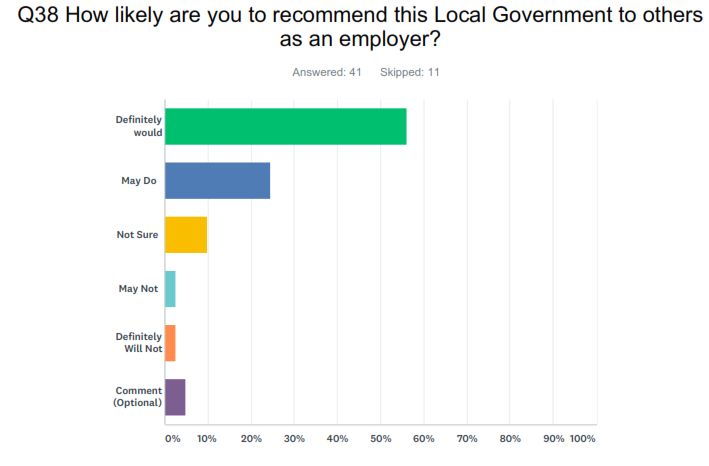
Unemployment rose by 6,729 to 92,709 in
                                                                August 2018

                                                                The underutilisation rate measures the
                                                                proportion of the labour force that is
                                                                unemployed or underemployed (workers
                                                                wanting more hours).

                                                                The underutilisation rate of 16.9% in the
                                                                September quarter 2018 was above the 15.7%
                                                                in the previous quarter and the 15.2% a year
                                                                ago.

                                                                The underutilisation rate in the September
                                                                quarter 2018 comprised an underemployment
                                                                rate of 10.6% and an unemployment rate of
                                                                6.3%.

                                                              The underemployment rate of 10.6% in the
   September quarter 2018 was above the 9.4% in the previous quarter and the 9.6% a year ago.

                                                                  Average annual adult full-time total earnings
                                                                  rose 1.4% to $94,687 in 2017-18.

                                                                  Western Australia’s average annual adult
                                                                  full-time total earnings were 10% ($8,856)
                                                                  above the Australian average of $85,831 in
                                                                  2017-18.

                                                                  Western Australia’s wage price index rose
                                                                  1.5% in 2017-18, below annual average
                                                                  growth of 2.9% over the past ten years, and
                                                                  below Australia’s wages growth of 2.1% in
                                                                  2017-18.

                                                                  The     2018-19      Western      Australian
                                                                  Government Budget forecasts wages growth
                                                                  of 1.75% in 2018-19 and 2.75% in 2019-20.

Source- Government of Western Australia Department of Jobs, Tourism, Science and Innovation September 2018

                              Shire of Bridgetown Greenbushes Workforce Plan 2018 – 2022            6|P a g e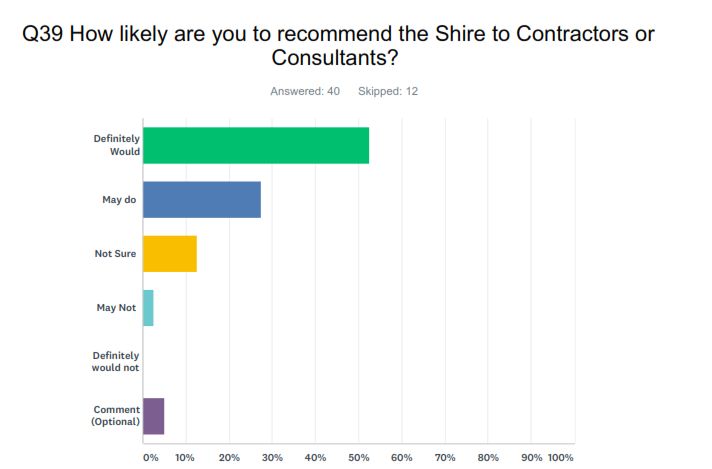
EMPLOYMENT AND ECONOMIC ENVIRONMENT
Currently wage growth is low and underemployment is high in Western Australia. The Wage Price Index in WA
increased by only 1.3% over the year to the September 2018 quarter, continuing a six-quarter run of annual
growth below 2%. The Wage Price Index is expected to rise by only 1.8% in 2018 followed by growth of 2.9% in
2019 and 3.2% in 2020. This compares against a long-term average of 3.5% wages growth per annum.

Underemployment refers to people employed part-time who want to work more hours and are available to start
work with more hours; or people who are usually employed full-time but who work part-time for economic
reasons. Some 54,000 part-time roles have been added in WA over the four years to October 2017, even though
the domestic economy has contracted over this period. The number of underemployed persons in WA remained
at high levels in October 2017, while the ratio of under employed persons to employed persons also remained at
record highs (10.7%). Continued momentum behind fulltime jobs growth will hopefully begin to soak-up
underemployment in WA. However, with almost 11% of the workforce willing and able to work more but unable
to secure more work, spending will remain low. Ref: WA Economic Outlook December 2017 / Deloitte Access
Economics Pty Ltd

With output weak and workers abundant, employment may grow further before we see wages growth. With
underemployment high, it’s likely that wages growth will remain weak in WA. For the Shire these factors result
in high demand for existing jobs, which is good for recruitment, and limited wages growth, keeping costs down.
The 2018-19 Western Australian Government Budget forecasted annual average employment growth of 2.25%
in 2017-18 and 1.5% in 2018-19

REGIONAL ENVIRONMENT RELATIVE TO WORKFORCE PLANNING

SOUTH WEST REGIONAL EMPLOYMENT STATUS TO JUNE 2018

Population                      177,366           Labour force                       100,213

Employed persons                94,090            Unemployment rate                  6.1%

Sources for regional data are ABS, 3218.0, Regional Population Growth, Australia, 2016–2017, and
the Australian Government Department of Jobs and Small Business, Small Area Labour Markets– Australia (June
2018 quarter). A discrepancy between some State and regional figures may arise from time to time, due to State
figures being released monthly by the ABS and regional figures being released quarterly by the Australian
Government Department of Jobs and Small Business on a 12 month rolling average basis.

                               Shire of Bridgetown Greenbushes Workforce Plan 2018 – 2022           7|P a g e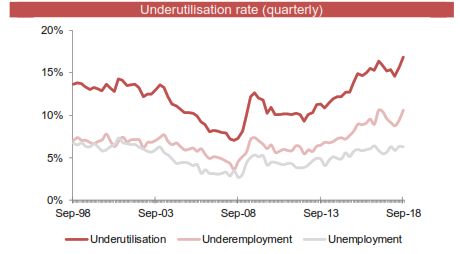
WA LOCAL GOVERNMENT ENVIRONMENT
WA Country Local Governments in WA are feeling the constraints of the economic downturn and the reduction
of grants available through the Royalties for Regions program that has been a rich source of funding over the
past few years. While the employment market has softened due to the end of the resources boom, there are
few opportunities to upskill the workforces through staff turnover as projects are reduced and people hold on to
their jobs. There is also a Major review of the Local Government Act underway in consultation with the Local
Government Sector, peak bodies and key stakeholders. Significant factors that may impact on the Shire are
Governance standards, Councillor training requirements, and legislative compliance levels for smaller local
governments
SHIRE OF BRIDGETOWN GREENBUSHES POPULATION AND LABOUR FORCE
Year 2011 2012 2013 2014 2015 2016 2018
Population 4,421 4,513 4,607 4,637 4,662 4,670 Est 4800
LABOUR FORCE STATUS BY AGE
BY SEX (1 of 2) Age
Persons aged >15 years Sex
Age
15- 35- 45- 65- 75- 85
20-24 25-34 55-64
19 44 54 74 84 years
Total
MALES
Employed, worked:
Full-time(a) 36 39 89 131 198 156 44 9 0 701
Part-time 20 9 19 30 42 73 42 8 0 235
Employed, away from
0 3 3 11 18 8 4 0 0 47
work(b)
Hours worked not stated 5 0 3 3 3 9 0 0 0 26
Total employed 61 48 110 170 260 244 94 22 0 1,008
Unemployed, looking for:
Full-time work 0 4 10 13 9 9 0 0 0 46
Part-time work 3 0 7 3 0 6 3 0 0 21
Total unemployed 5 3 12 12 9 18 10 0 0 63
Total labour force 71 50 124 182 263 255 100 22 0 1,069
Not in the labour force 66 5 11 23 37 104 252 123 28 643
Labour force status not
5 4 14 21 29 31 25 16 4 155
stated
Total 138 56 151 224 330 390 384 161 31 1,867
FEMALES
Employed, worked:
Full-time(a) 10 22 41 64 92 86 19 3 0 339
Part-time 44 18 38 130 126 134 36 3 0 531
Employed, away from
0 0 8 4 9 21 3 0 0 45
work(b)
Hours worked not stated 0 0 0 4 7 0 4 0 0 17
Total employed 55 40 82 204 238 239 67 8 0 938
Unemployed, looking for:
Full-time work 3 0 4 0 6 8 0 0 0 26
Part-time work 0 0 4 12 3 8 0 0 0 32
Total unemployed 3 0 8 15 15 16 0 0 0 58
Total labour force 61 43 90 216 250 257 67 8 0 995
Not in the labour force 47 22 47 55 73 148 266 110 54 827
Labour force status not
10 4 14 15 39 31 19 19 4 154
stated
Total 120 65 152 287 366 436 352 137 53 1,976
Shire of Bridgetown Greenbushes Workforce Plan 2018 – 2022 8|P a g e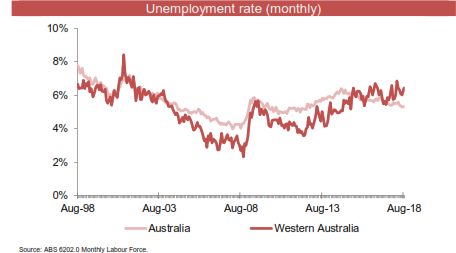
POPULATION GROWTH POTENTIAL

Population growth over the last 5-10 years has been around 1% per annum. Whilst this extent of population
growth doesn’t have an immediate effect on the local government’s service provision it is important for the
Council to regularly review service levels and demands for new services and infrastructure that is generated by
an increasing population.

In addition to normal growth rates in our district there will be significant growth triggered by the Talison Lithium
expansion project in Greenbushes. This project is likely to see a doubling of workforce numbers from around
500 to approximately 1,000 workers with estimates being that 61% of the new workers will reside within the
Shire of Bridgetown-Greenbushes. In considering the likely proportion of locally sourced workers and single
workers to those with families, this growth is expected to result in a population increase in the Shire over the
next 5 years of approximately 500 residents which represents an approximate 10% increase in population not
including a continuation of the recent trend of 1% growth rate. Such a growth rate will likely trigger new
demands for services and facilities and Council will need to monitor both short-term and long-term demands in
the next 5-10 years

. Internal Operating Environment
Shire Facilities
The Shire workforce operates from the Administration building at 1 Steere Street Bridgetown, the Regional
Library, Swimming Pool and Leisure Centre, also in Steere Street; the Visitor information Centre at 154 Hampton
Street and at the Shire Depot.

SERVICES AND FUNCTIONS
As at December 2018 the organisational structure for the Shire of Bridgetown-Greenbushes consists of five
Departments or Divisions as illustrated below:

                                             Chief Executive
                                                 Officer

                                   Office of the
                                        CEO

                                                                                  Planning &
             Corporate               Works &              Community
                                                                                Environmental
              Services               Services              Services
                                                                                   Services

There are executive managers in place for the ‘Works & Services’, ‘Community Services’ and ‘Corporate Services’
divisions however the ‘Planning & Environmental Services’ division reports directly to the CEO. Council has
identified this as a weakness in the structure as it draws the CEO into the operational functions of that division
more so than if an executive manager was in place.

On the following page is a list of functions/services which each Division is responsible for:

                                Shire of Bridgetown Greenbushes Workforce Plan 2018 – 2022               9|P a g e
CEO’s Office Corporate Services
Governance Administration
Councillor Liaison Annual Budgets
Agendas/Minutes Annual Financial Reports
Strategic Planning Corporate Business Plan
Human Resources Long Term Financial Plan
Occupational Health and Safety Asset Management
Website Debtors/Creditors
Citizenship Insurance
Local Government Elections Rates
Local Government Compliance Payroll
Local Laws Records Management
Cemetery Records & Administration Customer Services
Land Disposition Police Licensing
Economic Development Information Technology (IT)
Planning & Environmental Services Community Services
Planning & Development Approvals Community Development
Town Planning Schemes and Service Agreements & Community
Amendments Grants
Subdivisions Seniors Issues
Road Names Youth Issues
Heritage Access & Inclusion
Building Approvals Arts & Culture
Environmental Health Library
Shire Building Maintenance Integrated Leisure Centre
Cleaning of Shire Facilities Visitors Centre/Tourism
Ranger & Regulatory Services Trails Development
Swimming Pool Approvals &
Inspections
Works & Services
Engineering
Roads (Maintenance and Construction)
Crossovers and Bridges
Parks, Gardens and Reserves, Footpaths
and Walk Trails
Street Trees Maintenance
Traffic Control
Weed Management
Parking Facilities
Cemetery Maintenance
Waste Management
Plant and Machinery
Traffic Counts
Heavy Haulage Approvals
Shire of Bridgetown Greenbushes Workforce Plan 2018 – 2022 10 | P a g eAs well as the functions and services that are listed
above, there are many other administrative, strategic
and operational planning, training and development
and legislative compliance tasks and requirements
that need resourcing and financing.
These are the often-hidden workloads that often
suffer from low resources or skillsets as they are not
readily recognised as pivotal roles in providing cost
effective, sustainable and high-quality services,
programs and facilities.
2018 Workforce Profile
The chart below indicates the number of people employed in each division. The CEO is responsible for his office
staff and the ‘Planning & Environmental Services’ staff. The Community Services team have a high level of
casual staff that have reviewed and reduced in the 2018 Divisional review and redevelopment through natural
attrition.
ORGANISATIONAL STRUCTURE AS AT DECEMBER 2018
The Organisational structure needs to deliver the appropriate range of services underpinned by integrated
financial, workforce and asset management systems and processes to allow the Shire to deliver on its promise
to the community. In addition to service delivery, and the development /maintenance of facilities and
infrastructure the Shire needs to also resource the planning, management and reporting requirements. The
current (December 2018) structure is shown on the next page.
Shire of Bridgetown Greenbushes Workforce Plan 2018 – 2022 11 | P a g eShire of Bridgetown Greenbushes Organisation Structure 2018 Shire of Bridgetown Greenbushes Workforce Plan 2018 – 2022 12 | P a g e
WORKFORCE PROFILE

The Shire had 64 full-time or part-time employees on the payroll at September 30th 2018, (51.71 FTE) with 4 full time
and 1 part-time positions vacant. A large number of casual staff is provided for in annual budgets with the 2018/19
budget allowing for 3.43 FTE of casuals. Casuals therefore represent 6.22% of our total workforce hours.

A review of employee date determined that there were casual positions still in the system who were no longer
providing services to the Shire therefore a review of currency of casual staff is to be undertaken.

Of the 64 full-time or part-time employees 37 are male and 27 are female. The senior management team has an
equal gender ratio representation (2 female; 2 Male) and the Council has 6 male and 3 female Elected Members.

                                            TYPES OF EMPLOYMENT

The employment profile is outlined below. There is a flexibility trend in the Corporate and Community Services staff
employment types, but the Works & Services area appears to be working to a more traditional model of full time or
casual employees.

    Shire of Bridgetown Greenbushes Workforce Plan 2018 – 2022            13 | P a g e
AGE PROFILE IN NOVEMBER 2018
The average employee age across the organisation = 47 years, the median age of population (Shire) = 49yrs (ABS
2016 census). There is a good spread of age groups across the organisation, with succession planning and knowledge
management strategies indicated in the male full time and female part time categories.
Tenure of Employment
Employees at the Shire predominantly
come from Bridgetown and the
surrounding region which makes the
Shire a significant employer in the region
and indicates local availability of suitable
candidates when recruiting. This support
the stability of the workforce and the
long tenure of the majority if staff.
Shire of Bridgetown Greenbushes Workforce Plan 2018 – 2022 14 | P a g eWorkforce Capability: - Years of Service Local Government
There is a a good level of Local Government experience in the Shire which provides a strong and relevant knowledge
base for service delivery and functionality
Years at the Shire of Bridgetown Greenbushes Years in the Local Govt Industry
STAFF TURNOVER HISTORY
2013_14 2014_15 2015_16 2016_17 2017_18 2018_19 Total
YTD
Res Red Res Red Res Red Res Red Res Red Res Red Res Red
Full Time 3 0 2 0 3 0 6 0 3 0 0 21
Part Time 3 0 4 3 4 0 7 1 3 0 0 24 4
Casual 11 0 3 0 10 0 10 0 16 0 0 50
Key: Res = Resignation Red= Redundancy
Total Staff Turnover
Over the last five years, three of the terminations have been redundancies arising from the closure of recreation
centre services in 2014/15 and a further redundancy in Community Services in 2016/17 from services / program
discontinuation.
Shire of Bridgetown Greenbushes Workforce Plan 2018 – 2022 15 | P a g eDue to the lack of a comprehensive set of HR data in the Shire this data cannot be further analysed but from
anecdotal information the presumptions can be reasonably made.
The low turnover, the length of tenure of many staff and the stability of structure over the past five years,
give rise to the presumption that in the main, positions were replaced as vacancies arose and there were few
new positions created. As has been ascertained in this review process, the management of the appointment
of casuals and the notification to payroll when they resign has room for improvement.
The high level of casual resignation in 2017/18 also reflects a change in structure and roles in community and
recreation services as well as the removal of some casuals from the payroll who may have resigned the
previous financial year.
The Shire does have licensed software to improve HR data management and reporting as is required and
outlined in the WA Local Government Department workforce planning guidelines, but it has not been
populated to date.
Shire of Bridgetown Greenbushes Workforce Plan 2018 – 2022 16 | P a g eWorkforce Planning Staff Survey Summary
The survey, with a 54% response rate, was carried out as part of the workforce planning process. Responses came
from across the workforce to assist in determining capacity, capability, years of service, tasks carried out, staff
satisfaction levels and improvement suggestions. In summary, in reviewing the data and comments, the picture
painted is one of a well led and well managed workforce, with employees that in the main enjoy their job, and are
trained and certified in appropriate areas. Employees are generally happy with the workplace environment and Shire
management but there were identified issues in some areas as outlined in the staff feedback. There were many
responses that indicate communication and cooperation across divisions could be improved and suggestions for
improvement were offered.
WORKFORCE CAPACITY AND CAPABILITY
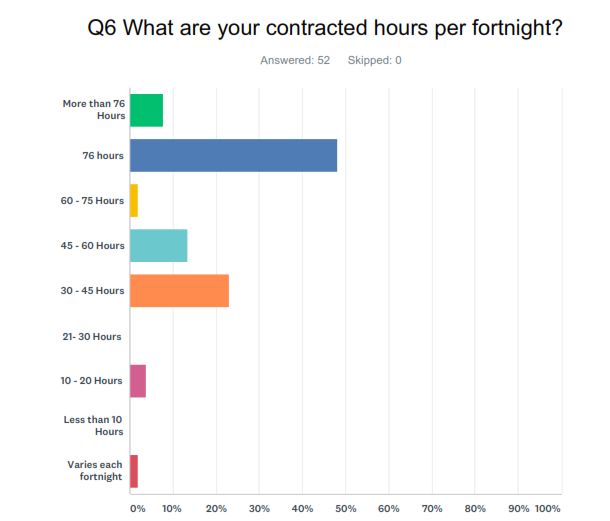
54% of respondents worked more that their contracted hours on a regular basis – the amount is outlined below
Reasons for addition hours:
Shire of Bridgetown Greenbushes Workforce Plan 2018 – 2022 17 | P a g ePosition Descriptions
91% responded to having a Position Description, 51% said it was reviewed annually, and 17% said it was sometimes
reviewed. 62% indicated it reflected what they did, 33% said somewhat and 5% said it did not reflect what they did.
Involvement in Planning or review processes for their area
84% of respondents replied to this question showing an inclusive approach to planning and review across the
organisation
Training needs to be able to carry out the job
While there were needs identified, there were no major concerns outlined relating to training and development.
Shire of Bridgetown Greenbushes Workforce Plan 2018 – 2022 18 | P a g eWorkforce Issues and Constraints
The highlighted areas from the 2013 survey were still a predominate issue with staff in the 2018 staff survey. More
staff feedback information from 2018 feedback in Appendix.
Issues and Constraints 2013 Issues and Concerns Themes 2018
Internal Communication
Internal communication
Interdepartmental cooperation, customer service
Increasing workloads and communication
Unplanned role expansion to meet needs Timely provision of information from other
departments
Time constraints and unrealistic deadlines
Workload in development services
Duplication of services across departments
Time constraints
Departmental management v functional management
Bureaucracy
Pool office and IT Infrastructure
Operational requirements constraining
Staff resource shortages compliance work
Out dated workplace systems in some areas Resource shortfalls
Poor integration of IT systems and perception that the Budget and manpower
Shire is under resourced in IT technology and systems
for the level of service expectation. Better Communication, cooperation and
functional management
Interdepartmental cooperation, customer service and
communication
Minimal knowledge of actual departmental
Funding for community / recreation programs and responsibilities across departments.
services
Inadequate time allocated to asset management
Reliable volunteers activities across divisions
Bureaucratic levels of responsibility making it difficult Some departments do not work together as one
to effectively source information organisation.
Depot workshop issues and risks
Role clarity in some areas
Shire of Bridgetown Greenbushes Workforce Plan 2018 – 2022 19 | P a g eEmployee Satisfaction Level Indicators
When asked the question about whether they would recommend the Shire to others as a good place to work they
were given 5 options. Staff responded to the questions below, a very positive result indicating high levels of staff
satisfaction.
Shire of Bridgetown Greenbushes Workforce Plan 2018 – 2022 20 | P a g eCURRENT WORKFORCE COSTS
Employee Liability Balances 2013/14 2014/15 2015/16 2016/17 2017/18
Total Annual Leave Liability $416,217 $426,024 $445,581 $445,657 $423,608
* Total Sick Leave Liability N/A N/A N/A N/A N/A
Long Service Leave Liability $507,490 $511,710 $536,249 $528,655 $576,942
Employee Benefits Liability N/A N/A N/A N/A N/A
Organisational Impact 2013/14 2014/15 2015/16 2016/17 2017/18
** Operating Revenue (Adjusted) $7,528,585 $7,827,160 $8,276,117 $8,549,073 $8,997,067
Rates Income $3,460,156 $3,707,858 $3,955,837 $4,151,674 $4,363,497
*** Total Workforce Expenditure $4,226,546 $4,367,150 $4,627,722 $4,748,551 $4,751,812
Total Workforce Expenditure 2013/14 2014/15 2015/16 2016/17 2017/18
% of Rates Income 122% 118% 117% 114% 109%
% of Operating Revenue (Adjusted) 56% 56% 56% 56% 53%
Gross Salaries 2013/14 2014/15 2015/16 2016/17 2017/18
& Wages
Gross Salaries & Wages $3,602,819 $3,716,093 $3,878,695 $4,085,743 $4,078,951
Gross Salaries & Wages as % of Rates
104% 100% 98% 98% 93%
Income
Gross Salaries & Wages as % of
48% 47% 47% 48% 45%
Operating Revenue (Adjusted)
* No provision is recorded in the accounts for sick leave, unable to extract past year reports from the payroll system
** Excludes Non-Operating Grants, Subsidies & Contributions. Yearly totals have been adjusted for the prepayment of Financial Assistance Grants
*** Includes wages allocated to capital works
The above table shows an improving pattern when comparing workforce costs against the operating revenue
and rates. In the 2013 Workforce Plan commentary was made expressing concern about the workforce costs
at that time in relation to rate revenue with workforce costs being greater (103%) than rate revenue. There
has been a significant improvement in this area with the figure in 2017/18 being 93%.
Additional things to note related to the data in the table are:
The Shire's annual leave liability is quarantined as a 'Provision' to cover accumulated annual
leave. Additional to that, the Shire has a 'Leave Reserve'.
Typically, staff that take annual or long service leave aren’t fully replaced during their periods of
leave. If full replacement is proposed this would be factored into the applicable annual budget.
In the 5 years from 2013/14 to 2017/18 gross salary and wages increased by 13.2%, but in the same
time the total annual leave liability only increased by 1.8%.
Long service leave liability did increase by 13.7% in the last 5 years, but this can be attributed to the
number of staff not currently eligible to take long service leave but many are getting close to that
entitlement.
Shire of Bridgetown Greenbushes Workforce Plan 2018 – 2022 21 | P a g eCURRENT ORGANISATIONAL AND WORKFORCE RISK PROFILE
Generally, the Shire workforce has maintained capacity and capability over the last five years. The following
issues, gaps or risks were identified in the review and staff consultation process.
Communication and collaboration limitations across Divisions is affecting efficiency and effectiveness
in performance and in customer service levels
Skills and capacity gaps in the Planning and Health areas impacting on customer service and
compliance levels
The Works area continues to have some ambiguity in roles which impacts on efficiency and service
delivery
The Community Services division has a high level of casual labour use, and notification of turnover to
the HR and finance teams is not efficient.
The Depot workshop should be reviewed for safety and functionality purposes
Customer service efficiency and culture requires review and issues addressed
Executive management of development services is required to reduce the number of reporting
officers to the CEO to allow him to be more strategic in his role
Works structure, management and support requires review and update to increase effectiveness
and efficiency and reduce ambiguity in support roles.
Governance and organisational risk management requires a higher level of focus and support
Ranger and emergency service levels require review to ensure appropriate resource, skills and
support levels.
Shire of Bridgetown Greenbushes Workforce Plan 2018 – 2022 22 | P a g eWorkforce Implications from the Strategic and Corporate Business Plan
In the Strategic Community Plan each theme reflects the community’s aspiration (planning objective) and is
resourced through the Long-Term Financial Plan and the Workforce Plan. There is a need to review current
resources and determine any future workforce gaps, issues or risks
COUNCIL'S VISION
A beautiful place to live - Working together with the community to achieve our shared objectives
COUNCIL'S KEY GOALS
Key Goal 3
Key Goal 2 Key Goal 5
Key Goal 1 Our built Key Goal 4
Our natural Our leadership will
Our economy will environment is A community that is
environment is be visionary,
be strong, diverse maintained, friendly and
valued, conserved collaborative and
and resilient protected and welcoming
and enjoyed accountable
enhanced
Key Goal One: Our economy will be strong, diverse and resilient
1.1 1.1.1 Encourage long term growth in the district in order to retain and
A diverse enhance services
economy that 1.1.2 Develop and implement strategic plans and actions that attract
provides a range economic development
of business and 1.1.3 Plan for expansion of the commercial area
employment 1.1.4 Develop industrial and light industrial areas
opportunities 1.1.5 Pursue improvements to infrastructure and services, including
utilities
1.1.6 Work with key partners (business and government) to improve
telecommunications within the Shire
1.1.7 Improve tourist facilities
1.1.8 Develop trails – culinary, art, walk, mountain bike, canoe and bridle
1.1.9 Support tourism activities that focus on events, adventure,
agriculture, food, heritage and the natural environment
1.1.10 Deliver or support a range of events where a demonstrable
community benefit can be shown
1.2 1.2.1 Embrace a “can-do” approach to development
A proactive 1.2.2 Design and implement business retention strategies and initiatives
approach to for support of existing and potential new businesses
business 1.2.3 Communicate and engage with the business community
development 1.2.4 Ensure the Shire’s procurement policies support local business and
local employment
Shire of Bridgetown Greenbushes Workforce Plan 2018 – 2022 23 | P a g eKey Goal 2: Our natural environment is valued, conserved and enjoyed
2.1 2.1.1 Support and promote sound environmental management
Value, protect and practices
enhance our natural 2.1.2 Support local and regional environmental initiatives
environment 2.1.3 Identify opportunities for protecting and enhancing the health of
the Blackwood River and tributaries
2.1.4 Consider opportunities for greater recreational and commercial
use of the Blackwood River
2.1.5 Improve public access to natural waterways
2.2 2.2.1 Prepare and implement strategies for development and
Enhanced parklands, maintenance of parklands and reserves
reserves and gardens 2.2.2 Manage the Shire’s parks on a waterwise basis
2.2.3 Prepare and implement management or conservation plans for
bushland reserves
2.2.4 Develop the Dumpling Gully waterbodies at Greenbushes
2.2.5 Develop and maintain playgrounds that cater for a range of age
groups and activities
2.3 2.3.1 Explore and implement renewable energy options for Shire
Effectively utilised buildings
natural resources 2.3.2 New Shire buildings to incorporate environmentally sustainable
design principles
2.4 2.4.1 Improve provision and distribution of land management
An informed information
community on land 2.4.2 Encourage the community to have sustainable lifestyles and
management and inform the community on ways to use our environment
sustainable living sustainably
2.5 2.5.1 Identify long term waste disposal and recycle options for the
Effectively managed Shire
waste services 2.5.2 Implement waste reduction and recycling initiatives
2.6 2.6.1 Planning processes allow for a diverse range of land and
Development is development opportunities
sympathetic to the
landscape
Shire of Bridgetown Greenbushes Workforce Plan 2018 – 2022 24 | P a g eKey Goal Three: Our built environment is maintained, protected and enhanced
3.1 3.1.1 Ensure relevant policies and plans offer appropriate protection to
Maintained existing heritage character whilst still allowing appropriate
townsite heritage development opportunities
and character 3.1.2 Ensure town centres achieve a high standard of appearance and
amenity
3.1.3 Work with community to identify and implement projects that
promote the unique heritage and history of each town
3.2 3.2.1 Community spaces and buildings accommodate a wide range of
Outdoor spaces, interests and activities
places and 3.2.2 Social and recreation programs make the most of existing built
buildings are fit facilities
for purpose 3.2.3 Bridgetown Sportsground is the base for oval sports in
the Shire
3.2.4 Greenbushes Sportsground is the base for rectangular sports in
the Shire
3.2.5 Provide and maintain a range of facilities that cater for the
community’s needs
3.2.6 Develop new facilities that provide for the identifiable needs of
the community
3.3 3.3.1 A well maintained local and regional transport network
Maintain an 3.3.2 Maximise funding opportunities to improve road safety
appropriate 3.3.3 Provide and maintain a safe and efficient transport system
standard of 3.3.4 Ensure suitable access to road building materials
transport
networks, roads
and pathways
Shire of Bridgetown Greenbushes Workforce Plan 2018 – 2022 25 | P a g eKey Goal Four: A community that is friendly and welcoming
4.1 4.1.1 Deliver and support a wide range of community activities,
A cohesive community events and associated infrastructure
with a sense of pride 4.1.2 Deliver programs that encourage community interaction and
participation
4.2 4.2.1 Encourage events, activities, programs and services relevant
Programs and facilities to, and accessible for local youth
that encourage 4.2.2 Increase the awareness and acceptance of diversity and needs
community resilience in local youth
4.2.3 Support relevant (local or outreach) support services and
programs
4.2.4 Support educational and employment transitional programs
4.2.5 Support initiatives that develop confidence, self-esteem and
resilience
4.2.6 Increase the number of aged care housing facilities
4.2.7 Explore the potential and feasibility of volunteer
network/social enterprise models to assist seniors with home
maintenance
4.2.8 Establish a central source of information dissemination and
promotion of local seniors’ services and home bound residents
4.2.9 Improve services and facilities for seniors and people with a
disability
4.2.10 Maintain and enhance community services, including
education and health
4.3 4.3.1 Investigate improvements to local transport systems
Appropriate 4.3.2 Seek to link volunteer transport service timetables with
community led local commercial transport providers
transport systems
4.4 4.4.1 Acknowledge volunteers and the contribution they make to
Promoting our community
Volunteerism 4.4.2 Promote to the community, both individually and at the
community level, the importance and benefits of volunteering
4.5 4.5.1 Monitor risk management and emergency management
High levels of profiles, procedures and preparedness
responsiveness to 4.5.2 Prepare and implement flood mitigation/management
emergencies and strategies
emergency recovery 4.5.3 Improved mobile phone communications
4.6 4.6.1 Reduce bush fire hazards
Fire prepared 4.6.2 Support community education and information programs in
communities relation to fire protection
4.6.3 Develop policies and strategies concerning fire management
on private properties
4.6.4 Bush fire brigades are resourced with adequate equipment,
appliances, training and other operational requirements
4.7 4.7.1 A functional and safe Hampton Street
A safe area 4.7.2 Improve parking and pedestrian accessibility in town centres
4.7.3 Develop and implement crime prevention strategies
Shire of Bridgetown Greenbushes Workforce Plan 2018 – 2022 26 | P a g eKey Goal 5: Our leadership will be visionary, collaborative and accountable
5.1 Our community actively 5.1.1 The community is involved in local decision making
participates in civic life 5.1.2 People are provided opportunities to develop strong
leadership skills
5.1.3 Monitor, maintain and enhance the way we communicate
with the community
5.1.4 People receive Shire information, services and
opportunities according to their needs
5.1.5 Support groups that deliver programs, activities and
services for the benefit of the community
5.2 We maintain high 5.2.1 Councillors provide strong and ethical leadership
standards of 5.2.2 Staff work in an ethical manner
governance, 5.2.3 Ensure organisational capability
accountability and 5.2.4 Maintain a strong customer focus
transparency 5.2.5 Regularly review community engagement strategies and
policies
5.2.6 Ensure the future financial sustainability of the organisation
5.2.7 Council’s policies and local laws are responsive to
community needs
5.2.8 Ensure all legislative responsibilities and requirements are
met
5.3 We operate within the 5.3.1 Implement the Shire’s Integrated Planning Review Cycle
Integrated Planning 5.3.2 Apply best practice asset management principles
Framework 5.3.3 Establish and review service levels
5.4 We participate in 5.4.1 Monitor opportunities for shared services in co-operation
Regional Collaboration with regional partners
5.4.2 Participate in local government collaborative groups
5.4.3 Monitor potential initiatives in local government reform
5.5 We are strong advocates 5.5.1 Lobby and advocate to represent the community’s needs
for our community
IMPLICATIONS FOR THE CORPORATE BUSINESS PLAN
The Shire of Bridgetown-Greenbushes Corporate Business Plan 2018-2022 is a rolling four year service and
project delivery plan. It has been developed to align with the Shire’s 10 Year + Strategic Community Plan
and provides the various actions to implement the outcomes and strategies articulated in the Strategic
Community Plan. The Corporate Business Plan demonstrates how the aspirations that the community
articulated in the Strategic Community Plan will be delivered within the operational capacity of the Shire.
The Corporate Business Plan is reviewed annually.
The Corporate Business Plan lists actions against each of the strategies, detailing how each strategy will be
delivered. Although the Corporate Business Plan is a 4 year timeframe it is a rolling document subject to
annual review, hence a 5th year column (2021 onwards) has been included so that projects or services not
expected to be delivered for at least 4 years are not overlooked in future reviews of the Corporate Business
Plan and can also be factored into the financial projections in the Long Term Financial Plan. An assessment
of the actions listed in the current Corporate Business Plan hasn’t identified the need for any additional staff
Shire of Bridgetown Greenbushes Workforce Plan 2018 – 2022 27 | P a g eresources to deliver specific actions, other than the positions that are proposed under the organizational restructure undertaken as part of this new Workforce Plan. IMPACT OF THE KEY GOALS ON THE FUTURE WORKFORCE Key Goal One The strategies of this goal as above are dependent on having efficient, effective and customer focussed teams, particularly in Development and Community Services. The can-do approach will be a key driver. The creation of a new Planning Officer position will increase resources in this area and allow a greater focus on strategic planning tasks such as progressing the new town planning scheme and associated strategies and policies. The creation of the new dedicated customer service officer in ‘Development & Infrastructure’ will improve our customer service in this high demand area but will also free up technical staff to undertake a greater range of strategic tasks. Key Goal Two Will require the Parks and Gardens crew and Works Management to be resourced and skilled to a level that is able to deliver on this objective. It is noted that testing of the market for park mowing services is to occur. Key Goal Three Improvements to asset management and building maintenance are a critical success factor in achieving this goal, as well as having an efficient, effective and well-resourced roads construction and maintenance crew. Key Goal Four Community and recreation services teams will be key contributors to the achievement of this goal, and the current review and the structure and services will need to take this into account. Emergency and ranger services are also being reviewed to ensure they are resourced and skilled appropriately. Increasing resources for bushfire mitigation activities will help to make our area safer. Key Goal Five One of the goals that Council expressed in the review of the organisational structure was the freeing up of the CEO of his direct managerial/supervisory role in development services functions. The amalgamation of the current ‘Works & Services’ and ‘Planning & Environmental Services’ divisions and creation of a new Executive Management in this area will achieve that goal. A greater focus on organisational compliance will occur with a dedicated Administration Officer position for compliance being created. FUTURE OPERATING ENVIRONMENT NEEDS In looking for increased efficiency and improved customer service, the systems, processes and technology should be reviewed and updated as required to meet the strategic and operational needs of the Shire and its customers. This will happen in due course once the structure is implemented and all roles and positions are in place. ORGANISATIONAL STRUCTURE IMPLICATIONS Through the staff consultation process that included a survey and extensive and inclusive meetings between the staff the CEO and HR Officer, it has become clear that organisational structure changes are required, with some adjustment to roles and positions. The structure on the following page is proposed and will be implemented incrementally throughout 2019. A key point of difference is at the Executive management level, where Works and Development Services combine into a Development and Infrastructure Division. This reduced the number of reports to the CEO and allows him to be able to work more strategically to achieve Shire of Bridgetown Greenbushes Workforce Plan 2018 – 2022 28 | P a g e
the Integrated Planning and Reporting requirements and the Key Goals and Objectives of the Strategic
Community Plan.

Risk, Occupational Safety and Health and Governance have an increased focus

Asset management and building maintenance have improved coordination and support to better meet the
Shire’s requirements.

Community Services has an adjusted line management structure, and there is an increased focus on
customer service for the planning and development needs of the community.

Increased capability in emergency services , particularly in bush fire mitigation planning and works with the
introduction of the Emergency Services Coordinator.

The roles and reporting lines in the Infrastructure area are better defined for improved communication,
support and deficiency.

There are financial implications for some of these changes that are outlined in the pages that follow the
organisational structure diagram.

IMPLICATIONS FOR THE ASSET MANAGEMENT PLAN

There may be some fit out of the administration and workshop areas as a result of the organisational
structure changes and staff feedback re the workshop environment. These will be determined once the
structure is finalised and through the normal budget processes of the Shire

Shire of Bridgetown Greenbushes Workforce Plan 2018 – 2022                          29 | P a g e
ORGANISATIONAL STRUCTURE – PROPOSED 2019

  Shire of Bridgetown Greenbushes Workforce Plan 2018 – 2022   30 | P a g e
SUMMARY OF PROPOSED CHANGES TO THE ORGANISATIONAL STRUCTURE
As part of the restructure eight (either full-time or part-time) existing positions are to be discontinued and
nine new positions created. Four of the discontinued positions are either currently vacant or the incumbent
is leaving the organisation. One of the other positions is a fixed term contract position expiring in October
2019. The other three employees are entitled to redundancy however positions have been identified for two
of these employees as an alternative to redundancy if they wish. Also proposed is a market testing for
possible outsourcing of park mowing services with an existing vacancy on the parks and gardens team to
remain unfilled pending this exercise.
A summary of the changes is listed below under our existing structure:
OFFICE OF CEO
Human Resource Officer to become
Human Resource Coordinator but remains a
part time position.
Current ‘Senior Admin Officer’ (2 days
per week) to be replaced by a new
‘Administration Officer – Governance’
position (4 days per week). There have been
some preliminary discussions with a
neighbouring local government about their
taking the additional 1 day per week to make
it a shared full-time position.
A new ‘Emergency Services
Coordinator’ position (Shire funded for 3.5
days per week) is to be created. This position
will coordinate and report on fire mitigation
works as well as carry out on-ground
mitigation activities and other bush fire
related tasks. There is the possibility of
increasing the hours for this position using
external grant funds.
The current Fire Protection Officer
position is to be discontinued.
A review of the structure and requirements of Ranger Services is to be undertaken by December
2019.
Emergency Services (CESM) and Ranger Services will continue to report to CEO with any changes to
reporting lines for Ranger Services to be addressed in above review.
Shire of Bridgetown Greenbushes Workforce Plan 2018 – 2022 31 | P a g eWORKS & SERVICES AND PLANNING & ENVIRONMENTAL SERVICES
Amalgamation of Works & Services and Planning & Environmental Services to form new
‘Development & Infrastructure’ Division
Creation of a new ‘Executive Manager Development & Infrastructure position.
Current ‘Executive Manager Works & Services’ position to be discontinued.
A new ‘Infrastructure Technical Officer’ position to be established’.
The ‘General Operations Coordinator’ position (currently vacant) has been discontinued.
A new 0.5FTE (18 hours per week) Works Admin Officer position will be created.
The Principal Building Surveyor will focus on building control. A 2nd Building Surveyor is only
required for partial leave coverage.
The current ‘Planning Administration Officer’ position is to be discontinued.
A new ‘Planning Officer’ position is to be created to enable the Manager Planning to take on more
strategic work.
The existing vacant position on the Parks & Gardens team is to remain unfilled pending the calling of
tenders for selected park mowing services with the amount of mowing to be equivalent to a single
FTE on the Parks & Gardens Team.
The existing Contractor Grader Operator position (3-year contract) will end in February 2020 with a
permanent staff replacement to be employed from then on.
A more hierarchical reporting structure has been established in the former “Works & Services”
department with Parks & Gardens and the Fleet Mechanic reporting upwards through the Works
Supervisor. Waste will report to the new ‘Infrastructure Technical Officer’ position.
Existing Parks & Gardens Supervisor retitled to ‘Team Leader Parks & Gardens’.
Shire of Bridgetown Greenbushes Workforce Plan 2018 – 2022 32 | P a g eCORPORATE SERVICES
A new position of ‘Customer Services Officer’ will be created. Although dealing predominantly with
development and infrastructure enquiries the position, like all other Customer Service Officers, will
report to Coordinator Corporate Services. The position will also oversee the administration of all
customer service requests across the organisation.
This position will be first contact point for general development queries (planning, building, health)
in order to free up time for Manager Planning, Principal Building Surveyor and Manager
Environmental Health. The position will also be able to offer some admin support services to key
staff when able subject to specifics being approved by Coordinator Corporate Services. In creating
this position there will be some minor title changes to other customer service officers.
A new position of ‘Building Operations Coordinator’ or ‘Coordinator Building Assets’ (title to be
confirmed) is to be created – responsible for managing building maintenance and building
operations, including cleaners. This will allow the Principal Building Surveyor and Manager
Environmental Health to focus on their core responsibilities.
Shire of Bridgetown Greenbushes Workforce Plan 2018 – 2022 33 | P a g eCOMMUNITY SERVICES
Existing ‘Grants & Services Manager’ position to be retitled to ‘Manager Community Development’.
The Leisure Centre Manager and Library Coordinator positions (both currently vacant) are to be
discontinued.
The Visitor Centre Manager role is also to be discontinued.
A new ‘Manager Recreation Services’ position is to be created with the position being responsible for
management of the leisure centre, library and visitor centre. This position will take a general
overseeing role over the 3 facilities with existing staff in each facility to absorb some of the tasks
previously performed by each facility manager. A review of responsibility for each staff member will
be done to ensure that Award levels are appropriate.
Paid staff hours at the Visitor Centre are to be reduced by 2 hours on weekdays to be 10.30am-
4.30pm and by 2 hours on Saturdays from 5 hours to 3 hours.
A reduction of Community Service Officers (Visitor Information) so that only one paid staff member is
employed on weekdays 10.30am-4.30pm, Saturdays, Sundays and Public Holidays 10.00am-1.00pm
noting that the visitor centre may open earlier and close later with volunteer attendance.
Small increase of hours for Youth Officer(s).
Shire of Bridgetown Greenbushes Workforce Plan 2018 – 2022 34 | P a g eYou can also read