2020 GLOBAL CONTAINER SHIPPING OUTLOOK - As a new era of fuel regulation dawns, carriers' pricing discipline is in the spotlight - AlixPartners
←
→
Page content transcription
If your browser does not render page correctly, please read the page content below
MARCH 2020

2020 GLOBAL
CONTAINER
SHIPPING
OUTLOOK
As a new era of fuel
regulation dawns,
carriers’ pricing discipline
is in the spotlight
2020 MARKS THE BEGINNING OF
A NEW ERA FOR THE CONTAINER
SHIPPING INDUSTRY.

January 1 brought with it the implementation of a                                 THERE IS CAUSE FOR CONCERN.
regulation issued by the International Maritime Organization
known as IMO 2020, which requires carriers to limit the                           Amid signs that container shipping revenues will remain flat
sulfur content of the fuel they burn to 0.5%—a drastic                            or increase only slightly in 2020 as demand growth sags
reduction from the previous cap of 3.5%. The aim of the                           below the peaks of earlier years (figure 1), the industry’s
mandate, one of the most substantial and far-reaching                             financial condition remains perilous, with many carriers
regulatory changes in the marine shipping industry’s                              laboring under heavy debt burdens. Chronic overcapacity
history, is to sharply reduce the sulfur emissions of the                         has afforded carriers little leverage in price negotiations
sector, which, according to the United Nations, transports                        for much of the past decade. And now comes a regulatory
some 90% of the world’s trade. But the regulation’s impact                        mandate that will drive a sudden and massive increase
will be felt across a whole range of fuel-consuming                               to the industry’s cost base. There is evidence that some
businesses, as carriers compete for supplies against other                        carriers have for years used fuel-price surcharges to
industrial users. The competition will likely lead to a spike in                  supplement profits and that they continue to do so as
demand—and prices—for low-sulfur fuel oil (LSFO). Carriers,                       fuel prices reset during the implementation of IMO 2020.
shippers, and forwarders are all waiting to learn how well                        Whether carriers can continue that practice as fuel-market
the industry will withstand the shock—and whether carriers                        volatility subsides is an open question.
can maintain pricing discipline, which has historically
eluded the sector.

FIGURE 1: CONTAINER SHIPPING VOLUME VERSUS CELLULAR FLEET (GLOBAL, YEAR OVER YEAR % GROWTH)
10

 9

 8

 7
     6.0
 6                                                    5.6
                                                                                                                     5.1
 5                                                                                               4.8                                     4.8

                                                      4.1                   4.0
 4                          3.5
                                                                            3.9                  4.1
 3                          3.2
                                                                                                              Average of
 2                                                                                                            previous 5 years
     1.2                                                                                                      projected forward
 1

 0
  2015                     2016                       2017                 2018                 2019               2020F               2021F

      Global container volume growth (YoY)            Global TEU capacity growth (YoY)
Source: Alphaliner, Statista, AlixPartners analysis

2020 Global Container Shipping Outlook                                                                                                         2
We estimated in last year’s report that the spread between
LSFO and intermediate-fuel-oil (IFO) bunker costs could
drive up carriers’ fuel bill by at least $10 billion globally—          THE VERY SURVIVAL
including some $3 billion on the eastbound transpacific                 OF SOME CARRIERS
(EBTP) and Asia–Europe lanes, which account for about
20% of global trade (figure 2). That estimate appears                   WILL DEPEND ON THEIR
to be substantially correct, although if anything, it may               ABILITY TO PASS THEIR
understate the magnitude of the increase, which would
dwarf the industry’s profitability. The very survival of some
                                                                        HIGHER FUEL COSTS
carriers will depend on their ability to pass their higher fuel         ALONG TO THEIR
costs along to their customers. In that context, carriers face
a vital strategic choice: whether to burn LSFO or to invest in
                                                                        CUSTOMERS.
scrubbers that would enable them to continue to burn IFO.

FIGURE 2: ROTTERDAM IFO VERSUS LSFO BUNKER PRICING ($/TON)
$650

$600

$550

$500

         $150 spread
$450
                                                                                                                 ~$275 spread
$400

$350

$300

$250

$200
       Jan         Feb        Mar        Apr    May    Jun        Jul     Aug       Sep       Oct       Nov      Dec
        19          19        19         19     19      19        19       19        19       19        19       19

        IMO implementation period        LSFO    IFO
Source: Bunkerworld

Complicating matters is widespread dissatisfaction with            that some carriers are using the BAF as a revenue-raising
the variety of formulas that carriers use to calculate the         tool as well as a cost-recovery and risk-sharing mechanism.
energy-cost burden that shippers should bear—known                 The uncertainty can lead to fraught negotiations and
as the bunker adjustment factor (BAF). Every carrier has           frayed relationships that take a toll on both sides and add
its own variation on the basic formula, which relies on            to the headwinds the container shipping industry faces as
assumptions about prevailing bunker prices, the size and           it sails into what could be one of the most complex and
fuel consumption of a typical container vessel on a given          consequential years in its history.
route, capacity utilization, distance traveled, and difference
in tonnage between head-haul and back-haul cargoes,                If there’s an upside to the fuel-market turmoil for carriers,
among other variables. The lack of transparency and                it’s the opportunity to reprice fuel while uncertainty still
standardization of those variables is a constant irritant          prevails. The terms they set now will be difficult to unwind
to shippers, freight forwarders, and nonvessel-operating           even if surcharge formulas are eventually standardized.
common carriers (NVOCCs) and gives rise to the suspicion

2020 Global Container Shipping Outlook                                                                                             3
NEW YEAR, SAME OLD WORRIES
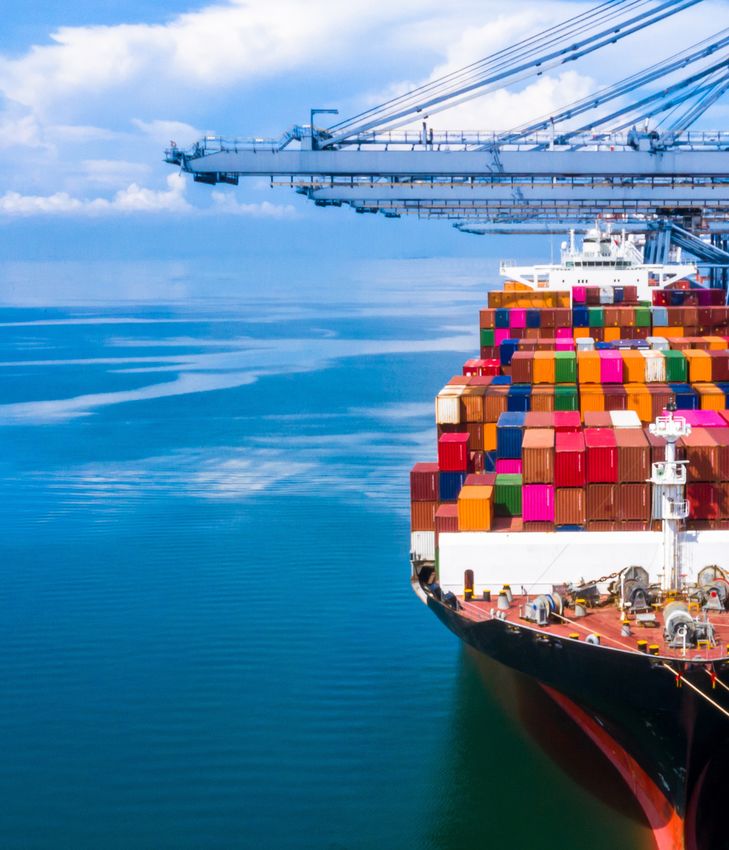
2019 offered carriers little relief from the financial anxiety As that stubbornly low Altman Z-score would suggest,
that has been a constant in the industry since at least 2010. the industry’s total debt grew by $21 billion in the 12
The collective Altman Z-score1 of the 14 container shipping months ending September 30, 2019. A full $15 billion
companies that publish their financials deteriorated of the increase is attributable to two large carriers that
markedly in the 12 months ending September 30, 2019, increased the debt on their books by a total of $13 billion
falling to 1.16 from 1.35 in all of 2018 and thereby signifying to comply with a new accounting rule—International
a rising probability of bankruptcy (figure 3). Reductions in Financial Reporting Standards (IFRS) 16, which governs the
asset turnover and market equity versus debt ratios drove treatment of leases. In other words, most of the increase in
the Z-score down versus the previous year. The score—the debt is accounting driven and not reflective of any change
lowest in the 10 years we have tracked the number—is a in the operating environment.
worrisome indicator for both carriers and shippers, whose
memories of Hanjin Shipping’s 2016 collapse are still fresh.
FIGURE 3: AVERAGE ALTMAN Z-SCORE
2.5
2.13
2.0
1.8
1.52 1.48
1.5 1.44 1.46
1.35 1.35
1.25 1.24
1.16
1.0
0.5
0
2010 2011 2012 2013 2014 2015 2016 2017 2018 LTM
Source: CapIQ, company reports, AlixPartners analysis
1. The Altman Z-score is a metric that gauges a company’s credit strength and the likelihood that the company will seek bankruptcy protection within the coming
24 months; a score of 1.8 or lower signals a high risk of bankruptcy.
2020 Global Container Shipping Outlook 4FIGURE 4: TOTAL DEBT VERSUS GLOBAL CELLULAR FLEET CAPACITY
120 25
104.6
99.9
100 92.6 94.8
20
87.4 89
G LO B A L T E U C A PA C I T Y
83 82.7
76.3
TOTA L D E B T ($ B)
80 74.3
15
60
10
40
5
20
0 0
2010 2011 2012 2013 2014 2015 2016 2017 2018 LTM
Total debt ($US billion) Debt increase due to IFRS 16 Global TEU capacity
Source: Alphaliner, CapIQ, company reports, AlixPartners analysis
The relatively subdued expansion of debt suggests that the suggests that any financial shocks in the coming months
overcapacity that has plagued the industry for years may be could shift some carriers’ finances from worrisome to
easing. Total capacity, measured in twenty-foot-equivalent downright distressed (figure 5). In light of the carriers’
units (TEUs), rose a modest 4% in the last 12 months, which heightened vulnerability, industry stakeholders should
explains the industry’s lower capital expenditures in 2019 be alert to any potential disruption caused by efforts to
and indicates that supply and demand may be approaching contain the spread of the coronavirus. Container volumes
equilibrium (figure 4). at Chinese ports have fallen off sharply since the outbreak
began. Carriers risk undermining their own efforts to
Such relief could not come too soon for carriers, whose recover profits if they fall back on old habits of chasing
leverage ratio rose 3% in the past 12 months, to 8.7x. That volume for the balance of the year.
increase, though modest compared with earlier years,
FIGURE 5: LEVERAGE RATIO (DEBT TO EBITDA)
10
9 8.4 8.4 8.7
8 7.5
7
6.2
6 5.5 5.5 5.3
5
4.0
4
3
2.2
2
1
0
2010 2011 2012 2013 2014 2015 2016 2017 2018 LTM
Source: CapIQ, company reports, AlixPartners analysis
2020 Global Container Shipping Outlook 5FIGURE 6: EBITDA VERSUS CARRIERS REPORTING NEGATING EBITDA (FULL YEAR)
18% 7
16%
16%
6
14%
COUNT OF CARRIERS
5
E B I T D A M A R G I N (%)
12% 11%
10% 10% 4
10% 9% 9%
8%
8% 7% 3
6%
6%
4% 2
4%
1
2%
0% 0
2010 2011 2012 2013 2014 2015 2016 2017 2018 LTM
EBITDA % Negative EBITDA
Source: CapIQ, company reports, AlixPartners analysis
There is some good news to offset the more-downbeat data, however. The EBITDA margin of the carriers that
report their financials rose to 9% in the last 12 months from 6% in all of 2018, whereas no carriers reported
negative EBITDA (figure 6). Profitability was stronger in the third quarter of 2019, with EBITDA margin rising to
11% (figure 7). But profitability remains well below its historical peak.
FIGURE 7: Q3 REVENUE VERSUS EBITDA MARGIN
100 20%
90
80
15%
70
Q 3 R E V E N U E ($ B)
Q 3 E B I T D A (%)
60
51
50 45 45 45 46 10%
43 40 42
40 35 39
30
5%
20
10
0 0%
2010 2011 2012 2013 2014 2015 2016 2017 2018 LTM
Revenue EBITDA
Source: CapIQ, company reports, AlixPartners analysis
2020 Global Container Shipping Outlook 6FIGURE 8: ALL-IN SPOT RATES
A si a - Eu ro p e We s tb o u n d: N o r t h e r n Eu ro p e ($ / T E U ) E as tb o u n d Tr a ns p a c if i c: U S We s t C o as t ($ / F E U )
$2,500 $2,500
$2,000 $2,000
$1,500 $1,500
$1,000 $1,000
$500 $500
$0 $0
Jan Feb Mar Apr May Jun Jul Aug Sep Oct Nov Dec Jan Feb Mar Apr May Jun Jul Aug Sep Oct Nov Dec
19 19 19 19 19 19 19 19 19 19 19 19 19 19 19 19 19 19 19 19 19 19 19 19
IMO implementation period
Source: Shanghai Container Freight Index
Lower fuel costs appear to have accounted for some of boosted all-in rates along the Asia–Europe lanes, where
the improved profitability, indicating that carriers’ pricing spot rates negotiated by freight forwarders and NVOCCs
discipline has improved—or that they’re using the BAF to are the prevailing pricing mechanisms. Similarly, we
prop up their revenues, or both. The data also suggests that see BAF charges increasing on the shorter, eastbound
carriers are starting to take a firmer grip on their operating transpacific routes, where shippers typically negotiate
expenses, which will stand them in good stead in what will contracts that break out the BAF as a separate charge. As
likely be volatile fuel markets in 2020 (figure 8). carriers’ uptake of LSFO has accelerated, BAF rates along
the eastbound transpacific lane have kept pace, increasing
The fourth quarter of 2019 may provide a better indication to levels comparable to historical IFO recovery premiums
of the success of carriers’ cost recovery efforts, on which (figure 9). However, carriers may struggle to maintain
their future depends. We see two signs that carriers’ initial surcharges at their current level as shippers push for more-
attempts to recover larger fuel costs driven by IMO 2020 transparent BAF calculations and as other powerful forces
have been successful. First, carriers have successfully converge to drag down rates.
WE SEE TWO SIGNS THAT CARRIERS’ INITIAL ATTEMPTS TO RECOVER LARGER
FUEL COSTS DRIVEN BY IMO 2020 HAVE BEEN SUCCESSFUL
FIGURE 9: CARRIER FUEL COST COVERAGE
A si a - Eu ro p e We s tb o u n d E as t b o u n d Tr a n s p a c if i c
($ B A F a n d c a r r i e r f u e l c o s t p e r T E U ) ($ B A F a n d c a r r i e r f u e l c o s t p e r T E U )
$1,200 $600
$1,000 $500
$800 $400
$600 $300
$400 $200
$200 $100
$0 $0
Jan Mar May Jul Sep Nov Jan Mar May Jul Sep Nov Jan Jan Mar May Jul Sep Nov Jan Mar May Jul Sep Nov Jan
18 18 18 18 18 18 19 19 19 19 19 19 20 18 18 18 18 18 18 19 19 19 19 19 19 20
IMO implementation period LSFO IFO380 BAF
Source: Drewry, Bunkerworld, AlixPartners analysis
2020 Global Container Shipping Outlook 7As figure 10 makes clear, there is no standard BAF formula Such calculations will have to take into account the various
in use across the board, nor is there any widely recognized means of reducing sulfur content. Most carriers will likely
mechanism to account for the effects of the various sulfur opt to burn LSFO, and only a few carriers serving certain
reduction methods—such as use of low-sulfur fuel oil, niche ports and markets will undertake costly refits of their
scrubbers, and liquefied natural gas—on the type of fuel vessels to burn liquefied natural gas. A larger minority of
used and the amount consumed. Frustration with the carriers will opt to install scrubbers—filters that capture
opacity around BAF charges will likely cause some of the sulfur emissions as IFO gets burned. Most carriers will use
megashippers, freight forwarders, and NVOCCs to propose a combination of solutions across their fleets, making a
their own formulas and press for adoption. Those same clear view of fuel consumption nearly impossible. With the
megashippers using the eastbound transpacific route have current cost spread between IFO and LSFO fuels hovering
historically represented the driving force for changes in the in the $200 to $300 range globally, the case for investing
way carriers do business, and it seems likely that they will in scrubbers is, for the moment, highly compelling. Each
play that role again in the case of BAF calculations, wherein different type of scrubber, however, comes with its own
the contracting process will drive movement pros and cons, and any boost to revenue or earnings that
toward transparency and standardization. comes from investing in scrubbers could be short-lived
if the fuel-price spread collapses. Moreover, we believe
that the regulatory framework governing the use of this
technology will continue to evolve and may ultimately
reduce returns on scrubber investments.
FIGURE 10: CONTAINER LINES PUSH LOW-SULFUR FEES
Fuel price per ton Fuel price per ton
x Trade factor x (fuel consumption + TEU carried)
(average fuel consumption on a trade lane,
accommodating variables like transit time,
fuel efficiency, headhaul-backhaul imbalance)
BUNKER ADJUSTMENT FACTOR (BAF) MARINE FUEL RECOVERY (MFR)
To be applied: Jan 1, 2019 Cost to annual fuel bill: $2 billion To be applied: Jan 1, 2019 Cost to annual fuel bill: $1 billion
Fuel price per ton Fuel consumption
x Trade factor x (Current bunker price minus base
(fuel consumption per round trip bunker price) + cargo loaded onboard
+ TEU carried) x Trade factor
BUNKER CHARGE MECHANISM (BRC) FUEL COST RECOVERY CHARGE (FCR)
To be applied: Jan 1, 2019 Cost to annual fuel bill: $2 billion To be applied: Mar 1, 2019 Cost to annual fuel bill: Not specified
Fuel price per ton Fuel price per ton
x Trade coefficient x Trade wise loading factor
x Trade imbalance
BUNKER ADJUSTMENT FACTOR (BAF) ONE BUNKER SURCHARGE (OBS)
To be applied: Jan 1, 2019 Cost to annual fuel bill: $160/TEU To be applied: Jan 1, 2019 Cost to annual fuel bill: Not specified
(all contracts with a minimum (which works out to $3 billion with (applies to all new contracts
validity of three months) 19 million TEU handled in 2017) starting on or after Jan 1, 2019 and
valid until further notice. Existing
contracts subject to previous BAF
Source: JOC.com until contracts expire)
2020 Global Container Shipping Outlook 8KEY TAKEAWAYS
The coming year presents players in the container shipping industry with a host of stiff
challenges and difficult trade-offs that will vary by their roles in the industry’s ecosystem.
Specifically:
Carriers enjoyed a recovery in profitability in 2019. But they could see those gains evaporate if they fail to
01
control costs—above all, their fuel costs. The long-term benefits of scrubbers remain to be seen but initial
returns could be strong based on the fuel cost spread. Carriers will need to carefully consider if and how
they will go about converting more vessels. In addition, some of the smaller and more-remote ports may
be challenged to secure adequate LSFO supplies, which could influence carriers’ deployment strategies.
02 Freight forwarders may see an uptick in profitability, as they historically have
prospered from increases in shipping rates and complexity.
Shippers will likely take the lead in determining how carriers will recover their higher fuel costs, but they
03
should expect increases in their fuel adjustment charges or all-in rates. They should also be mindful of
the rising risk of carrier bankruptcies. Four years on from Hanjin’s costly and disruptive collapse, the
industry’s finances remain precarious; and shippers, freight forwarders, and NVOCCs should assess the
viability of individual carriers and consider spreading their business among several lines.
04
Investors should keep close tabs on carriers’ debt levels, cost management, and
profitability and be alert to any unforeseen declines in shipping volumes or rates—
especially on the Asia–Europe and transpacific lanes.
AS CONTAINER SHIPPING
ENTERS A NEW ERA,
PREPARING FOR THE
WORST MAY BE THE BEST
WAY TO AVOID IT.
2020 Global Container Shipping Outlook 9CONTACT THE AUTHORS: Esben Christensen Jeff Drake Marc Iampieri Managing Director Managing Director Managing Director +1 646 746 2496 +44 20 7098 7612 +1 646 746 2430 echristensen@alixpartners.com jdrake@alixpartners.com miampieri@alixpartners.com Lian Hoon Lim Jim Blaeser Jason Keyes Managing Director Director Director +852 2236 3525 +1 212 297 1599 +1 212 561 4185 llim@alixpartners.com jblaeser@alixpartners.com jkeyes@alixpartners.com Brian Nemeth Henry Pringle Jesse Bermensolo-Cutler Director Director Business Intelligence Manager +1 646 746 2492 +44 20 7098 7653 +1 214 647 7644 bnemeth@alixpartners.com hpringle@alixpartners.com jbermensolocutler@alixpartners.com Maxim Vanhencxthoven Senior Vice President +44 20 7332 5218 mvanhencxthoven@alixpartners.com ABOUT US For nearly forty years, AlixPartners has helped businesses around the world respond quickly and decisively to their most critical challenges – circumstances as diverse as urgent performance improvement, accelerated transformation, complex restructuring and risk mitigation. These are the moments when everything is on the line – a sudden shift in the market, an unexpected performance decline, a time-sensitive deal, a fork- in-the-road decision. But it’s not what we do that makes a difference, it’s how we do it. Tackling situations when time is of the essence is part of our DNA – so we adopt an action-oriented approach at all times. We work in small, highly qualified teams with specific industry and functional expertise, and we operate at pace, moving quickly from analysis to implementation. We stand shoulder to shoulder with our clients until the job is done, and only measure our success in terms of the results we deliver. Our approach enables us to help our clients confront and overcome truly future-defining challenges. We partner with you to make the right decisions and take the right actions. And we are right by your side. When it really matters. The opinions expressed are those of the authors and do not necessarily reflect the views of AlixPartners, LLP, its affiliates, or any of its or their respective professionals or clients. This article 2020 Global Container Shipping Outlook (“Article”) was prepared by AlixPartners, LLP (“AlixPartners”) for general information and distribution on a strictly confidential and non-reliance basis. No one in possession of this Article may rely on any portion of this Article. This Article may be based, in whole or in part, on projections or forecasts of future events. A forecast, by its nature, is speculative and includes estimates and assumptions which may prove to be wrong. Actual results may, and frequently do, differ from those projected or forecast. The information in this Article reflects conditions and our views as of this date, all of which are subject to change. We undertake no obligation to update or provide any revisions to the Article. This Article is the property of AlixPartners, and neither the Article nor any of its contents may be copied, used, or distributed to any third party without the prior written consent of AlixPartners. ©2020 AlixPartners, LLP
You can also read