2021 UBS WINTER INFRASTRUCTURE & ENERGY VIRTUAL CONFERENCE - JANUARY 12-13, 2021 - INVESTORS | NUSTAR ENERGY LP
←
→
Page content transcription
If your browser does not render page correctly, please read the page content below
2021 UBS
Winter Infrastructure & Energy
Virtual Conference
January 12-13, 2021

                             North Beach Corpus Christi, TX
                                                         1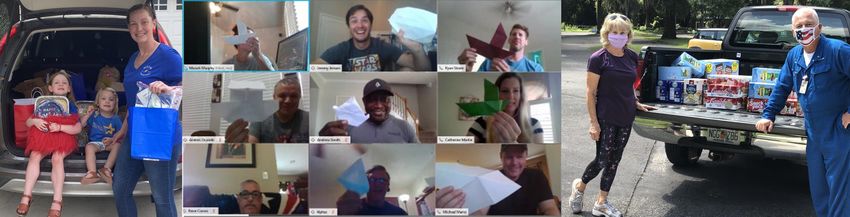
Forward-Looking Statements

Statements contained in this presentation other than statements of historical fact are forward-looking
statements. While these forward-looking statements, and any assumptions upon which they are based, are
made in good faith and reflect our current judgment regarding the direction of our business, actual results will
likely vary, sometimes materially, from any estimates, predictions, projections, assumptions or other future
performance presented or suggested in this presentation. These forward-looking statements can generally be
identified by the words "anticipates," "believes," "expects," "plans," "intends," "estimates," "forecasts," "budgets,"
"projects," "could," "should," "may" and similar expressions. These statements reflect our current views with regard
to future events and are subject to various risks, uncertainties and assumptions.

We undertake no duty to update any forward-looking statement to conform the statement to actual results or
changes in the company’s expectations. For more information concerning factors that could cause actual
results to differ from those expressed or forecasted, see NuStar Energy L.P.’s annual report on Form 10-K and
quarterly reports on Form 10-Q, filed with the SEC and available on NuStar’s website at www.nustarenergy.com.
We use financial measures in this presentation that are not calculated in accordance with generally accepted
accounting principles (“non-GAAP”) and our reconciliations of non-GAAP financial measures to GAAP financial
measures are located in the appendix to this presentation. These non-GAAP financial measures should not be
considered an alternative to GAAP financial measures.

                                                                                                                         2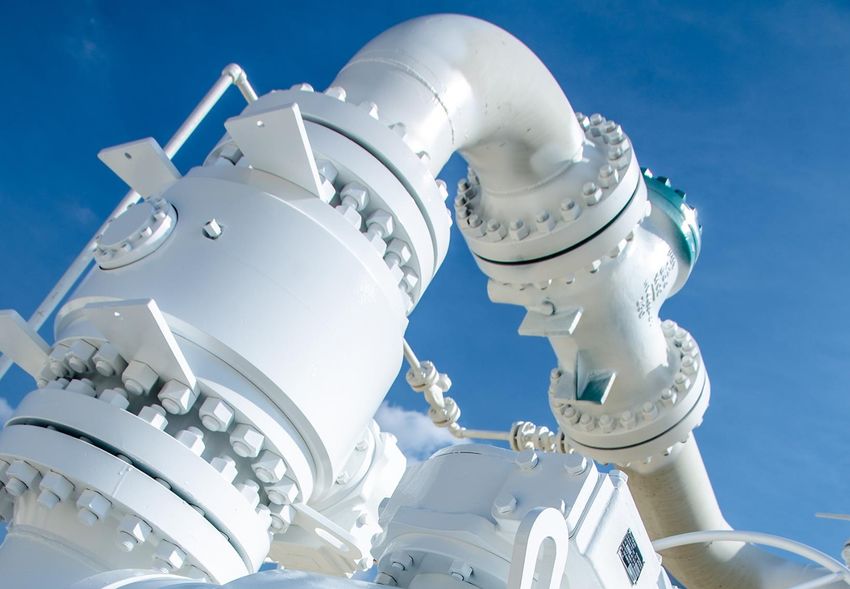
Introduction

               South Texas Crude System
                                     3
After a Year Full of Challenges, NuStar is Well-positioned
              for 2021

 Strong Coverage

 Lower Leverage
                                                                •Common Unit Price(1): $15.16
                                                                •Distribution/CU/Year:        $1.60
                                                                •Yield(1):                      10.6%
                                                                •Market Cap :  (1)            ~$2 billion
                                                                •Credit Ratings:
Simplified Structure/                                                ➢ Moody’s:        Ba3
   Governance                                                        ➢ S&P:            BB-
                                                                     ➢ Fitch:          BB-
                                                                •Enterprise Value:            ~$6 billion
                                                                •Total Assets:                ~$6 billion
                                                                •Pipeline Miles:              ~10,000

                                                     NYSE: NS
                                                                •Pipeline Volumes :(2)         1.8MMBPD
  No IDR Burden                                                 •Storage Capacity:            ~72MMB
                                                                •Storage Throughput Volumes(2): 498MBPD

  Maximized Self-        1. As of January 8, 2021
                         2. Average daily volume for nine months ended September 30, 2020
    Funding
                                                                                                        4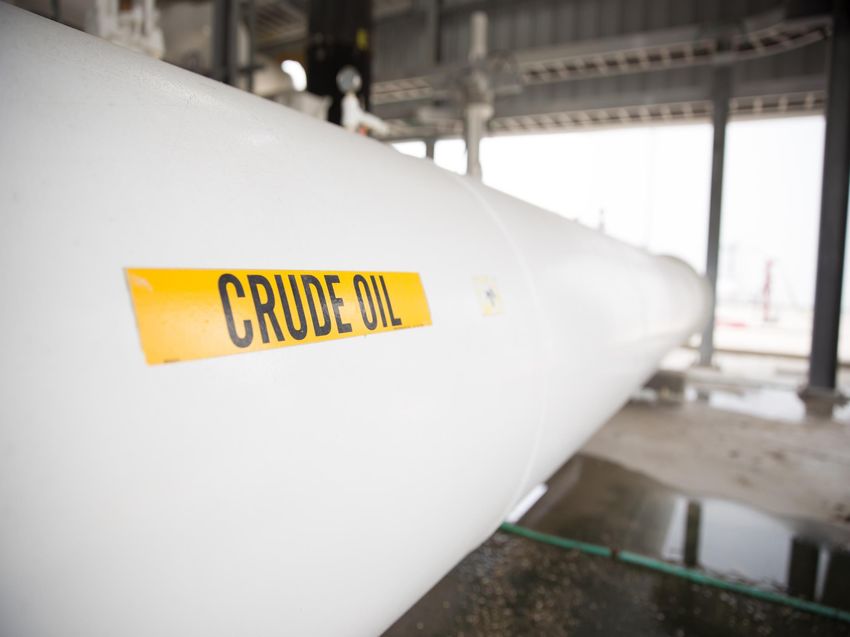
Last Year, Faced With Unprecedented Challenges, We
Took Decisive Action and Remained Focused on Our
Priorities…

                                                     5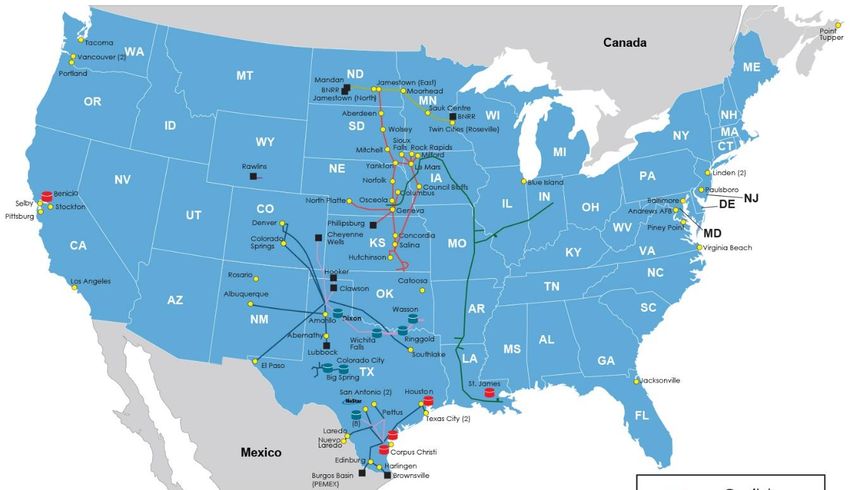
… And This Past Quarter, We Again Delivered Solid
                          and Stable Financial Results…

                                                  Operating Income

          3Q                                                                                                   3Q
         2019                                                                                                 2020
                                                   Adjusted EBITDA
                                                     (Continuing
                                                    Operations)

1 - Please see Appendix for reconciliations of non-GAAP financial measures to their most directly comparable GAAP measures

                                                                                                                             6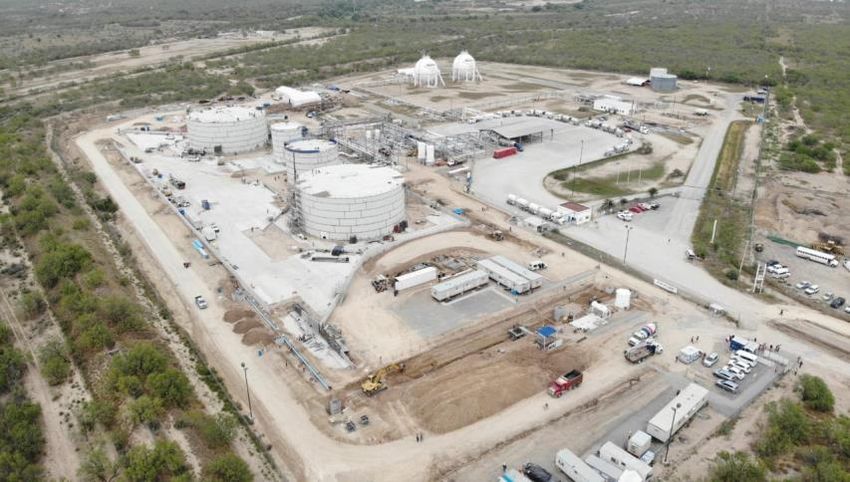
… Along With Strong Operational Performance Across
                Our Footprint

★ Our pipeline systems have rebounded strongly, and several of our terminals will continue to
  benefit from spring contango in 2021

             PIPELINE
            SEGMENT
                            West Coast- 100%                                                          Point Tupper- 100%
Transported over
204MM bbls Crude +                                                            Central East
Refined Products                            Central West            110% (Comparison of YoY refined
through our pipelines                                                90%
                                                                            product demand)
                                  150% (Comparison of YoY refined
and terminals during                      product demand)            70%            90%    85%
3Q20
                                  100%                                      80%                        East Coast- 100%
                                                                     50%
                                   50%            100%    80%
                                           65%                              April   Oct    Nov
                                    0%                                      2020    2020   2020
                                          April   Oct     Nov
                                          2020    2020    2020
            STORAGE
            SEGMENT                       South Texas
                                    (Comparison of YoY refined
Successfully                           product demand)                        Gulf Coast- 100%
                                 100%
contracted 100% of our
                                  50%             105%
storage across our                       75%             100%

footprint                          0%
                                         April    Oct    Nov
                                         2020     2020   2020

                                                                                                                           7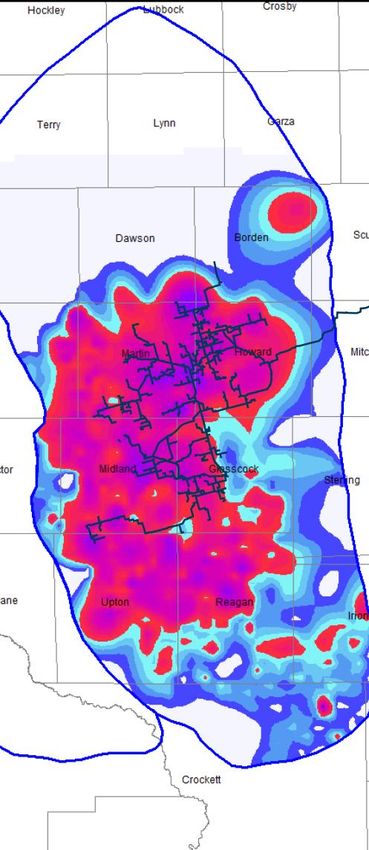
Thanks to Our Employees’ Perseverance and Hard Work,
                          We Expect Solid Full-Year 2020 Results…

                2020 Actions                                                              2020
                       Maintained Reliable Operations &
                       Industry-leading Health & Safety                                 Guidance
                                    Record

                                   Reduced
                        2020 Strategic Capital Spending
                                                                                        Adjusted EBITDA
                                     46%*                                                $690-730 MM
                                      Reduced
                                    2020 Expenses
                             $50-55 million*
                      Issued $1.2 billion of Senior Notes to
                        Address Maturities through 2025

                              Closed on Sale of
                       Terminal Facility in December for
                                $106 million
*- Compared to pre-COVID 2020 guidance for spending/expenses
1 - Please see Appendix for reconciliations of non-GAAP financial measures to their most directly comparable GAAP measures
                                                                                                                             8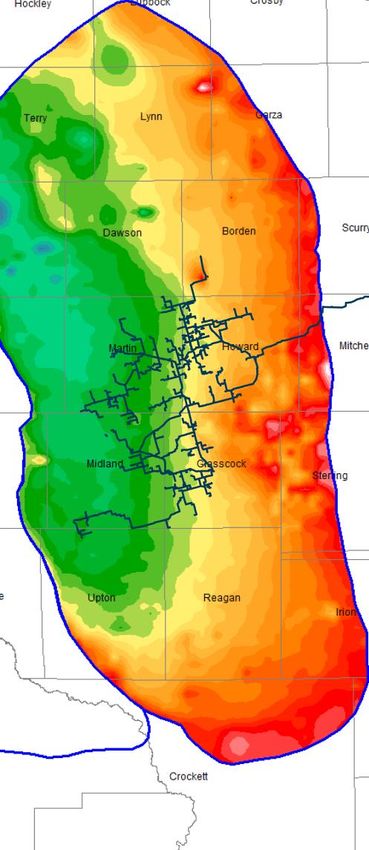
… And We Expect to Continue to Demonstrate Financial
   Strength and Stability in 2021

                                  Expect to Generate
                                     2021 EBITDA
                                  Comparable to 2020
                                    Adjusted EBITDA

   2021
Expectations                             &
                                    Expect to Fund All
                                      NuStar’s 2021
                                   Spending From Our
                                  Internally Generated
                                       Cash Flows

                                                          9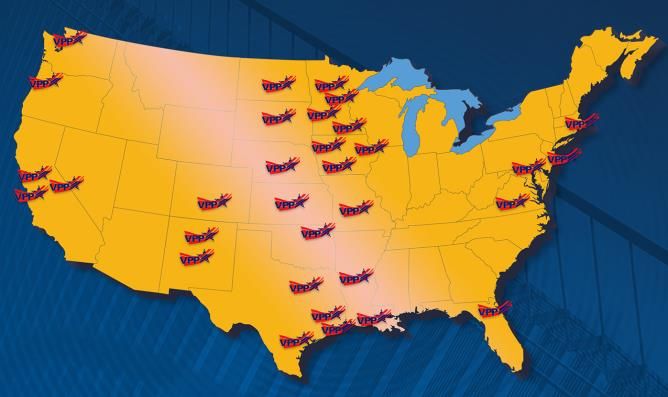
In 2021, We Plan to Release Our First Sustainability Report to
Tout the Critical Importance of the Services We Provide and
NuStar’s Proud Tradition of “ESG” Excellence

                                                             10
Pipelines Provide the Most Efficient and Safest Way to
Transport the Energy That Powers Our Everyday Life
Transporting the Volume Pipelines are the Safest Mode of
NuStar Moves in ONE DAY Would Require: Energy Transportation:
11,000 Trucks 37 Unit Trains ❑ Rail is over 4.6 times more likely than
pipelines to experience an incident
❑ Trucks are 6 times more likely than
pipelines to experience an incident
Pipelines’ Proportion of Emissions
0.7% 0.5%
Sources: ARC Energy Research Institute, using input data from the U.S. Department of Energy National Energy Technology Laboratory to define the U.S. Refined Average (2014)
*U.S. Refined Average (2014); Student Research Associate, Strata
11For 20 Years, NuStar has Been Protecting Our Employees,
the Environment and Our Communities Because We Truly
Believe That’s the Right Thing to Do
★ Our safety statistics reflect our commitment to safe,
responsible operations
❑ In 2019, as in years past, we performed substantially
better than our peers
➢ 21.5 times better than the Bureau of Labor Statistics (BLS)
comparison data for the Bulk Terminals Industry
➢ 6.2 times better than the BLS data for the Pipeline
Transportation Industry
★ NuStar has received the International Liquids
Terminals Association’s (ILTA) Safety Excellence
Award 10 times
❑ ILTA reviews its members’ safety reports filed with
OSHA, and recognizes member companies that
achieve exemplary safety statistics with an award
★ We participate in the OSHA Voluntary Protection
Program (VPP), which promotes effective worksite
safety and health
❑ Achieving VPP Star Status requires rigorous OSHA
review and audit, and Star Status requires renewal
every three years
❑ 85% of our U.S. terminals are VPP-certified
1 – Industry averages derived from 2011-2019 Bureau of Labor Statistics (BLS) Data.
12Our Report Will Reflect More of the Statistics, Record and
Rankings That Demonstrate How Much NuStar Cares,
Contributes and Shares
★ NuStar has been recognized for its strong
corporate culture with numerous awards
❑ NuStar has been recognized 11 times in
Fortune’s Annual “100 Best Companies to Work
For” list Ranked
#13!
★ NuStar employees contributed 83,000 volunteer hours in
2019 alone
❑ NuStar maintains local volunteer councils in each
community in which we operate to contribute to the
charitable and civic causes unique to that local community
★ Since 2007, NuStar’s employees have hosted a golf
tournament to support Haven for Hope, a
transformational campus in San Antonio that addresses
homelessness
❑ The tournament has generated an aggregate of over $42
million for Haven for Hope
13In 2020, Although Many of Our Employees Worked
Remotely, We are Proud of the Strength of Our Support of
Each Other and Our Communities
Ranked
★ 100% of our U.S. employees contribute to our United Way
#62! campaign, and our average per capita contribution is the
highest in the nation for a company our size
❑ NuStar’s total 2020 contribution was $4.8 million
★ NuStar employees log approximately 85,000 volunteer hours
Ranked annually
#46!
14… And Demonstrate Further That NuStar’s Governance is
Aligned With Our Unitholders’ Interests
No IDRs Annual Unitholder Meetings
NS Board of Directors 100% Attendance for 2020 Board & Committee Meetings
78% Independent Directors 11% Women
Nominating,
Compensation
Audit Committee Governance &
Conflicts Committee Committee
Majority of Officers’ Compensation Tied to Performance
NS Management and Unit Returns
Governance, Ethics & Cyber Risk Governance
Sustainability Committee
Compliance Committee Committee
15We Are Focused on Our Strategic Priorities for 2021
Working to
Fund Continuing to Promoting
Spending Take Steps to NuStar’s
From Internally Improve Our ESG
Generated Debt Metrics Excellence
Cash Flows
16We Remain Confident That Product Demand
Rebound is the First Step on the Road Back to Shale
Production Growth in 2021-2022
U.S. Shale
Production
Growth
Higher
2021-22 Crude
Prices
Crude
Demand
Recovery
Increased
2020 Refinery
Utilization
Refined Product
Demand
Rebound
17Overall U.S. Gasoline and Diesel Demand is Expected to
Recover to 95% of Pre-COVID Levels in 1Q 2021…
★ In the second quarter of
2020, U.S. refined
products demand U.S. Refined Product Demand
dropped by 21% (as a % of Pre-COVID Demand)
99% 99% 100%
compared to January 100% 95% 94%
97%
95%
97% 97%
94% 95% 94%
92% 90% 91% 89% 90% 90%
2020, but by 1Q 2021, 90% 87% 87%
gasoline and diesel 80% 75%
80%
demand are expected to 70%
recover to pre-COVID 63%
60%
demand levels of 95% 53%
50%
❑ The recovery of jet 39%
40%
fuel demand is
expected to lag 30%
behind gasoline and 20%
diesel demand, as 10%
the airline industry
0%
continues to 1Q20 2Q20 3Q20 4Q20 1Q21 2Q21 3Q21 4Q21 2022
experience low flight Gasoline Diesel Jet Fuel
demand due to
COVID concerns
Source: EIA
18Refined Products Demand Continues to Demonstrate
Remarkable Resilience in the Markets Our Assets Serve
100%
90% 85%
80% 105% 100% 80%
65%
65%
★ 2020 EBITDA guidance range assumes 85% recovery
★ Slight decrease from October 2020 levels driven by operational issues at some of our customers’
refineries (unrelated to pandemic or economic recovery)
1 - Comparison of year-over-year demand
19U.S. Refinery Utilization Continues to Recover, Led by
Refiners in PADD 2 and PADD 3, Which NuStar’s Pipeline
Systems Serve
U.S. Refinery Utilization ★ Nearly all of NuStar’s pipeline
(by PADD, 2019-2021)
assets are located in in PADD 2
PADD 4
U.S.
90% 70% 83% and 3, where refinery utilization in
92% 64% 84%
2019 2020 2021 PADD 2 and 3 did not suffer the
Exit
Low
degree of deterioration
PADD 5
experienced by East and West
89% 58% 68% PADD 2 PADD 1 Coasts refiners in 2020
92% 70% 90%
NS
73% 45% 67%
★ Refinery utilization in PADD 2 and
Refined Products 3 is forecasted to recover ahead
Pipeline
of the rest of the U.S.
NS PADD 3
Crude Pipeline ❑ PADD 2 refiners benefit from
92% 74% 87%
NS lower supply costs with
Terminal access to nearby Canadian
Refinery as well as abundant U.S.
2020 2021
15.00
shale production
10.00 ❑ Complex Gulf Coast
Weighted Average
5.00
refineries can process lower-
Refinery Net Margin by
PADD ($/bbl) cost heavy crudes and
-
maximize production of high-
(5.00)
PADD I PADD II PADD III PADD IV PADD V margin products
Source: ESAI, Wood Mackenzie
20The Permian Basin- the World’s Largest, Most Resilient Shale Play-
is Expected to Resume Growth in 2022, and Our System has
Already Rebounded Ahead of the Rest of the Permian Basin
★ Because of its superior geology and
breakeven costs, the Permian U.S. Shale Production Outlook
10
Basin’s production is expected: Permian Rest-of-U.S.
❑ To exit 2020 at 3.8 MMBPD, 8
approximately 51% of the nation’s 3.6
MMBPD
6 4.3 3.6 3.2
total shale output 4
❑ Return to growth in 2022
2 3.8 3.9 4.4
★ Our system’s throughput volumes 3.7
are now up 18% above May 2020 0
2019 2020 2021 2022
lows, while the rest of the Permian is
up 11% from the May 2020 low
★ We averaged 423MBPD in the third NuStar's System Throughput Growth &
quarter of 2020 Recovery is Outpacing the Permian
Basin
Cumulative Monthly Growth (%)
280%
237%
240%
Permian Oil Production
MMBPD 200%
(2015-2030)
10 160%
WTI @ $30 120% 89%
WTI @ $60 80%
5 40%
*Through November 2020
0%
-
0
2015 2018 2021 2024 2027 2030 NS Growth Permian Growth
Source: EIA Drilling Productivity Report (November 2020), Rystad, ESAI
21Our Trimmed-Down Strategic Spending Program for 2020 and
2021 Focuses on Low-multiple Projects to Enhance Our Existing
Footprint
★ We expect to finish 2020 having spent at least 63% less on capital projects than we did in 2019
★ We continue to exercise strict capital discipline and execute on low-multiple projects that
enhance our existing footprint and improve our metrics
Total Estimated Total Estimated
2020 2021
Strategic Strategic
Spending: Spending:
165-185MM 135-175MM
West Coast Permian Crude N. Mexico Gulf Coast Storage
Renewable Fuels Pipeline System Refined Products and Export
Storage ~$60MM in 2020 ~$10MM in 2020
Supply
~$20MM in 2020 (~$50MM in 2021) ~$10MM in 2020
(~$50MM in 2021)
22WEST COAST RENEWABLE FUELS STORAGE
Aggressive West Coast Carbon Emissions Reduction Goals Continue
to Generate Growing Demand and Dislocations That Require
Midstream Solutions
★ Regulatory priorities on the West Coast are
International dramatically increasing demand for renewable fuels
Tacoma
Exports in the region
Vancouver ★ At the same time, obtaining permits for greenfield
projects in the region is difficult, which increases the
Portland
value of existing assets
★ Our terminals have the access to facilities necessary
Singapore to receive bio-fuels from outside the region and to
Supply Midwest
Supply provide a base for distribution of renewable fuels
across the West Coast
Transportation Fuel Supply With Low -Carbon
Selby Fuel Standard Compliance From Petroleum
NV and AZ Diesel Alternatives
Exports Diesel Volume, Thousand BPD 250
Pittsburg Stockton 200
150
100
Wilmington Gulf
Coast 50
Supply
0
2018 2019 2020 2021 2022 2023 2024 2025 2026 2027 2028 2029 2030
Fossil Diesel Biomass-Based + Renewable Diesel
Source: IHS Markit © 2018 IHS Markit
23WEST COAST RENEWABLE FUELS STORAGE
NuStar has Partnered With Key Customers to Develop Renewable
Fuels Storage Projects at Several of Our West Coast Facilities
★ We have established ourselves as an early mover in the renewable fuels transportation
market by developing and completing a number of renewable fuels projects
★ These projects, in partnership with our customers on the West Coast, have allowed NuStar to
capture market share and build on relationships with key global producers
❑ Our facilities are positioned to benefit from new production and conversion supply projects for
renewable diesel, renewable jet, ethanol and other renewable fuels as the renewable fuels
market continues to grow
Complete
Convert 36,000 bbls to biodiesel NS West Coast Terminals
Portland 2017
Convert 57,000 bbls to renewable diesel
Renewables Growth (MBPY)
2018
Construct truck-loading for renewable diesel 1,600
Selby 1,446 1,438 2019
Convert 208,000 bbls to renewable jet fuel 1,400 2020 YTD
1,241
Convert 30,000 bbls to biodiesel 1,200
1,084 1,085
Convert 73,000 bbls to renewable diesel 1,000 883
and expand renewable diesel handling to
Stockton all 15 rail spots 800
645
602 582
Convert 151,000 bbls to renewable diesel 600
452
408
Connect to railcar ethanol offload facility 400
200 147 136
Convert 160,000 bbls to renewable diesel 102
Wilmington Reconfigure dock for enhanced marine 0
capability Portland Selby Stockton Wilmington
*Through November 2020
24WEST COAST RENEWABLE FUELS STORAGE
We Handle and Store a Significant Proportion of the Total Low-
Carbon Fuels Volumes Utilized in California, the Largest Driving
State in the Nation
NuStar’s Proportionate Share of
California’s Renewable Fuels Market
(By Volume in 1H 20201)
5% 15% 30%
BIODIESEL ETHANOL RENEWABLE
DIESEL
★ We expect these percentages to increase through 2023, along with
associated EBITDA, as we complete additional projects presently in
planning or under construction
1 – Most recent available data Source: ESAI
25PERMIAN CRUDE PIPELINE SYSTEM
With the “Backbone” of Our Now-700K-BPD System Complete, Our
Permian Spending Will be Focused on Scaling With Our Producers’
Gathering Needs
May 2017 Current Dedicated Acres 500,000
Scurry
Borden AMI 5,000,000
Colorado
System Capacity 220,000 700,000 NS CO CITY City
Receipt Points 122 298 TERMINAL
Pipeline Miles ~600 ~936
Storage (bbls) 900M 1.6MM NS BIG SPRING • PAA SUNRISE II
TERMINAL • PAA BASIN
• BRIDGETEX
DELEK BIG SPRING • SUNOCO PE & WTG
Martin
REFINERY
Howard
CENTURION Mitchell
PIPELINE
CENTURION SCR
STATION
ENTERPRISE NS STANTON
SUNPET TERMINAL
PAA
Glasscock
Midland
Midlan EPIC
d
Third-Party Connections
NuStar Truck Unloading Facilities
Upton
SUNOCO MIDKIFF Reagan NuStar Terminals
26PERMIAN CRUDE PIPELINE SYSTEM
Our “Core of the Core” Location has Attracted Top-Tier Customers
With Large DUC Inventories to Support Continued Recovery in 2021
★ The quality of geological formations underlying our system attracts the strongest customers
❑ Our creditworthy customers include majors and the most prolific E&Ps, both private and public, in the
basin, as well as large independent refiners and marketers
❑ ~75% of our system’s revenue is generated from investment-grade (IG) rated and Non-IG BB-rated
entities1
NS System Producer-type1
Highest-Quality (% Average Daily Volume)
“Rock”
Major
…And Produce Attracts 37% Producer Average Cost
Efficient Creditworthy, Private
Growth Across Diverse
of Debt, Weighted by
Cycles Producers 11% 52% Acreage:
Other
…That Apply Public 5.3%2
the Most
Advanced
Technology NS Permian Crude System
Performance
★ October and November receipts averaged (by Quarter)
~420MBPD, and we maintained our pace to exit 2020 * Adjusted
between 410 to 420 MBPD
★ Our producers still have over 430 drilled-uncompleted
(DUCs) wells on the system which they plan to bring
online over 18-24 months, which provide an important
platform for growth until rig counts start to recover
1 – September 30, 2020 MTD *
2 – As of December 7, 2020
3 – Please see Appendix for reconciliations of non-GAAP financial measures to their most directly comparable GAAP measures
27GULF COAST STORAGE & EXPORT
Gulf Coast Exports Held Up Well Through 3Q, and the Port of
Corpus Christi Remains the Leading U.S. Crude Export Hub
★ A significant proportion of the volumes transported on the additional 2.1MMBPD of
new long-haul pipeline capacity from the Permian to the Corpus area is moving out
over Corpus dock facilities
★ Corpus Christi, historically a regional refinery and domestic marine delivery hub, has
evolved into a major U.S. crude oil export hub
❑ Currently, Corpus Christi comprises half of the 3.0 MMBPD of Gulf Coast crude exports
❑ In July, Corpus Christi exports recovered to pre-COVID levels of 1.5MMBPD
❑ Analysts expect Corpus Christi exports to remain steady during the near-term with upside
potential as global crude demand recovers in late 2021
Corpus Christi
exports have
grown from
0.4MMBPD to
over 1.5MMBPD
and held up,
even through
2020
Source: RBN Energy
28GULF COAST STORAGE & EXPORT
We Continue to Export Permian Long-haul and Eagle Ford
Barrels From Our Corpus Christi North Beach Terminal
100 Series
1.0MMbbl .
400 Series
1.7MMbbl 200 Series
+0.4MMbbl Remaining Footprint 1.2MMbbl
Dock 15 Dock 16 Dock 2 Dock 1
(Light-loaded Suez) (Pana) Inland Barge (Light-loaded Suez)
In-bound Capacity Storage Capacity Out-bound Capacity
Current total: 1.2MMBPD Current total: 3.9MMbbl Current total: 1.2MMBPD
• South Texas Crude System 16” • Potential 0.4MMbbl • Ship docks - 750MBPD to 1.0MMBPD
Pipeline - 240MBPD • Refinery pipelines - 220MBPD
• Taft 30”- 720MBPD and expandable
• Harvest 16” Pipeline - 240MBPD
★ Our Corpus Christi North Beach Terminal Average CCCS Throughputs
is now receiving barrels from our South MBPD
Average CCCS Throughputs
Texas Crude Oil Pipeline System, our 12” 600 CCCS MVCs
Three Rivers Supply Pipeline and our 30”
pipeline from Taft, as well as from third- 400 377
673
party pipeline connections 591
200 296 386 440 380
❑ Average throughputs have 253 279
rebounded from our low in May to 0
back to slightly above MVC levels in July Oct Jan April May June July 3Q 2023
3Q 2019 2019 2020 2020 2020 2020 2020 2020
29GULF COAST STORAGE & EXPORT
Our St. James Facility Benefits From Price Dislocations From Pipeline
Constraints and Will Benefit From Export Growth as Those Constraints
are Resolved
★ Prior to March 2020, the lack of long-haul pipeline
capacity to transport WCS supply to Gulf Coast
demand generated price differentials that
supported unit train economics
❑ We have contract commitments for 30MBPD
through April 2022
❑ As Canadian production ramps back up, this
price dislocation is expected to re-emerge
and continue until Enbridge Line 3 is in service,
now estimated to occur by the end of 2021
★ We can also handle light Bakken barrels with our
rail facility, which may be an attractive
alternative to DAPL
★ We continue to work to assure our facility is
Canadian Crude Oil Production Outlook connected to the pipeline projects in progress to
MBPD
6,000 Rail Opportunity debottleneck shale plays, the region, as well as
5,000 the Midwest and beyond
4,000 ❑ In March 2019, Bayou Bridge began bringing
3,000 WTI light, Bakken and Canadian barrels either
2,000
for export or local use
1,000
❑ As soon as early 2022, Capline owners plan to
0
reverse its service to bring WTI, heavy
Canadian and Bakken crude for use in
Production Pipeline Takeaway Capacity regional refineries and export to other
Source: ESAI locations
30N . M E X I C O R E F I N E D P R O D U C T S S U P P LY
We Have Completed Two Projects to Help Remedy Mexico’s
Supply Shortfall
★ In 2020, we fully completed service on two
projects that address the supply imbalance in
Northern Mexico:
❑ Nuevo Laredo project for Valero ❑ Nuevo
➢ Odem pipeline, Dos Laredos pipeline Laredo Project
and Nuevo Laredo terminal expansion
➢ ~28MBPD new capacity with take-or-pay
volumes on seven-year contract term
❑ Valley Pipeline expansion for major
customers completed in September 2019
➢ 45MBPD new capacity with seven-year
contract term
➢ Open season was fully subscribed
❑ Valley
Refined
Products
Supply
Project
31APPENDIX
South Texas Crude System
32Long-term Commitments From Creditworthy Customers
Pipeline Segment Contracted1 Revenues
(% Q3 2020 Revenues) NuStar Investment-Grade (IG) Customers
Take-or-pay (% Q3 2020 Revenues)
Contracts
45% Structurally
Exclusive
40%
Other Pipeline
15%
Segment 52% 13%
~61% IG
Storage
Storage Segment Contracted Revenues Segment
(% Q3 2020 Revenues)
~61% IG
35%
78% Take-or-pay
Contracts
Other Investment-Grade
Large Private or International (Not rated)
22% Other
1 - committed through take or pay contracts or through structural exclusivity (uncommitted lines serving refinery customers with no competition)
33The Balance of Our Business and the Location of Our
Assets Contribute to the Resilience of Our Results
Pipeline and Refined Products
Storage and Crude
Segment Revenues
Revenues (% 3Q 2020
(% 3Q 2020 Revenues)
Revenues)
59% 46%
41% 54%
NS Refined Products Pipeline
NS Crude Pipeline Crude
Pipeline Segment NS Terminal
Storage Segment Refinery Refined Products
34We Acquired Our Permian Crude System Because It Sits Squarely
Over the Midland Basin’s Most Geologically Advantaged Acreage
MOST ACCESSIBLE, BEST RECOVERIES AND
STACKED FORMATIONS… SUPERIOR GORs…
Fairway Outlines MBOE
NuStar Pipeline 500+
Spraberry 300
200
Wolfcamp A
150
Wolfcamp B
100
Wolfcamp C
Wolfcamp Structure (TVDSS ft) Midland Fairways 24M CUM (MBOE 20:1) (1) Wolfcamp 24M GOR
___________________________
1. Normalized to 10,000 ft Lateral Lengths.
Source: Barclays (January 2020)
35Debt Maturity Schedule – NuStar Expects to Have
Adequate Liquidity to Accommodate Our 2021 and 2022
Bond Maturities
★ In March 2020, we renewed our revolver through October of 2023
★ In April 2020, we entered into a three-year, $750 million unsecured term loan agreement with Oaktree Capital
Management, L.P. to increase our liquidity and to address near-term debt maturities
★ In September 2020, we issued two $600 million tranches of five-year and 10-year senior unsecured notes maturing
in 2025 and 2030
❑ We utilized the proceeds to repay the $500 million balance outstanding under the April 2020 loan, as well as
all the borrowings then-outstanding under our revolving credit agreement
★ We plan to utilize our projected liquidity to pay-off our February 2021 and February 2022 bond maturities
Revolver Availability
$1,250 $1,150
Debt Maturities Cash
(As of 9/30/2020) Receivables Financing
$1,000
($MM) Sub Notes
GO Zone Financing
$750
Senior Unsecured Notes
995
$500
$600 $550 $600
$250 $500
$403
$300 $250 $322
155
$0 $61
2
Liquidity 2020 2021 2022 2023 2024 2025 2026 2027 2028- 2030 2038- 2043
2029 2041
1 – As of September 30, 2020, approximately $5 million of Letters of Credit were outstanding under our revolving credit agreement
2 – Projected liquidity as of December 31, 2020
36Capital Structure as of September 30, 2020
($ in Millions)
$1.0B Credit Facility $ 0 Common Equity and AOCI $536
NuStar Logistics Notes (4.75%) 250 Series A, B and C Preferred Units $756
NuStar Logistics Notes (5.625%) 550 Series D Preferred Units $596
NuStar Logistics Notes (5.75%) 600 Total Equity1 1,888
NuStar Logistics Notes (6.00%) 500 Total Capitalization $5,490
NuStar Logistics Notes (6.375%) 600
NuStar Logistics Notes (6.75%) 300
NuStar Logistics Sub Notes 403
GO Zone Bonds 322
Receivables Financing 61
Finance Lease Liability 59
Other (43)
Total Debt $3,602
★ As of September 30, 2020:
❑ Credit facility availability ~$995MM
❑ Debt-to-EBITDA ratio2 4.13x
1 - Total Equity includes Partners’ Equity and Mezzanine Equity (Series D Preferred Units)
2 - Please see Appendix for reconciliations of non-GAAP financial measures to their most directly comparable GAAP measures
37Reconciliation of Non-GAAP Financial Information
38Reconciliation of Non-GAAP Financial Information
(continued)
39Reconciliation of Non-GAAP Financial Information
(continued)
40You can also read