4 May 2018 Ontario Windstorm - CASE STUDY - FORECASTS RESEARCH STATISTICS - Weatherlogics
←
→
Page content transcription
If your browser does not render page correctly, please read the page content below
CASE STUDY

   4 May 2018 Ontario Windstorm

FORECASTS ∙ RESEARCH ∙ STATISTICS
Southern Ontario Damaging Windstorm: 4 May 2018
Introduction
A historic, damaging windstorm occurred in southern Ontario on 4 May 2018. The event was notable for its impacts,
including downed trees and power lines, and three fatalities. In some locations, these winds were the strongest
ever recorded in the month of May. Wind gusts reached over 100 km/h in many areas, with a maximum measured
gust of 126 km/h. The damage from this event totalled over $380 million in Ontario, making it the costliest event
since the 2013 Toronto floods, according to Catastrophic Indices and Quantification Inc.
This was a unique event because record-setting wind speeds occurred with both weak thunderstorms and no
thunderstorm activity at all. In this case study we examine the meteorological mechanisms that produced the
damaging winds.
Wind Report Summary MEASURING THE WIND
Wind measurements
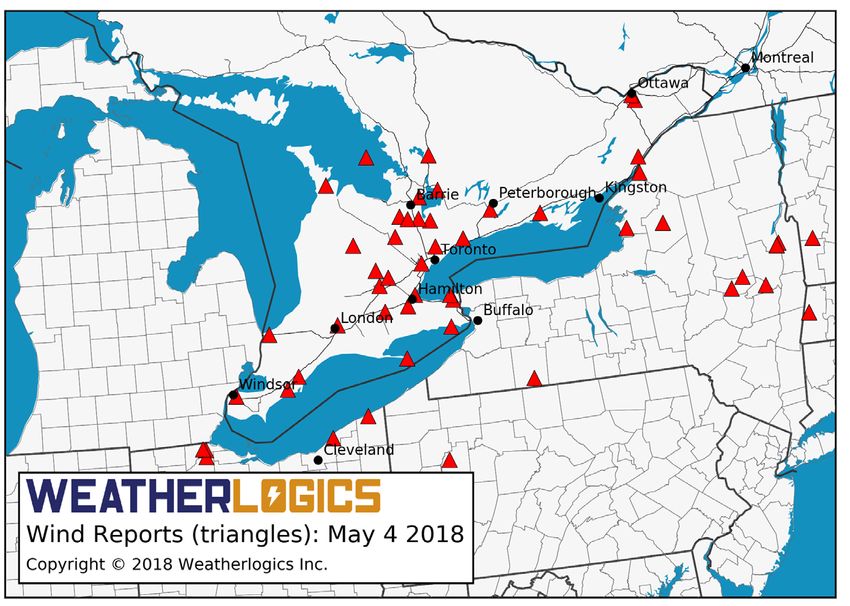
The map in Fig. 1 shows the locations of all measured wind gusts on 4
Wind is measured at 10-m
May 2018 that were at least 87 km/h. The severe wind gusts stretched from above ground level based on
northeastern Ohio, through southern Ontario, and into the northeastern standards developed by the World
Meteorological Organization. A wind
United States. The strongest gust of the day occurred at John C. Munro gust is the maximum wind speed
Hamilton International Airport at 15:43 Eastern Daylight Time (EDT), where during an observation period. The
sustained wind is the 2-min average
a maximum gust of 126 km/h was recorded. Other weather stations in the wind speed and direction taken just
Greater Toronto Area (GTA) also reported extreme wind gusts, with 119 prior to the time of the weather report.
km/h measured at Toronto’s Pearson Airport, and 122 km/h reported at Wind speed units
the Region of Waterloo International Airport.
In meteorology, the units of knots are
typically used to measure wind speed.
Knots is a phrase that means “nautical
mlles per hour”. This originates from
meteorology’s roots in aviation, where
knots are used to measure air speed.
Other units are also commonly used
to report wind speed:
- Kilometres per hour
- Metres per second
- Miles per hour
Wind direction units
Wind direction is usually reported in
one of two ways; either in degrees
or using cardinal directions. Degrees
describe the wind direction based on
a circle split into 360 degrees, with the
0/360 degree line being due north, 90
degrees being east, 180 degrees being
south, and 270 degrees being west.
A wind direction observation always
indicates where the wind is coming
from.
Figure 1: Red triangles represent the locations where wind gusts of 87 km/h or higher were
measured on 4 May 2018.
Copyright © 2018 Weatherlogics Inc.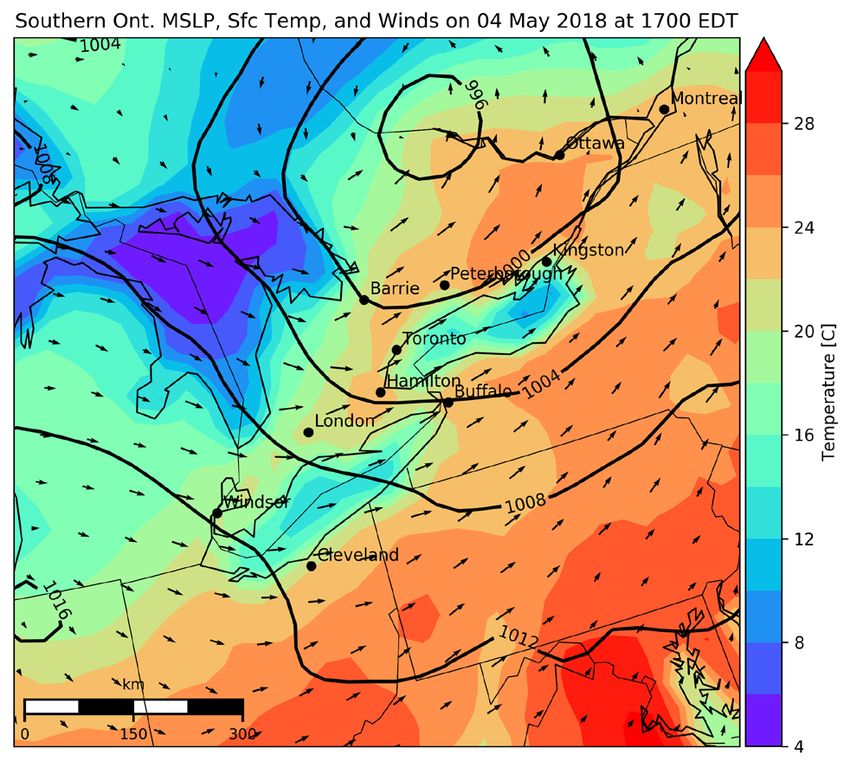
Southern Ontario Damaging Windstorm: 4 May 2018

Surface Weather Overview
The surface maps in Fig. 2, constructed using the North American Regional Reanalysis (NARR), show the frontal
system that was moving through southern Ontario on 4 May 2018. At 14:00 EDT, a low-pressure system was located
near Parry Sound, ON, near the northeastern shore of Lake Huron, as shown in Fig. 2a. By 17:00 EDT, the centre of
the low had progressed east-north-east to sit along the Ontario/Quebec border, shown in Fig. 2b. During this 3-hr
period, a cold front swept through most of southern Ontario, with only the far eastern portions of southern Ontario
yet to see the front’s passage. A few weak showers and thunderstorms occurred along this cold front. Behind the
cold front, a trough of low pressure was located in the London-Hamilton-Toronto corridor at 17:00 EDT. Meanwhile,
a warm front was moving northeastward, causing rapid temperature increases with its passage.

                                                                                                        L
  (A)                                                                    (B)

Figure 2: (a) Surface weather map at 14:00 EDT on 4 May 2018. Thick black contours are mean sea-level pressure in hPa, 2-m surface temperature
is shown as filled colour contours, 10-m winds are shown as arrows (length represents relative speed), and a low-pressure system and its
associated fronts are depicted using the standard conventions. (b) as in (a) but at 17:00 EDT.

Radar Imagery
Radar imagery, from the King City, ON C-band radar, is depicted in Fig. 3. In Fig. 3a, scattered showers and
thunderstorms can be seen moving through the GTA at 15:40 EDT. These storms developed along the cold front
(see Fig. 2a), as warm, moist air ahead of the front was lifted, allowing convective clouds to develop. Some initial,
localized damaging winds occurred in Toronto and Hamilton as these showers/thunderstorms moved through,
including the record-setting 126 km/h gust in Hamilton at 15:43 EDT. Later, the radar image at 17:00 EDT in Fig. 3b,
shows an absence of precipitation in the GTA. A second round of severe wind gusts occurred in the Toronto region
around the time of this later radar image, despite an absence of thunderstorm activity.

(A)                                                                     (B)

Figure 3: (a) Conventional radar reflectivity image from the King City C-band weather radar at 15:40 EDT 4 May 2018. The white rectangle shows
the area of showers and thunderstorms discussed in the text. (b) As in (a) but at 17:00 EDT and with no white rectangle.

                                                 Copyright © 2018 Weatherlogics Inc.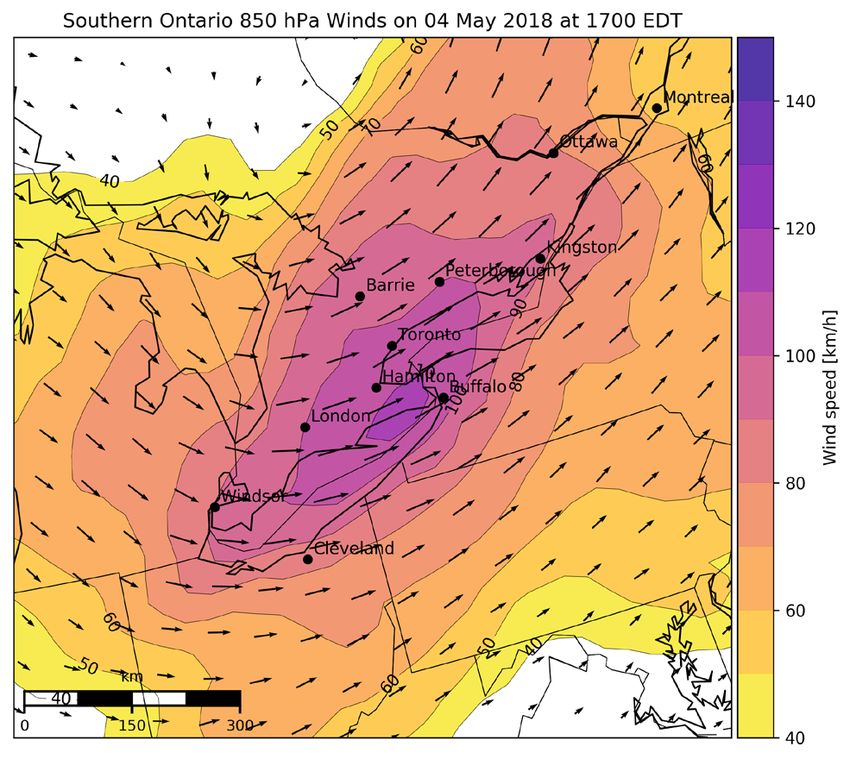
Southern Ontario Damaging Windstorm: 4 May 2018

Surface Weather Observations
The graphs in Fig. 4 show the air temperature, dewpoint temperature, wind speed, and wind gusts recorded in
Etobicoke, ON on 4 May 2018. These observations were recorded every 15 min and captured both the thunderstorm
activity, which generated an initial round of strong wind gusts, and the secondary gusts along a trough of low
pressure. Figure 4a shows three important features: the passage of a warm front, causing temperatures in Etobicoke
to rise rapidly, the passage of a cold front, causing a slight temperature decline, and the passage of a trough, which
resulted in a sharp temperature drop and the onset of a second round of severe wind gusts. Figure 4b shows the
sustained wind speeds and wind gusts recorded in Etobicoke, ON. Of primary interest are two wind gusts, one of 97
km/h at 15:47 EDT and a second gust of 116 km/h at 17:32 EDT. The first gust occurred when a weak thunderstorm
passed over the station, while the second gust occurred with the passage of the trough of low pressure. It is
interesting that the wind gust with the thunderstorm was actually weaker than with the trough passage. Typically,
severe warm-season winds are associated with thunderstorm processes and not benign phenomena like troughs
of low pressure. The next section discusses the origins of the severe winds, which can link the gusts at 15:47 EDT
and 17:32 EDT.

        (A)
                                                                                                  cold front
                                                                     warm front                   passage      trough
                                                                     passage                                   passage

                                                                                                                   Trough
        (B)                                                                        Thunderstorm                    116 km/h
                                                                                   97 km/h

                                                             Date and Time [EDT]

Figure 4: (a) Air temperature as a red line and the dew point temperature as a green line. (b) Sustained wind speeds as a solid blue line and
wind gusts as black dots.

Production of Damaging Surface Winds
When strong surface winds occur with thunderstorms, they are usually produced by internal thunderstorm
processes on a localized basis. However, the weak nature of the storms in this case, and the fact that they produced
gusts similar to those caused by the trough of low pressure, suggest the same mechanism may have acted in both
cases. While there was a notable surface pressure gradient across southern Ontario at the time of the wind gusts
(see Fig. 2), it was not of the magnitude that would be expected to produce damaging surface winds. Typically,
much tighter pressure gradients are associated with widespread, damaging surface winds, such as might be found
around an intense nor’easter (east-coast winter storm). The first logical source for strong, non-thunderstorm gusts,
is strong winds at atmospheric layers just above the surface. Such strong winds just above the surface are often
referred to as a “low-level jet”; essentially a jet stream just above the surface, where winds can exceed 100 km/h.
If a low-level jet was occurring at the time of these gusts, it could explain their origins. However, an additional
mechanism would also be required to transport the low-level jet winds to the surface. Therefore, we must also
investigate possible mechanisms that allowed these strong winds to be transported to the surface, since that does
automatically occur when a low-level jet is present.

                                               Copyright © 2018 Weatherlogics Inc.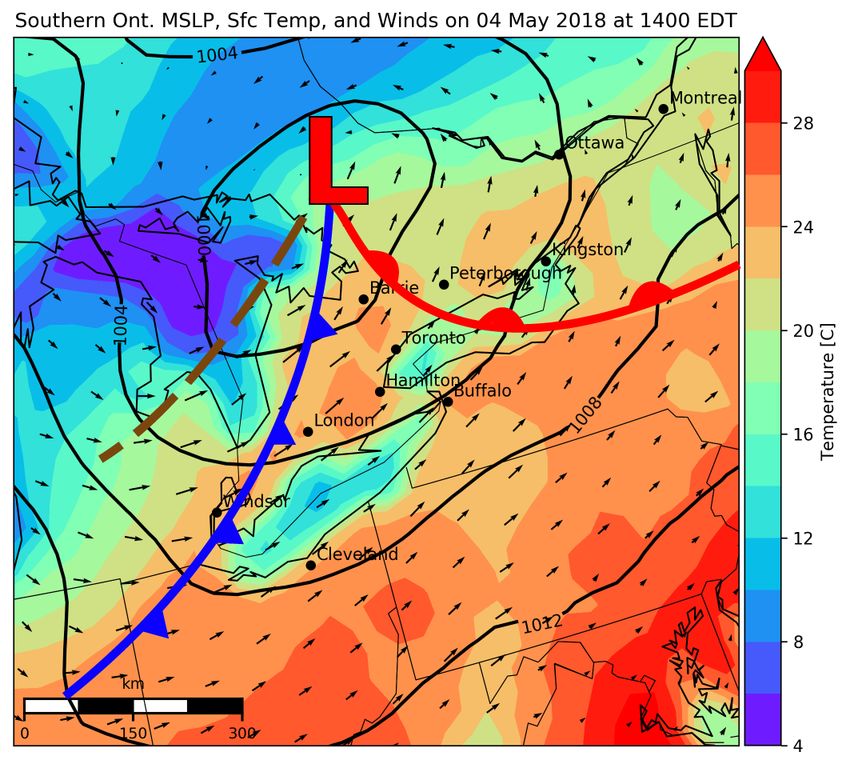
Southern Ontario Damaging Windstorm: 4 May 2018
Upper-Air Conditions
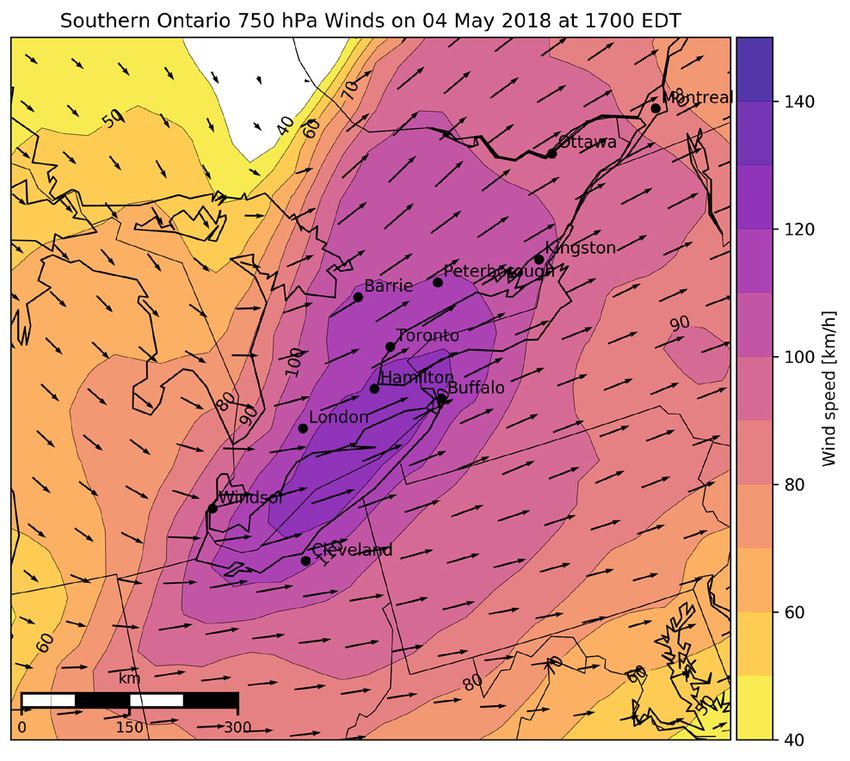
The upper-air charts in Fig. 5, constructed using the NARR, show the wind speeds at two levels aloft; 850 hPa in
Fig. 5a and 750 hPa in Fig. 5b. The 850-hPa level corresponds to approximately 1500-m above sea level (ASL), while
the 750-hPa level is approximately 2500-m ASL. Figure 5a shows westerly to southwesterly winds over southern
Ontario, with speeds in excess of 100 km/h (120 km/h) at 850 hPa (750 hPa), indicating the presence of a low-level
jet. Therefore, we have the necessary atmospheric wind field to generate severe surface winds, but such winds
needed a mechanism to allow them to reach the surface. Given that there were two distinct occurrences of severe
winds, one with the showers/thunderstorms and a second with the trough, these two instances of gusts will be
discussed separately.
Thunderstorm Gusts
The first round of severe winds, produced by the passage of the weak thunderstorms, were most likely caused
when thunderstorm downdrafts pushed the low-level jet winds from aloft toward the surface. All thunderstorms
have downdrafts during their life cycle, even if they are not particularly strong, which is why we have cited this
factor. Given that strong winds were already in place just above the surface, it appears that even the downdrafts
from these weak thunderstorms were sufficient to transport the strong low-level jet winds to the surface. However,
the explanation for why there were more widespread severe gusts along the trough is a bit more complicated.
(A) (B)
Figure 5: (a) Winds at 850 hPa (~1500-m above sea level) on 4 May 2018. Wind speeds are shown as filled contours and arrows show the wind
direction, with the arrow length being proportional to the wind speed. (b) As in (a) but at 750 hPa (~2500-m above sea level).
Trough Gusts
There appear to be two factors which provide the most likely explanation for why damaging gusts occurred most
prominently along and behind the trough of low pressure. Firstly, low-level atmospheric instability, and associated
turbulence, is very favourable for the transport of strong winds from aloft toward the surface. Reconstructed
atmospheric profiles over southern Ontario (not shown) were unstable (dry adiabatic) from the surface to 2500-m
ASL, supporting the transport of winds from aloft toward the surface. Secondly, strong cold-air advection (falling
temperatures) was occurring, which is associated with descending air. An additional factor was the near-perfect
alignment of the winds from aloft all the way to the surface. Figure 5 shows how the winds were of nearly the same
direction at the 850- and 750-hPa levels.
In order to identify which level the gusts originated from during the trough passage, the bias and mean absolute
error (MAE) were calculated using the difference between the NARR wind speeds, at various levels aloft, and the
surface gusts ± 1-hr of 17:00 EDT. The MAE and bias were lowest, at 8 km/h and 0 km/h, respectively, when using
the 850-hPa level to calculate the difference. Therefore, we hypothesize that on average the gusts originated near
850 hPa, although the actual initial heights of the gusts would have varied by location, as some gusts were better
correlated with winds just above 850 hPa, while others better correlated with winds originating just below 850 hPa.
Copyright © 2018 Weatherlogics Inc.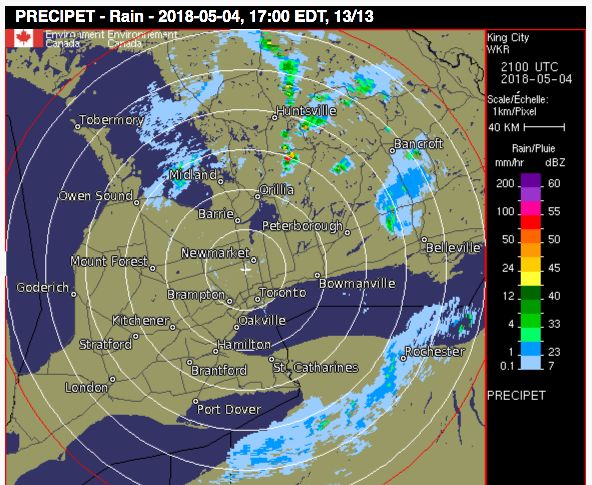
Southern Ontario Damaging Windstorm: 4 May 2018

 Conclusion
 The damaging wind gusts in southern Ontario on 4 May 2018 were most likely produced when very strong winds
 aloft, on average originating near 850 hPa (1500-m ASL), were transported to the surface. Initially, thunderstorms
 produced by a cold front helped to force these extreme winds to the surface on a localized basis, while a trough
 of low pressure later allowed these winds to reach the surface on a more widespread basis. This was a unique
 event where strong winds aloft were allowed to reach the surface by two different phenomena, causing damage
 over wide swaths of southern Ontario. Future analyses of this case could perform high-resolution simulations to
 trace the wind gusts backward to their level of origination, helping to identify the trajectories, and confirm the
 mechanisms, that allowed them to cause damage at the surface.

 More Information
 For more information, please contact the meteorological research team at Weatherlogics Inc. using the contact
 information given below.

 Data Sources
 Surface and upper-air map grids: North American Regional Reanalysis.
 Cover photo of wind damage: Peel Regional Police.
 Etobicoke, ON surface observations: Weather Underground.
 Radar imagery: Environment and Climate Change Canada.
 Wind measurements in Fig. 1: Environment and Climate Change Canada and Storm Prediction Center reports.

 Commercial Use
 Commercial use of this case study is prohibited without the consent of Weatherlogics Inc. Please contact
 Weatherlogics Inc. for commercial inquires.

 Disclaimer
 While Weatherlogics has provided this document and its associated information in a professional and diligent
 manner, due to the unpredictable nature of weather, the user agrees Weatherlogics is not liable and will hold
 Weatherlogics harmless from all claims, liability and expenses caused wholly or in party by Weatherlogics providing
 this information.

 Contact
                                                Weatherlogics Inc.
                                            301-321 McDermot Avenue
                                              Winnipeg MB R3A 0A3

                                          Email: info@weatherlogics.com
                                             Phone: 1-877-852-4500

                                      Copyright © 2018 Weatherlogics Inc.
You can also read