A more discerning consumer in the post pandemic scenario - LATAM Snacks Landscape
←
→
Page content transcription
If your browser does not render page correctly, please read the page content below

SNAXPO 2021

A more discerning
consumer in the post
pandemic scenario
LATAM Snacks Landscape

August 2021

© 2021 Nielsen Consumer LLC. All Rights Reserved.
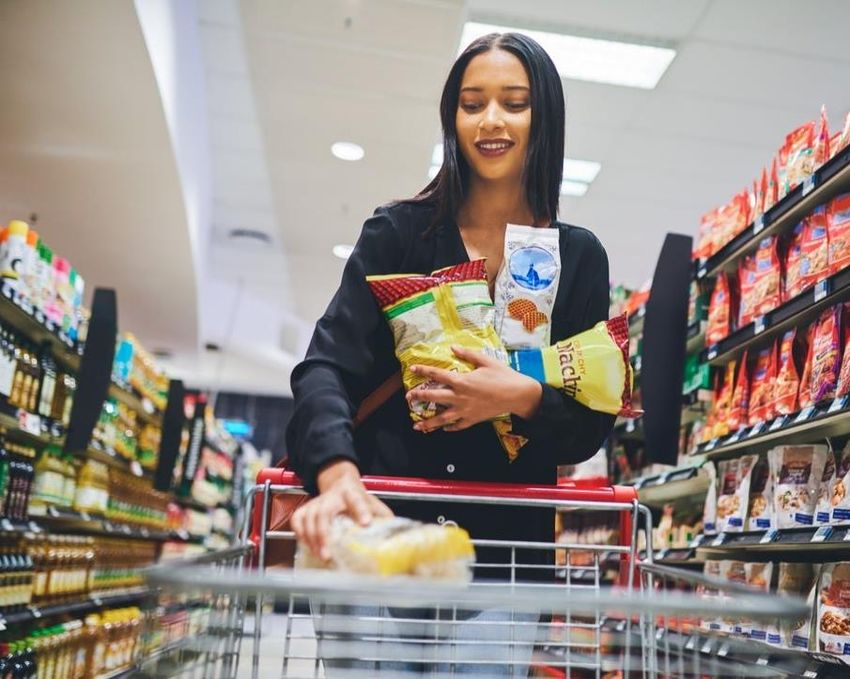
Table of contents

LATAM context: A highly impacted economy. Snacking
continues

Traditional channel: Affected but never gone

Snacking in a new context (trends and innovation)

                                                     2
© 2021 Nielsen Consumer LLC. All Rights Reserved.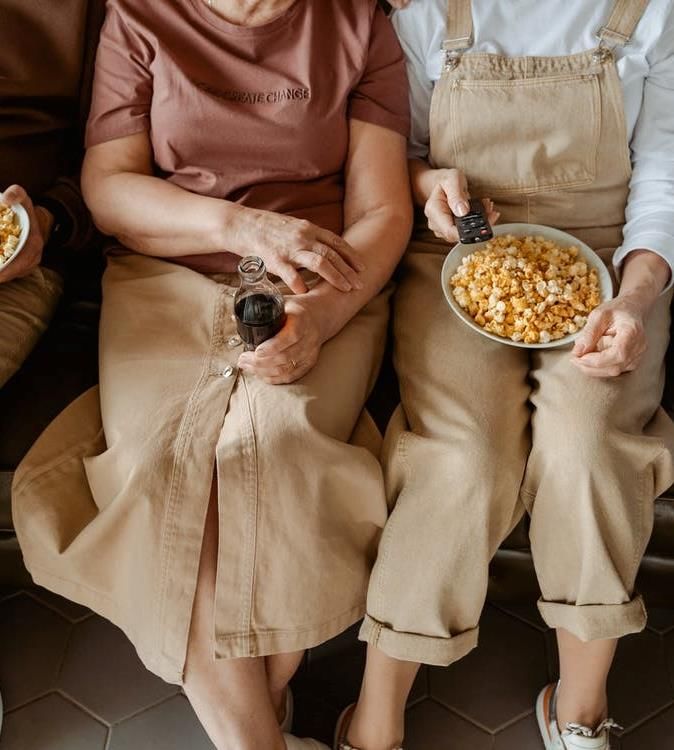
LATAM context:
 A highly impacted economy. Snacking
 continues

                                                    3
© 2021 Nielsen Consumer LLC. All Rights Reserved.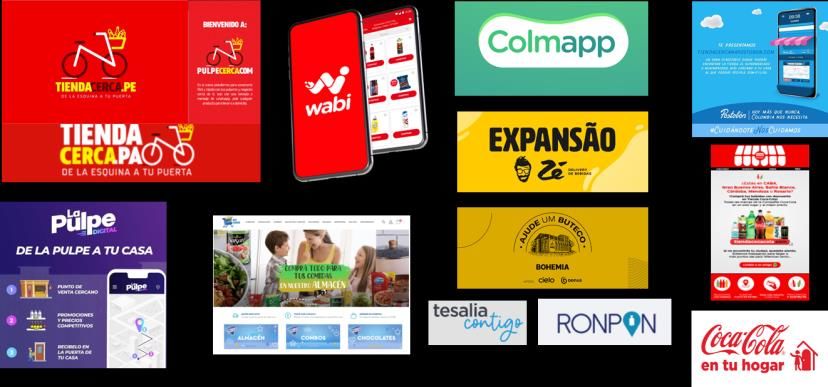
Latam with impacted economy but showing positive perspectives, despite
     recent social turmoils
     Recovery projections would leave GDP projections below pre-COVID levels

                                        GDP´20 (% Change vs Yago)                                     COVID impact above global levels

                                 MX                                         LATAM´20                 ¿Were you personally impacted by COVID-19?
                                 -8.2                                         -7.0

                                                     COL
                                                     -6.8                                           32%                               49%
                                                        PE            BR
                                                       -11.1         -4.1

                                                                                                       Global                               Latam
                                                         CH
                                                        -5.8

                                                                                                                  ¿How were you impacted?
                                                               ARG                                                     Global Latam
                                                               -10
                                                                                              Job    16% 36%                          Health 9%     7%

                                                                                                         Both           7%    6%
Source: IMF. Growth Projections/ April 2021
https://www.imf.org/en/Publications/WEO/Issues/2021/03/23/world-economic-outlook-april-2021
                                                                                                                                                         4
 © 2021 Nielsen Consumer LLC. All Rights Reserved.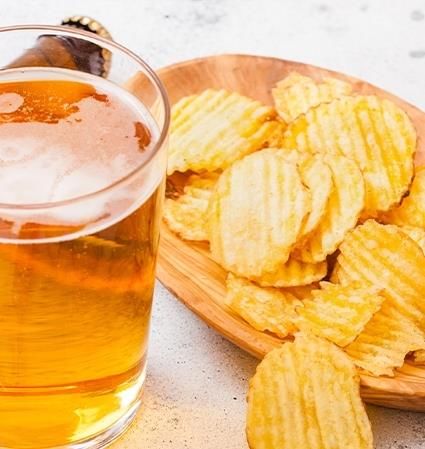
5 revealing facts about Latin America reality

                                                    1/3 of Latin America's inhabitants live in poverty or
                                                    subsisting on less than $1.90 a day.

                                                    Poverty rates vary from country to country.

                                                    Encompasses both urban and rural areas.

                                                    Lack access to safe water and sanitation,

                                                    Lack of education in Latin America lowers prospects of rising
                                                    out of poverty.

                                                                                                                    5
© 2021 Nielsen Consumer LLC. All Rights Reserved.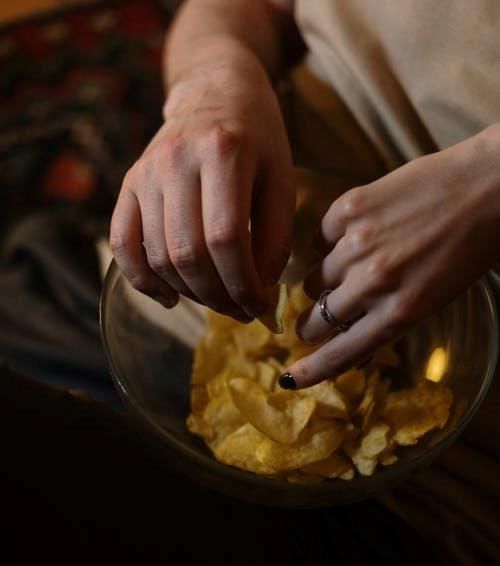
Consumption characteristics leading to rethink value in
             products
             What is valued and prioritized depends on consumer´s spending ability                                                      Less loyalty from need
                                                                        Focus on grocery essentials, minimize in-home
      Existing Constrained                                              discretionary spend

      Newly Constrained
                                                                        Rationalize spend in all wallet areas, including home
                                                                        consumption
                                                                                                                                                                    79%
                                                                                                                                                                    Made changes that
                                                                                                                                                                    impact loyalty
                                                                        Replace OOH with in-home options, but more cost-
      Cautious Insulated
                                                                        conscious choices

      Unrestricted Insulated                                            Divert OOH dining, leisure, travel spend to in-home
                                                                        indulgence, luxury and services                                                            26%
                                                                                                                                                                   Made switching
                                                                                                                                                                   changes
                     Newly Constrained and Cautious Insulated groups share
                     value factors like:
                     ❑
                     ❑
                             Bargain hunt in near proximity
                             Reduce destination shopping
                                                                                                                                                                   6%
                                                                                                                                                                   Abandoned
                     ❑       Loosen loyalty: Low price and Private Label.                                                                                          products

                                                                                                                                Q. How has your purchasing changed since the onset of COVID-19?
Source: NielsenIQ Unlocking Consumption global survey Dec2020/Jan2021
.         © 2021 Nielsen Consumer LLC. All Rights Reserved.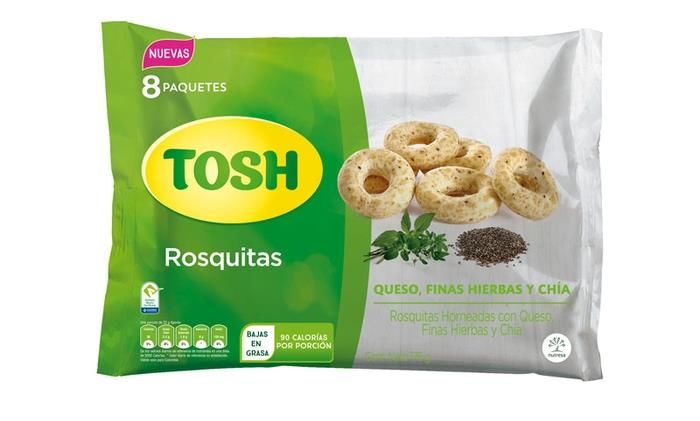
Snacks impacted by prioritization and for their
                                                                                                                               When we say “Snacking” we
   individual/on-the-go nature                                                                                                 speak about salty appetizers
                                                                                                                               like…

                                                                                                                                               Savoury Biscuits
                                             % Volume Growth per basket- FY’20

                                                    Food            Snacks                  Beverages
                                                                                                                                                  Potato Chip
     COL                                                                            -1.9          -0.9-0.2

     ARG                                                                    -1.9             -2.2

         CL                             -3.3                            -4.8                      -1.2                                             Extruded

       MX                                                                                  -1.1    -0.8 -0.1

        BR                                                                                          -1.3     1.4
                                                                                                                                              Tortilla Chips (Corn)
         PE                                                                        -3.7              -0.3          2.6

         CR                                                                                   -1.8                 2.6   0.8

                                                                                                                                                      Nuts

Source: Quarter by numbers LATAM, FY’20. | Nielsen Basket Monitor Q4 2020 LATAM
Snacks considering Nielsen definition including sweet and salty.
© 2021 Nielsen Consumer LLC. All Rights Reserved.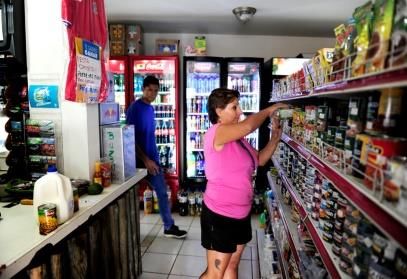
Snacking volume recovering in 2021

-0.6%                                                                                                  +0.9%
 Value sales variation FY´20 vs. FY 19                                                                   Value sales variation Q1´21 vs. Q1´20

                                                                                   Volume sales variation vs Yago

                                                                                                                              *
                                                               6.8%                                        7.1%
                   2.4%                       3.4%                                        3.7%

                                                                                                                                                                        -2.5%                -0.5%
 -4.2%                                                                                                                                                 -5.8%                    -3.9%                -3.7%
                                                                                                                                     -13.7%

                                                                                               Var Fy´20                     Var Q1´21
                                                                                                                                                                                *Exceptions for 2020 drop:
                                                                                                                                                              ▪   Chile growing through segments like Tortilla chips, showing new
                                                                                                                                                                  references
                                                                                                                                                              ▪   Brazil less affected due minor restrictions growing in different
                                                                                                                                                                  segments (Potato, Tortilla, Extruded)
SOURCE: Nielsen Retail Index | Savoury Snacks USD sales |Countries considered in the analysis are Argentina, Brazil, Chile, Colombia, Mexico, Puerto Rico..
© 2021 Nielsen Consumer LLC. All Rights Reserved.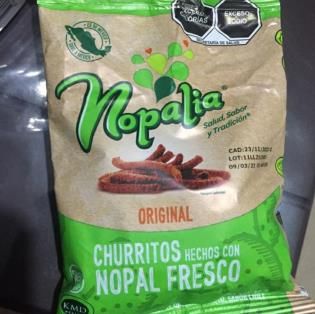
Local and small manufacturers boosting snacks performance
    Leading manufacturers contributing in a smaller proportion than its market size

                                                                            Share of Market in Volume (KG)                                                                                    Var Vol

                                            6.6                                                                      6.6                                                                        9.9%
                                                                                                                                                                     NESTLE
                                                                                                                                                              23.9
                                                                                                                                                                     KELLOGGS
                                                                                                                                                                                                50.1%
                                          42.5                                                                     42.5                                       15.8                              -8.6%
                                                                                                                                                                     MONDELEZ INTERNATIONAL
                                                                                                                                                               4.0
                                                                                                                                                                     GENERAL MILLS              8.4%
                                                                                                                                                              31.7   BIMBO + BARCEL             0.6%
                                          46.5                                                                     46.4                                              REST                       0.8%
                                                                                                                                                              23.3   PEPSICO
                                                                                                                                                                                                0.5%
                                        Q1'20                                                                    Q1'21                                        SOG

 Source: Nielsen Retail Index | Savoury Snacks in USD | Countries considered in the analysis Brazil, Chile, Argentina, Colombia, Mexico, Puerto Rico
SOURCE: Nielsen Retail Index | Savoury Snacks USD sales |Countries considered in the analysis are Argentina, Brazil, Chile, Colombia, Mexico, Puerto Rico..                                             9
© 2021 Nielsen Consumer LLC. All Rights Reserved.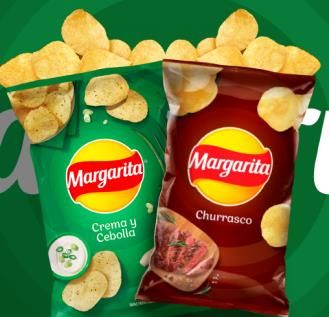
Winning segments related to experience
   LATAM snacks Q1´2021

             Volume sales variation vs Q1´2020                                                                                                                Top manufacturers generating growth

                          PRETZEL                                                                                         7.5%

                TORTILLA CHIPS                                                                        5.1%

                  RTE POPCORN                                                                         5.0%

        EXTRUDED / PELLETS                                      1.7%

                   POTATO CHIP                            1.2%

      Main segments: Potato, Tortilla, Extruded
      Low price per kilo segments: Pretzels, RTE Popcorn                                                                                                                  Other local manufacturers
SOURCE: Nielsen Retail Index | Savoury Snacks USD sales |Countries considered in the analysis are Argentina, Brazil, Chile, Colombia, Mexico, Puerto Rico..                                           10
© 2021 Nielsen Consumer LLC. All Rights Reserved.
Traditional trade, an important role for snacks recovery
Main trade for almost all LATAM countries
Channel Mix FY´19 33.5 66.5 FY´19 77.5 22.5
Arg Brzl
Traditional Trade Modern Trade FY´20 36.6 63.4 FY´20 82.8 17.2
Q1´21 34.3 65.7 Q1´21 80.4 19.6
47.6 FY´19 61.3 38.7 FY´19 40.3 59.7
50.7 50.1 Chl Col
FY´20 61.9 38.1 FY´20 44.0 56.0
Q1´21 60.9 39.1 Q1´21 41.6 58.4
FY´19 35.3 64.7 FY´19 57.4 42.6
52.4 49.3 49.9 Mex P.Ric
FY´20 36.1 63.9 FY´20 65.7 34.3
Q1´21 35.6 64.4 Q1´21 64.1 35.9
FY´19 FY´20 Q1´21
Source: Nielsen Retail Index | Savoury Snacks in USD | Countries considered in the analysis are Argentina, Brazil, Chile, Colombia, Mexico, Puerto Rico 11
© 2021 Nielsen Consumer LLC. All Rights Reserved.Traditional trade
Affected but never gone
12
© 2021 Nielsen Consumer LLC. All Rights Reserved.Traditional Trade comes in all kind of shapes and sizes
There are more than 3 million TT stores in Latam, that is nearly 1 store for every 200 inhabitants
13
© 2021 Nielsen Consumer LLC. All Rights Reserved.Traditional trade affected by restrictions, but Recovery in traditional channel
recovering in last months with less trips but increased
Initial COVID needs favored modern channel as a source for preparation (over-hoarding), but in
late months it shows a return to traditional channel
expenditure
Full basket purchases Monthly behavior in TT
Value var.% 2020 vs. Yago Trips vs Expenditure (Critic months)
Drugstore Traditional On Premise Modern
81 Jan´20 -1.4
8.7
45 45 47 44 45 Mar´20 3.2
38 43 40 40 38 12.1
14 10 15 10 13 13 May´20 -13.7 26.8
3 3 1 3 3 3 3
Jul´20 -15.3 28.7
DJF 2020 FMA 2020 AMJ 2020 JJA 2020 ASO 2020 OND 2020
Sep´20 -11.4 27.1
Trips freq Expenditure
Pantry preparation during lockdown, affecting traditional channel
(Crtical period)
Source: Nielsen Basket Monitor FY 2020,. All baskets included / Source: Nielsen CPS September: México, Colombia, Brasil, Chile, September 2020
© 2021 Nielsen Consumer LLC. All Rights Reserved.Traditional trade slightly recovering its relevance in 2021 with mobility reactivation,
but also through it’s value offer
Known brands and bigger formats speak of the need to become a frequent shopping spot
LatAm Sales value importance,
Top drivers to return: what consumers needed in T. Baskets
the traditional channel Drugstores Traditional Trade+ On premise Modern Trade
51.6 55.7 54
56% need cheaper 53% better assortment
brands
43.6 39.8 41
29% well known brands 14% Bigger presentations
4.8 4.5 4
2019 2020 JF'21
Source: Nielsen RI, Total Basket value sales per channel, FY 20 vs FY19, México, Brazil dissaggregation per Q | Source: Nielsen Homescar Oct´2020. Q: What will be relevant for you to return to the traditional channel? 15
© 2021 Nielsen Consumer LLC. All Rights Reserved.Bigger formats becoming stronger in TT, a conventionally
Larger format answer to different
small-size channel needs
Larger formats as a “Constrained” consumer means of saving, while in “Insulated” it answers to
less trips solution
Saving priority
2020 Existing Constrained
5%
Acquiring larger packages
DJF 42% 25% Newly Constrained
9%
Acquiring larger packages
AMJ
-5%
39% 27%
+4% Ease priority
Cautious insulated
JAS 37% 29% 11%
Acquiring larger packages
Avg. Latam value sales
Mix shifting between these sizes: not considered medium sizes and undefined
Unrestricted insulated
Source: NielsenIQ Unlocking Consumption global survey / Nielsen RMS muestra de categorías más relevantes BRA 32 CAT, MEX 31 CAT, PER 24 CAT, COL 35 CAT, CHI 28 CAT, ARG 26 CAT, CR 27 CAT /DEF: Diciembre-
Enero-Febrero AMJ: Abril-Mayo-Junio JJA: Junio-Julio-Agosto.
5%
© 2021 Nielsen Consumer LLC. All Rights Reserved.
Acquiring larger packagesSnacks aligned increasing bigger formats in traditional
channel
Small sizes keeping strong relevance despite this trend, showing the personal consume is kept
despite the “At home” life style Extruded and Potato Chips
contributing the most to this large
size increase in traditional
Size format mix (Val. Sales)
24.4% 26.8% 27.9%
Extruded +32%
Vs. FY´19
75.6% 73.2% 72.1%
FY'19 FY'20 Q1'21 Potato chips
Small Large +14%
-8%
*Considering small sizes below 60grs. Vs. FY´19
SOURCE: Nielsen Retail Index | Savoury Snacks USD sales |Countries considered in the analysis are Argentina, Brazil, Chile, Colombia, Mexico, Puerto Rico..
© 2021 Nielsen Consumer LLC. All Rights Reserved.Snacking in a new context (trends and
innovation)
18
© 2021 Nielsen Consumer LLC. All Rights Reserved.Despite COVID changed how consumers see the world, innovations are not going
anywhere
30%
56% Interested in buying new products now more than ever
26%
Interested in buying new products during
COVID-19 Interested in buying new
products due to unavailability
Has COVID-19 impacted your purchasing of new products?
Sample: 1572 respondents interviewed across LatAm (Costa Rica, Colombia, Mexico, Chile, Brazil )
Source: Nielsen BASES Top Breakthrough Innovations 2020
© 2021 Nielsen Consumer LLC. All Rights Reserved.Trends and innovation inside brand
related to ….
The snacking experience
1 2 3
Taste good Life´s good Feel good
⮚ Flavors ⮚ Occasions ⮚ Purpose
⮚ Textures ⮚ Value added ⮚ Health
Source: NielsenIQ Unlocking Consumption global survey. Dec2020/Jan2021
20
© 2021 Nielsen Consumer LLC. All Rights Reserved.Benefits in breakthrough innovation winners aligned to these experience needs
(Global and Latam)
Breakthrough Innovation Trends based on Breakthrough Innovation Trends based on
Winners GLOBAL Winners LATAM
Local Taste
37% 54%
Healthy
37% 36%
Consumption Occasion 13%
Organic & Plant-Based 11%
Accessible / Affordable 3%
46%
Source: Nielsen BASES Top Breakthrough Innovations 2020
© 2021 Nielsen Consumer LLC. All Rights Reserved.Some trends seen in 2020 for the snacks category:
Taste good Life´s good Feel good
FOOD PAIRING
TREND
SALTED/SPICED
INGREDIENTS
INTENSITY OCCASION BOOSTERS
PRODUCT USAGE CONTENT*
ORIGIN TRANSFORMATION (STAMPS)
Source: Nielsen BASES Top Breakthrough Innovations 2020 | Snacks trends research
© 2021 Nielsen Consumer LLC. All Rights Reserved.Taste trend with strong flavors (growing segments
related to this offer)
LOCAL/INTENSE
SALTED/SPICED
Innovating through local flavours, like recent
Value sales increasing in Latam through Takis launch of “Churrasco” (steak) and
arrival in new countries since late months of “Cream&Onion” (Colombia - June 2021)
2019 (Increase of 1455% in value sales fy´20)
TASTE GOOD
Takis Brand stretch
Brand with the highest growth rate
Source: Nielsen RMS
in Mx
© 2021 Nielsen Consumer LLC. All Rights Reserved.Experiences that bring “at home”, what people used to have pre-Covid
FOOD PAIRING OCCASION PRODUCT USAGE TRANSFORMATON
Snacks + liquor : show the mix between Categories teaching consumers how to cope Brands transforming consumption habits and
products that usually are consumed with the pandemic rediscovering habits and routines proposing new ways to consume
together, like Colombia´s Potato chips owning new motivations snacks
“Monte Rojo” paring with beer
Mozzarella sticks Dorilocos
covered with Cheetos
LIFE´S GOOD As spices
Sushi ingredient
Source: Nielsen RMS
24
© 2021 Nielsen Consumer LLC. All Rights Reserved.Consumption patterns creating new groups with different characteristics
Afternoon snacking Screen Time Munching
• Known and loved taste (real • Mantains core Cheez it taste (real
cheese) cheese)
• Known and loved texture • Core Cheez it crispy texture
• Satiating enough to tide over • Develop new thin shape ( not focused
between meals on satiating)
• Consistent square shape • Inconsistent piece shapes
• In a box format • Bag packaging to emulate competitive
munching options
65% Of consumers report that they have tested new products based solely on the form
of the packaging or the visual design.
Cheez it contributing to the 3% of Kellogg’s growth in Brazil
YTD Apr 21 in value sales
Source: Nielsen BASES Top Breakthrough Innovations 2020
25
© 2021 Nielsen Consumer LLC. All Rights Reserved.Focus on ingredients that offer peace of mind while
being indulgent
TREND INGREDIENTS BOOSTERS
Health preserving, wholesome, organic, Including ingredients that offer not only health
better quality ingredients like the Nopal but energy, like Grupo Nutresa including
chips (despite it says is fried) different seeds in Tosh products (seeds boost
metabolism, energy, etc)
FEEL GOOD
Source: Nielsen RMS
© 2021 Nielsen Consumer LLC. All Rights Reserved.Do nutritional stamps align to this need?
Stamps are approved in 10 countries FEEL GOOD
in Latam, being the most recent
Colombia, and there are more in
process. The first one to apply it was
Chile
Source: Nielsen RMS
© 2021 Nielsen Consumer LLC. All Rights Reserved.In Mexico stamped products lose volume In Peru stamps became a way to justify
mainly due to switching and purchase Premium purchase, as consumers spend
decline: it has impacted on the consumer more if the stamp is aligned to their need
Loss source (volume)
45% 52%
Decrease
of shoppers are willing to pay premium
prices for products that justify it
54%
Switching
More than half of the loss in volume is caused by the Premium segment grows 4 times more than the total
switching of purchases of products with a seal. basket in Peru
28
© 2021 Nielsen Consumer LLC. All Rights Reserved.In Chile law is perceived as successful, what is not stamped shows a drop in sales
Modern Trade Traditional
3.5
-2.2 -5.6 -4.0
-5.1 -6.6
Basket With Without
Basket With Without
BASKET With stamp Without stamp
Source: Nielsen scantrack – febrero 2019
29
© 2021 Nielsen Consumer LLC. All Rights Reserved.Final Thoughts © 2021 Nielsen Consumer LLC. All Rights Reserved.
Different types of consumer demanding at home options

1                                                   2                                             3
Wider range of consumer realities                   Restrictions initially affected traditional   Snacks mainly growing in modern channel
depending on how hard the Covid hit                 channel, but in the new normal its close-     but traditional remains as key format,
them; understanding their need is key               cheap offer helps for its recovery            considering bigger sizes demand inside the
                                                                                                  channel

4                                                   5
Consumers looking for experience in the             It seems food health stamps are changing
category, demanding taste, health and               consumption, making the consumer much
occasion offer                                      more aware of its purchase

                                                                                                                                          31
© 2021 Nielsen Consumer LLC. All Rights Reserved.
Thank you.
Alejandro Prieto Carlos Ordoñez
Alejandro.prieto@nielseniq.com carlos.ordonez@nielseniq.com
© 2021 Nielsen Consumer LLC. All Rights Reserved.You can also read