A new imaging technology based on Compton X-ray scattering
←
→
Page content transcription
If your browser does not render page correctly, please read the page content below
A new imaging technology based on Compton X-ray scattering

 Ángela Saá Hernández∗, Diego González-Díaz, Marcos Seoane
 Instituto Galego de Física de Altas Enerxías (IGFAE)
 Rúa de Xoaquín Díaz de Rábago, s/n, Campus Vida, 15782 Santiago de Compostela, Spain

 Carlos Azevedo
 I3N, Physics Department, University of Aveiro
 Campus Universitário de Santiago, 3810-193 Aveiro, Portugal
arXiv:2006.01504v3 [physics.ins-det] 28 Sep 2020

 Pablo Villanueva
 Department of Physics, Lund University
 P.O. Box 118, SE-22100 Lund, Sweden

 Abstract

 We describe a feasible implementation of a cellular microscope based on Compton x-ray scattering. The device, consisting
 largely of a 20 cm-thick sensitive volume filled with xenon at atmospheric pressure, forms photoelectron images by resorting to the
 electroluminescence produced in a custom-made multi-hole acrylic structure. Photon-by-photon counting can be achieved by processing
 the resulting images, taken in a continuous readout mode. The concept is amenable to permanent on-site 4π-coverage stations, but can
 be made portable at an acceptable performance compromise, targeting a nearly 2π-coverage instead. Based on Geant4 simulations, and
 a realistic detector design and response, we show that photon rates up to around 1011 ph/s on-sample (5 µm water-equivalent cell)
 can be processed, limited by the spatial diffusion of the photoelectrons in the gas. Following the Rose criterion and assuming the dose
 partitioning theorem, such a detector would allow obtaining 3d images of 5 µm unstained cells in their native environment in about
 24 h, with a resolution of 36 nm.

 I. Introduction for biological imaging is possible because, in spite of its
 inelastic nature, the SCXM technique makes an optimal
 Despite some x-ray facilities and experiments resort to use of the number of scattered photons per unit dose, i.e.,
 Compton scattering to probe for instance the electronic the deposited energy per unit of mass. Generally speaking,
 and magnetic structure of materials [1, 2], the limited flux an efficient use of Compton scattering implies, first and
 and brilliance (brightness) that is currently available at the foremost, that a nearly 4π-coverage is required (Fig. 1), at
 required high energies (&20 keV), seem to have precluded an optimal energy around 64 keV if aiming for instance at
 the popularization of these techniques. With the advent resolving DNA structures [8]. This poses a formidable chal-
 of the 4th generation of synchrotron light sources, such as lenge for current detection technologies, which are costly
 ESRF-EBS [3], the projected APS-U [4], Petra IV [5], and and have detection areas much below the required size.
 SPring-8-II [6], as well as the proposal of novel facilities Conversely, at lower x-ray energies (.10 keV), imaging
 based on x-ray free-electron lasers [7], which increase the based on coherent scattering has benefited from the devel-
 brightness and coherent flux for hard x-rays at least two opment of ultra-fast pixelated silicon detectors, capable of
 orders of magnitude beyond today’s capability, a unique performing photon-counting up to 107 counts/s/pixel. A
 opportunity arises to use Compton scattering in ways that nowadays typical detection area is 20 × 20 cm2 , sufficient
 were not conceived before. for covering the coherent forward cone at a distance of
 An example of these new possibilities is scanning Comp- about 1 m, at near 100% quantum efficiency [9]. At higher
 ton x-ray microscopy (SCXM) [8]. This technique has the energies, silicon must be replaced by a semi-conductor with
 potential of obtaining 10’s of nanometer resolution images a higher stopping power to x-rays, e.g., CdTe. However,
 of biological or radiosensitive samples without sectioning targeting a geometrical acceptance around 70% at 64 keV,
 or labelling. Thus, it bridges the capabilities of optical while providing enough space for the sample holder, pipes,
 and electron microscopes. Utilizing Compton interactions shielding and associated mechanics, would imply an im-
 posing active area for these type of detectors, well above
 ∗ Corresponding author: angela.saa.hernandez@usc.es

 1

A new imaging technology based on Compton X-ray scattering

100 cm2 and possibly up to 1000 cm2 . For comparison, contrast to that, we propose three main simplifications: i)
PILATUS3 X CdTe, one of the latest high-energy x-ray de- operation at atmospheric pressure, to facilitate the integra-
tectors used at synchrotron sources, has an active area of tion and operation at present x-ray sources, ii) removal of
27 cm2 [10]. Clearly, the availability of a 4π/high energy the photomultiplier-based energy-plane, and iii) introduc-
x-ray detector would soon become an important asset at tion of a compact all-in-one electroluminescence structure,
any next generation facility, if it can be implemented in a purposely designed for photon-counting experiments.
practical way. In this paper we discuss, starting from section II, the
 main concepts and working principles leading to our con-
 0.40 ceptual detector design. Next, in section III, we study the
 integrated over
 0.35 0 < < 10 (scaled x10) photon counting capabilities of a realistic detector imple-
 0.30 85 < < 95 (scaled x10) mentation. We present the expected performance when
 applied to the SCXM technique in section IV. Finally, we
 d /d [b/sr]

 0.25
 0.20 assess the limits and scope of the proposed technology in
 section V.
 0.15
 0.10
 0.05 II. TPC design
 0.00 0 20 40 60 80 100 120 140 160 180
 (deg) i. Dose and intrinsic resolving power
 In a scanning, dark-field, configuration, the ability to re-
Fig. 1. Differential cross section for Compton-scattered
 solve a feature of a given size embedded in a medium can
photons on DNA (in barn per stereoradian), for a lin-
 be studied through the schematic representation shown in
early polarized x-ray beam of 64 keV as obtained with
Monte Carlo simulations (using Geant4 [11]) and tabu-
lated values [12] (dashed lines), for different azimuthal
regions: φ = [0 − 10]◦ (green), φ = [85 − 95]◦ (blue) and
integrated over φ (red). φ indicates the angle relative to X-ray beam DNA case 0

the direction of the polarization vector. d' case f
 d
 a l a
 cell
 This situation has motivated us to consider a device scan air (or helium)
borrowed from particle physics: the electroluminescent
Time Projection Chamber (EL-TPC), and to discuss its per- 1012
 = 30 keV, He
formance as an SCX-microscope. TPCs, introduced by D. = 64 keV, He
 1011 = 30 keV, air
Nygren in 1974 [13, 14] are nowadays ubiquitous in particle
 required dose [Gy]

 = 64 keV, air
and nuclear physics, chiefly used for reconstructing par- 1010 max. tolerable dose
ticle interactions at high track multiplicities [15], and/or
when very accurate event reconstruction is needed [16, 17]. 109
A recent review on the TPC technology by one of us can 108
be found in [18]. The main characteristics of the particular
TPC-flavour proposed here can be summarized as: i) effi- 107
 10 20 30 40 50 60 70 80 90 100
cient to high energy x-rays thanks to the use of xenon as the feature size [nm]
active medium, ii) continuous readout mode with a time
sampling around ∆Ts = 0.5 µs, iii) typical temporal extent Fig. 2. Top: study case. A cubic DNA feature (size d) is
of an x-ray signal (at mid-chamber): ∆Tx−ray = 1.35 µs, embedded in a cubic water cell (l = 5 µm), surrounded
iv) about 2000 readout pixels/pads, and v) single-photon by air/helium (a = 5 mm). The photon beam scans re-
counting capability, with a Fano-limited energy resolution gions containing only water (case 0), or water and DNA
potentially down to 2% FWHM for 60 keV x-rays, thanks to (case f). These two cases are used to evaluate the re-
the electroluminescence mode. Importantly, however, the solving power of SCXM at a given dose. Bottom: dose
main advantage of using electroluminescence instead of needed to resolve a DNA feature as a function of its
conventional avalanche multiplication is the suppression size assuming 100% detection efficiency, for x-ray en-
of ion space charge, traditionally a shortcoming of TPCs ergies of 30 keV and 64 keV, obtained respectively with
operated under high rates. Geant4 [11] (solid lines) and using NIST values [21] (dot-
 Our design is inspired by the proposal in [19], that has ted line), and the formulas in text. The black line repre-
been successfully adopted by the NEXT collaboration in sents the maximum tolerable dose estimated from coher-
order to measure neutrino-less double-beta decay [20]. In ent scattering experiments [22].

2
A new imaging technology based on Compton X-ray scattering

Table 1. Mean free path for different materials at the as a metric for assessing the maximum radiation prior
studied energies 30 and 64 keV, according to NIST. to inducing structural damage [22]. By resorting to that
 estimate (black line in Fig. 2-bottom), the doses required
 Mean free path 30 keV 64 keV Material for resolving a feature of a given size (eq. 3) can be put
 λw [cm] 5.47 5.69 water into perspective. These doses, obtained for a DNA feature
 λ f [cm] 3.48 3.54 DNA embedded in a 5 µm water-equivalent cell using Geant4,
 λ a [cm] 4950.49 4945.60 air are shown as continuous lines. Results resorting to NIST
 values [21] and Hubbell parameterization for dσC /dΩ [12]
 are displayed as dashed lines, highlighting the mutual
Fig. 2-top, that corresponds to an arbitrary step within a
 consistency in this simplified case. Clearly, SCXM can
2d-scan. Three main assumptions lead to this simplified
 potentially resolve 33 nm-size DNA features inside 5 µm
picture: i) the dose fractionation theorem [23], based on
 cells, and down to 26 nm if a stable He atmosphere around
which one can expect 3d reconstruction capabilities at the
 the target can be provided.
same resolution (and for the same dose) than in a single 2d-
scan, ii) the ability to obtain a focal spot, d0 , down to a size Using surface dose as a valid metric for inter-comparison
comparable to (or below) that of the feature to be resolved, between SCXM and coherent scattering is at the moment an
d, and iii) a depth of focus exceeding the dimensions of open question and will require experimental verification.
the sample under study, l. A possible technical solution to In particular, eq. 3 assumes implicitly that the energy is
the latter two problems was introduced in [8], targeting a released locally. However, a 10 keV photoelectron has a
10 µm depth of focus at a 10 nm focal spot, thanks to the range of up to 200 nm in water, while a 64 keV one can
combination of multi-layer Laue lenses [24] with a stack reach 1.5 µm. An approximate argument can be sketched
of negative refractive ones. Since that technique would based on the fact that the average energy of a Compton
enable any of the scenarios discussed hereafter, we adopt electron for 64 keV x-rays (in the range 0-14 keV) is similar
the situation in Fig. 2-top as our benchmark case. Further, to that of a 10 keV photo-electron stemming from 10 keV
we use the Rose criterion [25] as the condition needed x-rays, a typical case in coherent diffraction imaging (CDI).
to discern case f (feature embedded within the scanned Given that at 64 keV most (around 70%) of the energy
volume) from case 0 (no feature), that reads in the Poisson is released in Compton scatters, the situation in terms of
limit as: locality will largely resemble that of coherent scattering.
 | N f − N0 | | N f − N0 | Hence, compared to CDI, only about 30% of the energy
 q = q ≥5 (1) will be carried away from the interaction region by the
 2
 σN + σN02
 N f + N0
 f energetic 64 keV photoelectrons. On the other hand, at
with N being the number of scattered photons. Substi- 30 keV (the other energy considered in this study) the
tution of physical variables in eq. 1 leads directly to a photoelectric effect contributes to 90% of the surface dose,
required fluence of: so one can expect a higher dose tolerance for SCXM than
 the one estimated here.
 −1
 (2l − d)· λ− 1 −1
 w + d · λ f + 4· a · λa Naturally, the shielding pipes, the structural materials of
 φ ≥ φmin = 25 (2)
 d02 · d2 ·(λ− 1 −1 2
 f − λw )
 the detector, the detector efficiency, the instrumental effects
 during the reconstruction, and the accuracy of the counting
and we will assume d0 ' d. Here λw , λ f , λ a are the algorithms can limit the achievable resolution, resulting in
Compton-scattering mean free paths of x-rays in water, dose values larger than the ones in Fig. 2. These effects are
DNA, and air (or helium), respectively (table 1), and di- discussed in the next sections.
mensions are defined in Fig. 2-top. Finally, we evaluate
the surface dose that will be imparted at the feature in these
conditions as: ii. Technical description of the TPC working
 " # principle
 NA dσC 1
 Z
 D = φmin · ε · · σph + ·(1 − )dΩ
 Mf dΩ 1 + m εc2 (1 − cos θ ) When x-rays of energies of the order of 10’s of keV interact
 e
 (3) in xenon gas at atmospheric pressure, the released photo-
where σph is the photoelectric cross section and dσC /dΩ is electron creates a cloud of secondary ionization (O(10000 s)
the differential cross section for Compton scattering, both electrons) with a typical (1σ) size of 0.25-1 mm (Fig. 3-top).
evaluated at the feature. M f is the feature molar mass, If the x-ray energy is above that of the xenon K-shell, char-
NA the Avogado number, ε the photon energy and θ its acteristic emission around 30-34 keV will ensue, in about
scattering angle. The dose inherits the approximate l/d4 70% of the cases. At these energies, x-ray interactions in
behaviour displayed in equation (2). xenon take place primarily through photoelectric effect,
 Working with surface dose is convenient because it has with just a small (. 1%) probability of Compton scattering.
been used earlier, in the context of coherent scattering, The ionization clouds (hereafter ‘clusters’) drift, due to

 3
A new imaging technology based on Compton X-ray scattering

 the electric field Edri f t of the TPC, towards the electrolumi-
 a nescence/anode plane, as shown in Fig. 4-top, following a
 diffusion law as a function of the drift distance z:
 √
 σz( x,y) = DL∗ (T ) z (4)

 where DL∗ and DT∗ are the longitudinal and transverse dif-
 fusion coefficients, respectively. In fact, diffusion is imprac-
 tically large in pure noble gases, given that the cooling of
 ionization electrons is inefficient under elastic collisions
 only. Addition of molecular additives, enabling vibrational
 b
 degrees of freedom at typical electron energies, is a well
 established procedure known to improve the situation dras-
 tically, and can be accurately simulated with the electron
 transport codes Magboltz/Pyboltz [28, 29]. In particular,
 a small (0.4%) addition of CH4 is sufficient to reduce the
 cluster size well below that in pure xenon (Fig. 3-bottom),
 as required for photon-counting. An essential ingredient to
 the use of Xe-CH4 admixtures is the recent demonstration
 cluster size after charge collection that the electroluminescence signal is still copious in these
 30
 pure xenon conditions [30].1 Hence, for a drift field Edri f t = 110 V/cm,
 25 Xe/CH4 (99.6/0.4)
 (99.7/0.3) the cluster’s longitudinal size can be kept at the σz = 4 mm
 transverse [mm]

 20 level even for a 50 cm-long drift, corresponding to a tem-
 15 poral spread of σt = 0.75 µs, while the transverse size
 10 approaches σx,y =10 mm. The electron drift velocity is
 vd = σz /σt =5 mm/µs.
 5
 a The proposed detection concept is depicted in Fig. 4-top,
 0
 with Fig. 4-bottom displaying a close-up of the pixelated
 101
 readout region, that relies on the recent developments on
 large-hole acrylic multipliers [32]. Provided sufficient field
 temporal [ s]

 focusing can be achieved at the structure, as shown in Fig.
 100 4-bottom, the ionization clusters will enter a handful of
 holes, creating a luminous signal in the corresponding sili-
 b
 con photomultiplier (SiPM) situated right underneath, thus
 functioning, in effect, as a pixelated readout. In summary:
 50 100 150 200 250 300 350 400 i) x-rays that Compton-scatter at the sample interact with
 electric field [V/cm]
 the xenon gas and give rise to clusters of characteristic
Fig. 3. Top(a): ionization distributions in xenon gas, size somewhere in the range 1-10 mm-σ, depending on
stemming from x-rays interacting in an infinite volume. the distance to the electroluminescence plane; ii) given
They are obtained after aligning each x-ray ionization the relatively large x-ray mean free path of around 20 cm
cloud by its barycenter, and projecting it over an arbi- in xenon at 1 bar, one anticipates a sparse distribution of
trary axis. Calculations from Geant4 are compared with clusters, that can be conveniently recorded with 10 mm-
the microscopic code DEGRAD developed by S. Biagi size pixels/pads, on a readout area of around 2000 cm2
[26]. Top(b): probability of characteristic x-ray emission (Npix = 2000).
in xenon for an incident photon energy of 30 keV (red) From the FWHM √ per x-ray cluster at about mid-chamber:
and 64 keV (blue), in Geant4. The K-shell (green) and ∆ x,y | x−ray = 2.35/ 2 · σx,y = 16 mm, an average mul-
L-shell (orange) lines, as tabulated in [27], are shown for tiplicity M of around 4 per cluster may be assumed if
comparison. Bottom(a): transverse size of a point-like resorting to 10 mm × 10 mm pixels/pads. The tempo-
ionization cluster after drifting along 50 cm, obtained ral spread, on the √ other hand, can be approximated by:
from Magboltz. Bottom(b): longitudinal size of a point- ∆Tx−ray = 2.35/ 2 · σz /vd = 1.35 µs. Taking as a reference
like ionization cluster (in time units), in the same condi- an interaction probability of Pint = 2.9 × 10⁻⁴ (5 µm water-
tions. Results for pure xenon and a fast ‘counting’ mix- equivalent cell, 10 mm of air), a 70% detection efficiency e,
ture based on Xe/CH4 are shown for comparison. 1 This unanticipated result, that might not look significant at first
 glance, results from a very subtle balance between the quenching of the
 xenon triplet state and the cooling of drifting electrons through inelastic
 collisions [31].

4
A new imaging technology based on Compton X-ray scattering

 Edrift above the Poisson-limit or proportionality of response is
 irreparably lost. We address this problem specifically in
 t= z/vd section III.

 phe3 iii. Geometry optimization with Geant4
 phe2 The suitability of the TPC technology for SCXM depends
 primarily on the ability to detect ∼ 60 keV photons within
 a realistic gas volume, in the absence of pressurization.
 Given that the mean free path of 60 keV x-rays in xenon
 is 20 cm, the most natural 4π-geometry adapting to this
 phe1 case is a hollow cylinder with a characteristic scale of
 around half a meter. On the other hand, the geometrical
 acceptance is a function of arctan(2Ri /L), with L being the

 length and Ri the inner radius of the cylinder. In order to
 1 place the sample holder, step motor, pipes and associated
 2 3 mechanics, we leave an Ri = 5 cm inner bore. Finally, the
 t xenon thickness (Ro -Ri ), that is the difference between the
 outer and inner TPC radii, becomes the main factor for
 10mm
 E [kV/cm] the detector efficiency, as shown in Fig. 5. We discuss two
 photon energies: 30 and 64 keV. The latter represents the
 theoretical optimum for SCXM in terms of dose, while the
 former, sitting just below the K-shell energy of xenon, is
 a priory more convenient for counting due to the absence
 of characteristic x-ray emission inside the chamber. The
 mean free path is similar for the two energies, therefore no
 obvious advantage (or disadvantage) can be appreciated
 in terms of detector efficiency, at this level of realism.

 TPB coating = 30 keV, L=25cm = 64 keV, L=25cm
 ITO coating = 30 keV, L=50cm = 64 keV, L=50cm
 acrylic plate = 30 keV, L=100cm = 64 keV, L=100cm
 SiPMs 90
 80
Fig. 4. Top: schematic representation of the working
 70
 Efficiency (%)

principle of the EL-TPC. Photons scattered at the sam-
ple reach the xenon gas, creating ionization clusters that 60
drift, while diffusing, towards the anode plane, where 50
they induce electroluminescence. Bottom: close-up of
 40
the electroluminescence region, based on the recently
introduced acrylic-based electroluminescence multipli- 30
ers, developed in collaboration between IGFAE and the 20
 10 20 30 40 50
CERN-RD51 workshops [32]. Xe thickness [cm]
 Fig. 5. Efficiency as a function of the thickness of the
and an m = 20% pixel occupancy, this configuration yields xenon cylinder (Ro -Ri ) for different lengths, at ener-
a plausible estimate of the achievable counting rate as: gies of 30 and 64 keV. The dotted line indicates the
 benchmark geometry considered in text, for a length
 1 m · Npix 1
 rmax = = 3.6 × 10¹¹ (ph/s) (5) L = 50 cm.
 ePint M ∆Tx−ray
compatible a priori with the beam rates for hard x-rays fore- We consider now a realistic (and realizable) geometry,
seen at the new generation of light sources [3]. However, opting for an inner cylinder shell made out of 0.5 mm-
in order to have a realistic estimate of the actual counting thick aluminum walls, with 2 mm HDPE (high density
performance it is imperative to understand which level polyethylene), 50 µm kapton and 15 µm copper, sufficient
of occupancy/pile-up can be really tolerated by the detec- for making the field cage of the chamber, that is needed to
tor, before the photon-counting performance deteriorates minimize fringe fields (inset in Fig. 6). The HDPE cylinder

 5
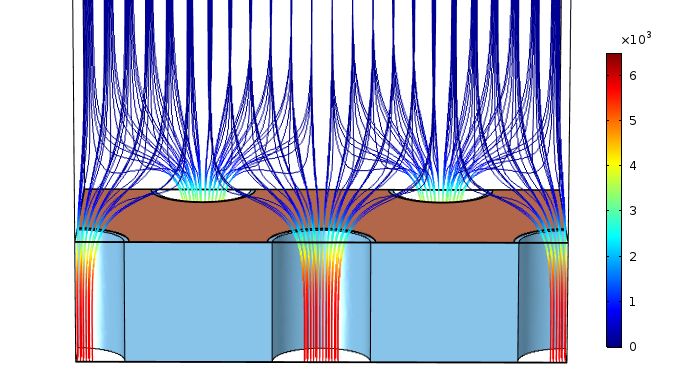
A new imaging technology based on Compton X-ray scattering

can be custom-made and the kapton-copper laminates are 50 cm
commercially available and can be adhered to it by ther- A 25 cm B
mal bonding, bolting, or even epoxied, for instance. The Copper (15 µm)
external cylinder shell may well have a different design, Kapton (50 µm)
but it has been kept symmetric for simplicity. We con- High density
sider in the following a configuration that enables a good polyethylene (2 mm)
compromise in terms of size and flexibility: L = 50 cm Aluminum (0.5 mm)
and Ro = 25 cm. The geometrical acceptance nears in this
case 80%. Additional 10 cm would be typically needed, C
axially, for instrumenting the readout plane and taking the
signal cables out of the chamber, and another 10 cm on the Lead shielding
 y
cathode side, for providing sufficient isolation with respect
to the vessel, given that the voltage difference will near z Steel shielding
10 kV. Although those regions are not discussed here in
detail, and have been replaced by simple covers, the reader x
is referred to [20] for possible arrangements. With these
choices, the vessel geometry considered in simulations is Fig. 6. A) TPC geometry in Geant4, aimed at providing
shown in Fig. 6, having a weight below 10 kg. nearly 4π-coverage for SCXM. B) detail of the region
 The necessary structural material of the walls and the faced by x-rays when entering the detector, that includes
presence of air in the hall reduce the overall efficiency from the vessel and field cage. C) detail of the sample region
62.8% to 58.5% (64 keV) and from 64.5% to 40.0% (30 keV). and the shielding cones.
The beam enters the experimental setup from the vacuum
pipes (not included in the figure) into two shielding cones electron, n phe , that is the single most important figure of
(made of stainless steel and covered with lead shields) and merit for an EL-TPC, can be computed from the layout in
from there into the sample region. Our case study is that Fig. 4-bottom, after considering: an optical yield Y = 250
of a 33 nm DNA feature inside a 5 µm cell, and 5 mm air ph/e/cm at Eel = 6 kV/cm [32], a TPB wavelength-shifting
to and from the shielding cones. The conical geometry efficiency W LSETPB = 0.4 [33], a solid angle coverage at
is conceived not to crop the angular acceptance of the x- the SiPM plane of ΩSiPM = 0.3 and a SiPM quantum effi-
rays scattered on-sample, providing enough space to the ciency QESiPM = 0.4. Finally, according to measurements
focusing beam, and enabling sufficient absorption of stray in [30], the presence of 0.4% CH4 reduces the scintillation
x-rays from beam-air interactions along the pipes. In a 4π probability by Pscin = 0.5, giving, for a h = 5 mm-thick
geometry as the one proposed here, the cell holder and structure:
step motor should ideally be placed along the polarization
axis, where the photon flux is negligible. n phe = Y · h · W LSETPB · ΩSiPM · QESiPM · Pscin = 3 (6)

 Since the energy needed to create an electron-ion pair in
iv. Image formation in the TPC xenon is WI = 22 eV, each 30-64 keV x-ray interaction will
The parameters used for computing the TPC response give raise to a luminous signal worth 4000-9000 photoelec-
rely largely on the experience accumulated during the trons (phe), spanning over 4-8 pixels, hence well above the
NEXT R&D program. We consider a voltage of -8.5 kV SiPM noise. The energy resolution (FWHM) is obtained
at the cathode and 3 kV across the electroluminescence from [30] as:
structure, with the anode sitting at ground, a situation
 v !r
 2
 u
that corresponds to fields around Edri f t = 110 V/cm and
 u 1 σG WI
 R(ε = 64 keV) ' 2.355t F + 1+ 2 = 3.1%
Eel = 6 kV/cm in the drift and electroluminescence re- n phe G ε
gions, respectively. The gas consists of Xe/CH4 admixed (7)
at 0.4% in volume in order to achieve a 40-fold reduction with σG /G being the width of the single-photon distribu-
in cluster size compared to operation in pure xenon (Fig. tion (around 0.1 for a typical SiPM) and F ' 0.17 the Fano
3-bottom). The electroluminescence plane will be optically factor of xenon. For comparison, a value compatible with
coupled to a SiPM matrix, at the same pitch, forming a R(ε = 64 keV) = 5.5% was measured for acrylic-hole mul-
pixelated readout. The optical coupling may be typically tipliers in [32]. The contribution of the energy resolution is
done with the help of a layer of ITO (indium-tin oxide) and included as a gaussian smearing in the TPC response.
TPB (tetraphenyl butadiene) deposited on an acrylic plate, Finally, the time response function of the SiPM is in-
following [20]. This ensures wavelength shifting to the cluded as a Gaussian with a 7 ns width, convoluted with
visible band, where SiPMs are usually more sensitive. The the transit time of the electrons through the electrolumines-
number of SiPM-photoelectrons per incoming ionization cence structure ∆TEL = 0.36 µs, being both much smaller

6
A new imaging technology based on Compton X-ray scattering

in any case than the typical temporal spread of the clusters III. Photon counting capabilities
(dominated by diffusion). The sampling time is taken to be
∆Ts = 0.5 µs as in [20], and a matrix of 1800 10 mm-pitch i. Ideal counting limit
SiPMs is assumed for the readout. Images are formed after
applying a 10 phe-threshold to all SiPMs. The attenuation in the structural materials, re-scatters, char-
 acteristic emission, as well as the detector inefficiency, are
 unavoidable limiting factors for counting. These intrinsic
 200 200 limitations can be conveniently evaluated from the signal-
 to-noise ratio, defined from the relative spread in the num-
 175
 ber of ionization clusters per scan step (see Fig. 2), as
 100 150

 SiPM signal (phe)
 obtained in Monte Carlo (n MC ):
 125
 y [mm]

 0 S/N = n MC /σn MC (8)
 100
 75
 100
 50 1.00 Counting mode
 Calorimetry mode
 200 25 0.95

 signal-to-noise ratio
 200 100 0 100 200 0 0.90
 x [mm]
 0.85
 Fig. 7. A typical TPC image reconstructed from the 0.80
 SiPM signals (in phe), as recorded in one time-slice 0.75
(∆Ts = 0.5 µs), for a beam rate of r = 3.7 × 10¹⁰ s−1 .
 0.70
The crosses show the clusters’ centroids, obtained from Case 0 Case 1 Case 2 Case 3
‘MC-truth’ information. - point-like cell - realistic cell - realistic cell - realistic cell
 - 100% detection - xenon volume - xenon volume - xenon volume
 efficiency - TPC vessel - TPC vessel
 - air, beampipes
 A fully processed TPC image for one time slice
(∆Ts = 0.5 µs), obtained at a beam rate of r = 3.7 × Fig. 8. Intrinsic counting performance (using Monte
1010 ph/s for a photon energy ε = 64 keV, is shown in Fig. Carlo truth information) for 64 keV x-ray photons, char-
7. The main clusters have been marked with crosses, by acterized by the signal to noise ratio (relative to case 0).
resorting to ‘Monte Carlo truth’, i.e., they represent the Photon counting (green) and calorimetric mode (red) are
barycenter of each primary ionization cluster in Geant4. displayed as a function of the realism of the simulations.
The beam has been assumed to be continuous, polarized
along the x-axis, impinging on a 5 µm water cube sur- Figure 8 shows the deterioration of the S/N for 64 keV
rounded by air, with a 33 nm DNA cubic feature placed at photons, as the realism of the detector increases. It has
its center. The Geant4 simulations are performed at fixed been normalized to the relative spread in the
time, and the x-ray interaction times are subsequently dis- √ number of
 photons scattered on-sample per scan step, N0 , so that it
tributed uniformly within the dwell time corresponding equals 1 for a perfect detector (see appendix A):
to each position of the scan. It must be noted that interac-
tions taking place at about the same time may be recorded 1
 S/N ∗ ≡ √ · S/N (9)
at different times depending on the z-position of each in- N0
teraction, (and viceversa, clusters originating at different
interaction times, may eventually be reconstructed in the The figure also shows the S/N ∗ in ‘calorimetric mode’,
same time slice). This scrambling (unusual under typical with the counting performed by simply integrating the
TPC operation) renders every time slice equivalent for the total collected light per scan step (ε tot ), instead of photon-
purpose of counting. In principle, the absolute time and z by-photon. S/N ∗ is defined √ in that case, equivalently,
position can be disambiguated from the size of the cluster, as: S/N ∗ = (ε tot /σε tot )/ N0 . The values obtained are
using the diffusion relation in eq. 4, thus allowing photon- just slightly below the ones expected considering detector
by-photon reconstruction in time, space, and energy. A inefficiency alone (see appendix A):
demonstration of the strong correlation between z-position
 √
and cluster width, for 30 keV x-ray interactions, can be S/N ∗ ' e (10)
found in [34] for instance.
 The design parameters used in this subsection are com- therefore suggesting a small contribution from re-scatters
piled in tables 1-4 of the Appendix B. in the materials or other secondary processes.

 7
A new imaging technology based on Compton X-ray scattering

ii. Real counting 107
 I
 I
Given the nature of the detector data (Fig. 7), consisting 106
of voxels grouped forming ellipsoidal shapes, generally
separable, and of similar size, an implementation of the K- 105

 inertia (I)
means clustering method [35], based on an iterative refine-
ment technique, self-suggests. It has been implemented as 104
follows: i) the ‘countable’ clusters are first identified time- Ith
slice by time-slice using Monte Carlo truth information, as 103
those producing a signal above a certain energy threshold
(ε th ) in that slice, chosen to be much lower than the typical 102 0 10 20 30 40 50
cluster energies; the assumption is that, for those small number of counted clusters (n)
clusters that are left out of the counting process, most of
the energy will be collected in adjacent time-slices from Fig. 9. The K-means cluster-counting algorithm evalu-
which charge has spread out due to diffusion, and where ates the partition of N observations (voxelized ionization
they will be properly counted once the algorithm is applied clusters in our case) in n clusters, so as to minimize the
there; ii) a weighted inertia (I) distribution is then formed, inertia I, defined as the sum of the squared distances of
as conventionally done in K-means, and a threshold (δIth ) the observations to their closest cluster center. In the plot:
is set to the variation of the inertia with the number of convergence of K-means for a beam rate of 1011 ph/s.
clusters counted by the algorithm (n), optimized for each A SavitzkyâĂŞGolay filter is applied for the purpose of
beam rate condition (Fig. 9). We concentrate on beam rates smoothing the variation of the inertia δI.
for which the average efficiency and purity of the cluster
identification in 2d slides is larger than 80%, as the ones
illustratively depicted in Fig. 10. The counting efficiency place for the cluster distributions obtained slice-by-slice,
and purity can been defined, as customary, as: where this systematic overcounting-undercounting effect
 makes the cluster distribution marginally (although sys-
 nmatched tematically) narrower, as seen in Fig. 11 (bottom). As a
 ecounting = (11)
 n MC consequence, the directly related magnitude S/N ∗ (eqs. 8,
 nmatched 9), is not deteriorated by the counting algorithm. On the
 pcounting = (12)
 n other hand, proportionality is lost, and its impact needs to
 be addressed, depending on the application. The particular
where nmatched is the number of counted clusters correctly
 case of SCXM is scrutinized in the next section.
assigned to MC clusters and n MC is the number of MC
clusters. The K-means optimization parameters have been Finally, the photon-counting efficiency (eq. 11) can be
chosen to simultaneously maximize the counting efficiency assessed through Fig. 12-top, where it is displayed as a
while achieving n ' n MC , therefore ecounting ' pcounting . function of the beam rate on target. It can be seen how, for
 the case of 30 and 64 keV photons, its value exceeds 85%
 Fig. 11 (top) shows the performance of the counting algo-
 for rates up to 1011 ph/s and 0.5 · 1011 ph/s, respectively.
rithm, presenting the average number of clusters counted
 At these high beam rates, counting capability suffers from
per 2d slice as a function of beam rate, with ε th and δIth op-
 event pile-up while, at low beam rates, it is limited by the
timized for each case as described above (green line). Red
 presence of low-energy deposits (corresponding to x-ray
lines indicate the predictions outside the optimized case,
 interactions for which most of the energy is collected in
that illustrate the consistent loss of linearity as the beam
 adjacent slices). It must be recalled, at this point, that
rate increases. Fig. 11 (bottom) shows the relative spread
 a complete reconstruction requires combining 2d time-
in the number of counted clusters σn /n, and comparison
 slices as the ones studied here, in order to unambiguously
with Monte Carlo truth. These results can be qualitatively
 identify clusters in 3d. Given that clusters extend over 4-6
understood if recalling that, by construction, the threshold
 slices due to diffusion, and are highly uncorrelated, a 3d
inertia is strongly correlated with the average number of
 counting efficiency well above 90% can be anticipated in
clusters and its size. Therefore, a simple K-means algo-
 the above conditions.
rithm will inevitably bias the number of counted clusters
to match its expectation on I, if no further considerations
are made. This leads to systematic overcounting for less IV. Projections for SCXM
clusters than δIth has been adjusted to, and undercount-
ing in the opposite case, as reflected by Fig. 11 (top). In We propose the characterization of the EL-TPC technology,
present conditions, a 2nd order polynomial is sufficient to in light of its performance as a cellular microscope, through
capture this departure from proportionality introduced by the study of the smallest resolvable DNA-feature (size d)
the algorithm. A similar (although subtler) effect takes as a function of the scan time (∆Tscan ). Justification of the

8
A new imaging technology based on Compton X-ray scattering

 200 increase in fluence (and hence in dose), as:
 100 200 φ → φ0 = φ/e (15)
 0
 y [mm]

 0 175 D→D = D /e (16)
 100 150 that results in slightly deteriorated values compared to Fig.

 SiPM signal (phe)
 200 125 2: d† = 36 nm instead of d† = 33 nm for ε=64 keV, and
 d† = 44 nm instead of d† = 37 nm for ε=30 keV.
 200 100
 The limiting scan time (i.e., above which structural dam-
 100 75 age will appear) can be hence assessed from the behaviour
 of eq. 14 with beam rate, as shown in Fig. 12-bottom. For
 y [mm]

 0 50
 64 keV, the loss of linearity of the counting algorithm at
 100 25 high rates results in a turning point at 9.3 × 10¹⁰ ph/s,
 200 0 above which an increase in rate stops improving the ability
 200 100 0 100 200 200 100 0 100 200 to resolve an image. For 30 keV, due to the absence of
 x [mm] x [mm] characteristic emission, only about half of the clusters are
 produced and the optimum rate is found at a higher value,
Fig. 10. Cluster counting performance for typical
 r = 1.6 × 10¹¹ . The counting efficiency and purity in these
∆Ts = 0.5 µs time-slices, for different energies (ε) and
 conditions is in the range 82-84%.
beam rates (r). Crosses indicate the cluster centroids
from MC and circles are the clusters found by K-means.
The average counting-efficiency and purity along the de- 60 K-means

 clusters per slice
tector are given below in brackets. Top left: ε = 64 keV
 MC truth
and r = 3.7 × 10¹⁰ ph/s (ecounting = 88.2%, pcounting = 40
86.9%). Top right: ε = 64 keV and r = 7.5 × 10¹⁰ ph/s
(ecounting = 84.2%, pcounting = 83.2%). Bottom left: ε = 20
30 keV and r = 6.5 × 10¹⁰ ph/s (ecounting = 87.9%, pcounting
= 87.5%). Bottom right: ε = 30 keV and r = 1.3 × 10¹¹ ph/s
(ecounting = 83.9%, pcounting = 83.1%). For ε = 30 keV only 0.3
 relative spread

about half of the clusters are produced, which enables
measuring at higher beam rates than ε = 64 keV, at com- 0.2
parable efficiency and purity.

 0.1
 0.2 0.4 0.6 0.8 1.0 1.2 1.4
following derivations can be found in appendix A, starting beam rate (ph/s) 1e11
with:
 Fig. 11. Top: counting performance characterized
 !1/4
 (lλ− 1 −1 through the average number of clusters counted per 2d
 w + 2aλ a ) 1
d= R2 2l 2 time-slice as a function of the beam rate for ε = 64 keV.
 (λ−f 1 − λ−Cl (r )2 · S/N ∗,2 · r · ∆Tscan
 1 2
 w )
 Bottom: relative spread of the number of clusters per
 (13)
 2d time-slice from√Monte Carlo truth and counted with
Here R equals 5 under the Rose criterion and the rate-
 K-means. The 1/ r expectation (dashed) is shown for
dependent coefficient Cl < 1 depends on the deviation of
 comparison.
the counting algorithm from the proportional response, its
expression being given in appendix A. Other magnitudes It is now possible to evaluate eq. 13 under different sce-
have been already defined. Since the smallest resolvable narios: i) a relatively simple calorimetric mode (total energy
feature size (d† ) is ultimately determined by the dose im- is integrated), for which we assume a hard x-ray beam rate
parted at it when structural damage arises (eq. 3, Fig. typical of the new generation of synchrotron light sources
2), the necessary scan time to achieve such performance as r = 1012 ph/s, and ii) a rate-limited photon-by-photon
 † ) can be readily obtained:
(∆Tscan counting scenario, for the optimum rates r = 9.3 × 10¹⁰
 ph/s (64 keV) and r = 1.6 × 10¹¹ ph/s (30 keV), obtained
 † (lλ− 1 −1
 w + 2aλ a ) 1 above. Values for Cl (r ) are extracted from 2nd -order fits
 ∆Tscan = R2 2l 2 −1 −1 2 C (r )2 · S/N ∗,2 · r · ( d† )4
 (λ f − λw ) l as discussed in appendix. The remaining parameters are
 (14) common to both modes: S/N ∗ = 0.71, efficiency e = 58.5%
For a detector with finite efficiency, the value of d† can (64 keV), S/N ∗ = 0.63, e = 40.0% (30 keV); finally we as-
be recalculated by simply accounting for the necessary sume l = 5 µm, a = 5 mm, R = 5, with the mean free

 9
A new imaging technology based on Compton X-ray scattering

 = 30 keV Calorimetry Counting
 90 100
 efficiency (%) = 64 keV = 64 keV = 30 keV
 90
 counting

 80

 feature size [nm]
 85
 70
 60
 80 50 dose limit
 50 40 dose limit
 30
 limited resolution [h]
 time to reach dose-

 40
 20
 30 10
 10 2 10 1 100 101 102 10 2 10 1 100 101 102
 20 scanning time [hours] scanning time [hours]
 10
 Fig. 13. Resolution achievable with a 64 keV photon
 0 0.5 1.0 1.5 2.0 2.5
 beam (left) and a 30 keV photon beam (right) as a func-
 beam rate [ph/s] 1e11
 tion of the scan time for a cell of 5 µm (green line). The
 red line shows the limit in which a calorimetric measure-
Fig. 12. Top: efficiency of the cluster counting process ment is performed and photon-by-photon counting is
as a function of the beam rate for x-rays of 30 and 64 keV. abandoned. The horizontal line shows the dose-limited
Bottom: time to reach the dose-limited resolution as a resolution in each case, prior to inducing structural dam-
function of the beam rate. A minimum is reached when age.
the product of Cl2 · r reaches a maximum, i.e. the time
decreases with beam rate until the effect of the non-
proportional counting becomes dominant. The optimum from xenon will unavoidably create confusion, so if
beam rate and corresponding counting efficiency are unambiguous correspondence between the ionization
marked with a dotted line for both energies. cluster and the parent x-ray is needed, one must con-
 sider operation at . 30 keV.
paths (λ) taken from table 1. Results are summarized in
Fig. 13. At 64 keV, the dose-limited resolution d† = 36 nm 2. Data processing and realism: photon-by-photon counting
can be achieved in approximately 24 h while, at 30 keV, at a rate nearing 5 · 107 ph/s over the detector (≡
d† = 44 nm is reached in just 8 h. In the absence of 1011 ph/s over the sample) , as proposed here, is a
systematic effects, operation in calorimetric mode would computer intensive task. Achieving this with sufficient
bring the scan time down to ≤ 1 h in both cases, although speed and accuracy will require the optimization of
abandoning any photon-by-photon counting capabilities. the counting algorithm, something that will need to
 be accomplished, ultimately, with real data. To this
 aim, both the availability of parallel processing as
 V. Discussion well as the possibility of simultaneous operation in
 calorimetric mode are desirable features. This will
The results presented here illustrate the potential of the
 be studied in the near future through a dedicated
proposed technology for high energy x-ray detection (up to
 experiment.
' 60-70 keV) at high-brightness synchrotron light sources,
in particular as a cellular microscope. In deriving them,
we have adopted some simplifications, that should be su- 3. Simplicity and compactness: the detector geometry pro-
perseded in future work, and are analyzed here: posed here has been conceived as a multi-purpose
 permanent station. A portable device focused purely
 1. Availability of photon-by-photon information: cluster re- on SCXM, on the other hand, could simply consist
 construction with high efficiency and purity enables of a cubic 25cm × 25cm × 25cm vessel that may be
 x, y, t + tdri f t and ε determination, and arguably the positioned, e.g., on top of the sample (at a distance
 interaction time t and z position can be obtained from of about ∼ 5cm). The geometry would thus have an
 the study of the cluster size, as it has been demon- overall efficiency around 30% for√ 64 keV photons. For
 strated for 30 keV x-rays at near-atmospheric pressure SCXM, and given that S/N ∗ ' e as shown in this
 before [34]. This can help at removing backgrounds work, a loss of efficiency can be almost fully compen-
 not accounted for, as well as any undesired systematic sated by means of the corresponding increase in beam
 effect (beam or detector related). Since this technique rate, at the price of a deteriorated value for the dose
 provides a parallax-free measurement, the concept limited resolution d† . In this case, a value correspond-
 may be extended to other applications, e.g., x-ray crys- ing to d† = 41 nm could be achieved in 12 h, for our
 tallography. The presence of characteristic emission test study.

10
A new imaging technology based on Compton X-ray scattering

 4. Feasibility: the technology proposed comes from the sources. The proposed detector can be implemented either
 realm of high energy physics, with an inherent op- as a permanent facility or a portable device. Concentrating
 erational complexity that might not be affordable at on 5 µm cells as our test case, we estimate that, under a
 light source facilities. A further possibility could be Rose imaging criterion, and assuming the dose fraction-
 considered, by resorting to ultra-fast (1.6 ns resolu- ation theorem, 36 nm DNA features may be resolved in
 tion) hit-based TimePix cameras (e.g., [36, 37]) with 24 h by using a permanent station and 41 nm in 12 h with
 suitable VUV-optics, allowing 256 × 256 pixel readout a portable device. Our analysis includes detailed Geant4
 at 80 MHit/s, and thus abandoning completely the transport, a realistic detector response and a simplified
 SiPM readout. The vessel would consist barely on 2d-counting algorithm based on K-means. Thus, we un-
 an acrylic hole multiplier and a cathode mesh, filled derstand that the obtained rate capability (and scan time)
 with the xenon mixture at atmospheric pressure. This should be understood as lower (upper) limits to the ac-
 would compromise partly the ability to disentangle tual capabilities when using more refined 3d-algorithms,
 clusters by using time information, as well as energy including constraints in energy and cluster size.
 information, since only the time over threshold would Although substantially below the nominal photon-
 be stored and not the temporal shape of each cluster, counting capabilities of solid-state pixelated detectors, we
 or its energy. On the other hand, it would enhance believe that a number of applications could benefit from
 the spatial information by a factor of 30 relative to this development, targeting at the newly available 4th gener-
 the SiPM matrix proposed here (the hole pitch of the ation synchrotron light sources providing high-brightness
 acrylic hole multiplier should be reduced accordingly). hard x-rays. Indeed, previous conceptual studies point to
 Indeed, TimePix cameras are regularly used nowadays about a factor ×2 increase in resolving power for SCXM
 for photon and ion counting applications [38, 39], but compared to CDI, in similar conditions to ours. The present
 have not been applied to x-ray counting yet, to the best simulation work just comes to support the fact that a com-
 of our knowledge. The counting and signal processing plete 3d scan would be realizable in about 24 h time, under
 algorithms could be in this way directly ported, given realistic assumptions on the experimental setup, detector
 the similarity with the images taken in those applica- response and counting algorithms.
 tions. The readiness of such an approach, aiming at
 immediate implementation, represents an attractive Funding Information
 and compelling avenue.
 ASH is funded through project ED431F 2017/10 (Xunta de
 5. Comparison to other x-ray imaging techniques: the imag-
 Galicia) and DGD through the Ramon y Cajal program,
 ing criterion and study case chosen in this work is
 contract RYC-2015-18820.
 inspired by [8], where a dose-limited resolution of
 34 nm was obtained for SCXM, compared to around
 75 nm for CDI. A typical bio-molecule feature was cho- Acknowledgments
 sen, embedded in a 5 µm cell placed in vacuum. The
 We thank Ben Jones and David Nygren (University of Texas
 present study shows that a 36 nm DNA feature can be
 at Arlington), as well as our RD51 colleagues for stimulat-
 resolved in similar conditions even after accounting for
 ing discussions and encouragement, and specially to David
 the presence of beam-shielding, air, a realistic detec-
 José Fernández, Pablo Amedo, and Pablo Ameijeiras for
 tor, and with photon-counting implemented through
 discussions on the K-means method.
 a simple K-means algorithm.

 A. Relation between resolution and scan
 VI. Conclusions and outlook
 time
We introduce a new 4π-technology (EL-TPC) designed for
detecting ∼ 60 keV x-ray photons for rates up to 5 · 107 ph/s
(over the detector), with an overall detection efficiency (in-
cluding geometrical acceptance) around 60%. At these i. Proportional (ideal) case
rates, photon-by-photon counting can be achieved at an We start from the imaging criterion, applied to an arbitrary
efficiency and purity above 80%, and plausibly well above position of the step motor within a cell-scan:
90% after improvements on the counting algorithm em-
ployed in this work. The technology has been re-purposed | N f − N0 |
 q =R (17)
from its original goal in particle physics (the experimen- 2 + σ2
 σN
 f N0
tal measurement of ββ0ν decay) and, with a number of
minor simplifications, it has been optimally adapted to where R = 5 corresponds to the Rose condition. N f is
the task of Compton x-ray microscopy in upcoming light the number of scattered photons from a water medium

 11
A new imaging technology based on Compton X-ray scattering

with a ‘to-be-resolved’ feature inside it, and N0 contains from which the time needed for a complete 2d scan can be
only water, instead (see Fig. 2-top). This equation can be expressed as:
re-expressed as:
 2 −1 −1
 2 2l ( lλw + 2aλ a ) 1
 | N f − N0 | ∆T scan = R 4 − 1 − 1 ∗,2 · r
 (24)
 r  = R (18) d (λ f − λw ) 2 S/N
 σN 2  σ 2
 N
 N 2f N f + N02 N00 and, solving for d:
 f

that, under the assumption N f & N0 , and defining the !1/4
 2 (lλ− 1
 w + 2aλ a )
 −1 1
signal to noise ratio as S/N ≡ N f /σN f ' N0 /σN0 can be d= R 2l 2 (25)
rewritten, in general, as: (λ−f 1 − λ− 1 2
 w ) S/N · r · ∆Tscan
 ∗ ,2

 1 N f − N0 Expression 25 can be approximated under the simplifying
 √ × S/N = R (19)
 2 N0 assumption that S/N ∗ is mainly limited by Poisson statis-
 tics and by the efficiency of the detector (modelled through
 When considering photon counting, it is understood that
 a simple binomial distribution), disregarding production
a relation can be established between the distribution of
 of secondary particles or re-scatters across structural mate-
ionization clusters that are counted in the detector (mean
 rials, hence:
n, standard deviation σn ) and the distribution of scattered
photons (mean N f ' N0 , standard deviation σN f ' σN0 ). If 1 n 1 N0 e √
 S/N ∗ = √ '√ p = e
resorting to an unbiased counting algorithm, this relation N0 n
 σ 2
 N0 e N0 + e · (1 − e) · N0
will be proportional. In that case, the pre-factors on the (26)
left-hand-side of eq. 19 remain, and any detector-related From which it can be seen that detector efficiency and beam
effect is contained in the quantity: rate enter as a product in the denominator in formulas 24
 and 25. Consequently, detector inefficiency increases the
 Nf N0 n
 S/N = ' → (20) scan time linearly, as intuitively expected.
 σN f σN0 σn

 At fixed number of scattered photons (' N0 ) the relative ii. Non proportional case
fluctuations in the number of counted clusters will increase We consider now the more realistic case where there is a
due to efficiency losses, characteristic emission, and re- non-proportional response of the counting algorithm. This
scatters on the cell itself, air or structural materials, thereby is characterized, for the K-means algorithm implemented
resulting in a loss of signal to noise. It is convenient to in text, as a second order polynomial (Fig. 11):
normalize this definition to the Poisson limit for a perfect
detector: n = a + br + cr2 (27)
 1
 S/N ∗ = √ · S/N (21)
 N0 By analogy, if the K-means parameters are optimized for
and so the new quantity S/N ∗
 is now defined between a certain beam rate, r, the response to cell regions causing
0 and 1, with S/N = n/σn obtained, in the main docu- a different number of scattered photons N, relative to the
ment, from detailed simulations of the photon propagation water-only case, will be:
through the experimental setup. Substitution of N f and  2
N0 by physical quantities in eq. 19 yields: N N
 n = a+b +c (28)
 N0 N0
 −1 −1
 1 d(λ f − λw )
 × S/N ∗ × N0 = R
 p
 √ −1 −1
 (22) and a(r ), b(r ), c(r ) are now rate-dependent. Eq. 19 should
 2 lλw + 2aλ a be rewritten, accordingly, as:
with d being the feature size, l the cell dimension, and
 1 n f − n0
λ f ,w,a the mean free paths in the feature, water and air, √ × S/N = R (29)
respectively, as defined in text. 2 n0
 Now, we make use of the fact that N0 = r · ∆Tstep · and the relative variation in n becomes:
(lλ− −1
 w + 2aλ a ), with r being the beam rate, ∆Tstep a time
 1
 N 2f − N02
 !
step within the scan, and ∆Tscan the total time for a 2d scan: n f − n0 1 N f − N0
  2 = b +c (30)
∆T = l · ∆T . By replacing N in the previous n0 a+b+c N0 N02
 scan d step 0
equation we obtain: that, for N f ' N0 , can be re-expressed as:

 1 d2 ( λ − 1 −1
 f − λw ) n f − n0 N f − N0
 × S/N ∗ × r · ∆Tscan = R (23)
 p
 √ −1 −1 1/2 = Cl (r ) (31)
 2 l (lλw + 2aλ a ) n0 N0

12
A new imaging technology based on Compton X-ray scattering with Cl (r ) = ab++b2c +c . Hence, a loss of linearity during the Table 4. Parameters of the electroluminescent structure counting process enters linearly in eq. 19. The general expression for the resolvable feature size as a function of rh 3 mm hole radius the beam rate is, finally, by analogy with eq. 25: t 5 mm thickness ph 10 mm hole-to-hole pitch !1/4 − 1 (lλw + 2aλ a ) − 1 1 m opt 250 ph/e/cm optical gain [32] d = R2 2l 2 ∗,2 · r · ∆T P scin 0.5 scincillation probabil- (λ−f 1 − λ− 1 2 2 w ) Cl (r ) · S/N scan ity [30] (32) that is the expression used in the main document, for the Table 5. Parameters of the readout achievable resolution as a function of the scan time, under a given imaging criterion R. The detector response enters psi 10 pitch of SiPM matrix this final expression in three ways: ∆T 0.5 µs time sampling / time per s 1. Through the increased fluctuation in the number of slice detected clusters, relative to the ideal (Poisson) count- σt 7 ns temporal width of SiPM ing limit, characterized through the signal to noise signal [40] ratio, S/N ∗ . σG /G 0.1 relative spread of single phe charge in SiPM [40] 2. The non-linearity of the counting algorithm, Cl . Ω TPB 0.3 geometrical acceptance of SiPM after wavelength 3. The assumed maximum operating rate, r, for which shifter the product Cl2 · r reaches a maximum, as for larger QEwls 0.4 quantum efficiency of rates stops improving the ability to resolve an image. wavelength shifter [33] QEsi 0.4 quantum efficiency of B. EL-TPC parameters SiPM [40] Here we compile the main parameters used for the simu- lation of the TPC response, together with additional refer- References ences when needed. [1] Y. Sakurai, ’High-Energy Inelastic-Scattering Beamline Table 2. Parameters of the TPC vessel for Electron Momentum Density Study’, J. Synchrotron Ri 5 cm inner radius Rad. 5 (1998) 208-214. Ro 25 cm outer radius [2] Th. Tschentscher, J. E. McCarthy, V. Honkimaki, and L 50 cm length P. Suortti, ’High-energy magnetic Compton scattering experiments at ESRF’, J. Synchrotron Rad. 5 (1998) 940- 942. Table 3. Main gas parameters (xenon + 0.4% CH4 ) [3] G. Admans, P. Berkvens, A. Kaprolat, and J.-L. Revol in the drift/collection region (Ed.), ’ESRF upgrade programme phase II (2015 - 2022)’, Ec 110 V/cm collection field Technical Design Study, http://www.esrf.eu/Apache_ Vcat -8.5 kV cathode voltage files/Upgrade/ESRF-orange-book.pdf F 0.15 Fano factor [19] WI 22 eV energy to create an e− - [4] ’Advanced Photon Source Upgrade Project’, Final De- ion pair [19] sign Report APSU-2.01-RPT-003 (2019). √ DT∗ 0.548 mm/ cm transverse diffusion coef- ficient [29] [5] C. G. Schroer, R. Röhlsberger, E. Weckert, √ R. Wanzenberg, I. Agapov, R. Brinkmann, and DL∗ 1.52 mm/ cm longitudinal diffusion co- efficient [29] W Leemans (Ed.), ’PETRA IV: Upgrade of vd 5.12 mm/µs drift velocity [29] PETRA III to the Ultimate 3D X-ray Micro- in the electroluminescence (EL) region scope’, Conceptual Design Report (2019), https: EEL 6 kV/cm EL field //bib-pubdb1.desy.de/record/426140/files/ Vgate -3 kV voltage at FAT-GEM en- DESY-PETRAIV-Conceptual-Design-Report.pdf trance (‘gate’) [6] Y. Asano et al., ’SPring-8-II’, Conceptual Design Report vd,EL 13.7 mm/µs drift velocity [29] (2014), http://rsc.riken.jp/eng/pdf/SPring-8-II. pdf 13
A new imaging technology based on Compton X-ray scattering

[7] Z. Huang, ’Brightness and coherence of synchrotron 1.5)’, National Institute of Standards and Technol-
 radiation and FELs’, Proceedings of the 4th Interna- ogy, https://physics.nist.gov/PhysRefData/Xcom/
 tional Particle Accelerator Coference IPAC2013, Shang- html/xcom1.html
 hai, China.
 [22] M. R. Howells, T. Beetz, H. N. Chapman, C. Cui,
[8] P. Villanueva-Perez, S. Bajt, and H. N. Chapman, ’Dose J. M. Holton, C. J. Jacobsen, J. Kirz, E. Lima, S. March-
 efficient Compton X-ray microscopy’, Optica 5, (2018) esini, H. Miao, D. Sayre, D. A. Shapiro, J. C. H. Spence,
 450-457. and D. Starodub, ’An assessment of the resolution lim-
 itation due to radiation-damage in x-ray diffraction
[9] Andreas Förster, Stefan Brandstetter and Clemens microscopy’, J. Electron. Spectrosc. Relat. Phenom. 170,
 Schulze-Briese, ’Transforming X-ray detection with hy- (2009) 4-12.
 brid photon counting detectors’, Phil. Trans. R. Soc. A
 377 (2019) 20180241. [23] R. Hegerl and W. Hoppe, ’Influence of electron noise
 on three-dimensional image reconstruction’, Z. Natur-
[10] DECTRIS - detecting the future, ’Pilatus3 X CdTe’ forsch. 31, (1976) 1717-1721.
 https://www.dectris.com/products/pilatus3/pilatus3-
 x-cdte-for-synchrotron/. [24] S. Bajt, et al., ’X-ray focusing with efficient high-NA
 multilayer Laue lenses’, Light: Science & Applications
[11] S. Agostinelli et al., ’Geant4-a simulation toolkit’, Nucl. volume 7, (2018) 17162.
 Instr. Meth. 506 (2003) 250-303.
 [25] A. Rose, ’A unified approach to the performance of
[12] J. H. Hubbell et al., ’Atomic form factors, incoher- photographic film, television pickup tubes, and the
 ent scattering functions, and photon scattering cross human eye’, J. Soc. Motion Pict. Eng. 47, (1946) 273-294.
 sections’, J. Phys. Chem. Ref. Data, 4,(1975) 471.
 [26] S.Biagi, ’DEGRAD: an accurate auger cascade model
[13] D. Nygren, ’Proposal to investigate the feasibility of a for interaction of photons and particles with gas mix-
 novel concept in particle detection’, Tech. report 2-22- tures in electric and magnetic fields (version 3.9)’,
 74, Lawrence Berkeley Lab (1974). http://degrad.web.cern.ch/degrad/.
[14] D. Nygren, ’Origin and Development of the TPC idea’, [27] A. C. Thompson, D. Vaughan, et al. ’X-Ray Data Book-
 Nucl. Instr. Meth. A 907 (2018) 22-30. let’, Table 1-3. https://xdb.lbl.gov/xdb.pdf
[15] J. Alme et al., ’The ALICE TPC, a large 3-dimensional [28] S. Biagi, ’Monte carlo simulation of electron drift and
 tracking device with fast readout for ultra-high multi- diffusion in counting gases under the influence of elec-
 plicity events’, Nucl. Instr. Meth., A 622 (2010) 316-367. tric and magnetic fields’, Nucl. Instr. Meth. A 421 (1999)
[16] N. S. Phan, R. J. Lauer, E. R. Lee, D. Loomba, J. A. J. 234-240. http://magboltz.web.cern.ch/magboltz/.
 Matthews, E. H. Miller, ’GEM-based TPC with CCD [29] B. Al Atoum, S. F. Biagi, D. González-Díaz, B.J.P Jones,
 imaging for directional dark matter detection’, Astrop. A.D. McDonald, ’Electron Transport in Gaseous De-
 Phys., 84 (2016) 82-96. tectors with a Python-based Monte Carlo Simulation
[17] R. Acciarri et al., ’Long-Baseline Neutrino Facility Code’, Comput. Phys. Commun. 254 (2020) 107357.
 (LBNF) and Deep Underground Neutrino Experiment [30] C. Henriques, ’Studies of xenon mixtures with molec-
 (DUNE) Conceptual Design Report, Volume 4: The ular additives for the NEXT electroluminescence TPC’,
 DUNE Detectors at LBNF’, arXiv:1601.02984. PhD Thesis, Departamento de Física da Faculdade de
[18] D. González-Díaz, F. Monrabal, and S. Murphy, Ciencias e Tecnologia da Universidade de Coimbra
 ’Gaseous and Dual-Phase TPCs for Imaging rare pro- (2019).
 cesses’, Nucl. Instr. Meth. A 878 (2018) 200-255.
 [31] C.D.R. Azevedo, D. González-Díaz, et al., ’Microscopic
[19] D. Nygren, ’Optimal detectors for WIMP and 0-νββ simulation of xenon-based optical TPCs in the presence
 searches: Identical high-pressure xenon gas TPCs?’, of molecular additives’, Nucl. Inst. Meth. A 877 (2018)
 Nucl. Instr. Meth. A 581 (2007) 632-642. 157-172.

 [32] D. González-Díaz et al., ’A new amplification struc-
[20] F. Monrabal et al. (the NEXT collaboration), ’The Next
 White (NEW)’, JINST 13 (2018) P12010. ture for time projection chambers based on electrolu-
 minescence’, proc. to the 6th International Conference
[21] M. J. Berger, J. H. Hubbell, S. M. Seltzer et al., on MicroPattern Gas Detectors, La Rochelle, May 5th,
 ’XCOM: Photon Cross Section Database (version 2019, arXiv:1907.03292.

14
A new imaging technology based on Compton X-ray scattering

[33] C. Benson, G. Orebi Gann and V. Gehman, ’Measure-
 ments of the Intrinsic Quantum Efficiency and Visible
 Reemission Spectrum of Tetraphenyl Butadiene Thin
 Films for Incident Vacuum Ultraviolet Light’, Eur. Phys.
 J. C, vol. 78, (2018) 329.

[34] D. González-Díaz et al., ’Accurate γ and MeV-
 electron track reconstruction with an ultra-low diffu-
 sion Xenon/TMA TPC at 10 atm’, Nucl. Instr. Meth. A,
 804 (2015) 8-24.

[35] J. MacQueen, ’Some methods for classification and
 analysis of multivariate observations’, Proc. of the 5th
 Berkeley Symposium on Mathematical Statistics and
 Probability, Volume 1: Statistics, 281-297, University of
 California Press, 1967.

[36] https://www.amscins.com/tpx3cam/.

[37] A. Nomerotski, ’Imaging and time stamping of pho-
 tons with nanosecond resolution in Timepix based op-
 tical cameras’, Nucl. Instr. Meth. A, 937 (2019) 26-30.

[38] L. M. Hirvonen, M. Fisher-Leving, K. Suhling, A.
 Nomerotski, ’Photon counting phosphorescence life-
 time imaging with TimepixCam’, Rev. Sci. Instrum. 88,
 (2017) 013104.

[39] M. Fisher-Levine, R. Boll, F. Ziaee, C. Bomme, B. Erk,
 D. Rompotis, T. Marchenko, A. Nomerotski, D. Rolles,
 ’Time-Resolved ion Imaging at Free-Electron Lasers
 using TimepixCam’, J. of Synchrotron Radiat. 25 (2018)
 336-345.

[40] https://www.hamamatsu.com/eu/en/product/
 optical-sensors/mppc/mppc{_}mppc-array/index.
 html

 15
You can also read